Travel, Tourism & Hospitality
- Number of international tourist arrivals worldwide 2005-2023, by region
The number of international tourist arrivals worldwide increased across all regions in 2023 compared to the previous year. That said, except from the Middle East, inbound arrivals remained below the figures reported in 2019, before the impact of the COVID-19 pandemic. Overall, Europe reported the highest volume of inbound travelers over the period considered, with around 700 million arrivals in 2023.

What are the most visited countries by inbound travelers?
With Europe being the most visited region by inbound travelers, it does not surprise that two European destinations top the ranking of countries with the highest number of inbound tourist arrivals worldwide. Both before and after the impact of the health crisis, France and Spain reported the most inbound tourist arrivals in the world, ahead of the United States. That said, the United States was the country with the highest international tourism receipt worldwide over the same period.
What is the global economic impact of travel and tourism?
According to the World Travel and Tourism Council (WTTC), the total contribution of travel and tourism to the gross domestic product worldwide was expected to surpass nine trillion U.S. dollars in 2023, nearly caching up with pre-pandemic levels. This figure refers to the direct, indirect, and induced impact of the global travel and tourism sector. Meanwhile, the total number of travel and tourism jobs worldwide was estimated to exceed 300 million that year.
Number of international tourist arrivals worldwide from 2005 to 2023, by region (in millions)
Additional Information
Show sources information Show publisher information Use Ask Statista Research Service
2005 to 2023
Data prior to 2011 were previously published by the source.
Other statistics on the topic Travel and tourism in Europe
- European countries with the highest number of inbound tourist arrivals 2019-2022
Leisure Travel
- Market cap of leading online travel companies worldwide 2023
- Leading airlines in Europe based on passenger numbers 2022
- Travel and tourism: share of GDP in the EU-27 and the UK 2019-2022, by country
- Immediate access to statistics, forecasts & reports
- Usage and publication rights
- Download in various formats
You only have access to basic statistics.
- Instant access to 1m statistics
- Download in XLS, PDF & PNG format
- Detailed references
Business Solutions including all features.
Statistics on " Travel and tourism in Europe "
- International tourist arrivals worldwide 2019-2022, by subregion
- Travel and tourism's total contribution to GDP in Europe 2019-2022
- Distribution of travel and tourism expenditure in Europe 2019-2022, by type
- Distribution of travel and tourism expenditure in Europe 2019-2022, by tourist type
- Travel and tourism's total contribution to employment in Europe 2019-2022
- Leading European countries in the Travel & Tourism Development Index 2021
- International tourist arrivals in Europe 2006-2023
- International tourist arrivals in Europe 2010-2022, by region
- Monthly number of inbound tourist arrivals in Europe 2019-2023
- Monthly change in tourist arrivals in Europe 2020-2023, by region
- Inbound tourism visitor growth in Europe 2020-2025, by region
- International tourist arrival growth in European countries 2019-2023
- International tourism spending in Europe 2019-2022
- Number of domestic tourist trips in EU-27 countries and the UK 2018-2021
- Number of domestic arrivals in tourist accommodation in the EU 2011-2022
- Domestic tourism spending in Europe 2019-2022
- Domestic tourism spending in EU-27 countries and the UK 2019-2022
- Share of Europeans planning to take a domestic summer trip 2023, by country
- Outbound tourism visitor growth worldwide 2020-2025, by region
- Outbound visitor growth in Europe 2020-2025, by region
- Number of outbound trips from EU-27 countries and the UK 2018-2021
- European countries with the highest outbound tourism expenditure 2019-2022
- Travel intentions of Europeans in the next six months 2024, by destination
- Share of Europeans planning to travel domestically or in Europe 2023-2024
- Europeans planning domestic or European trips in the next six months 2024, by age
- Europeans planning leisure domestic or European trips 2024, by trip type
- European travelers' favorite destinations for their next European trip 2024
- Number of tourist accommodation establishments in the EU 2012-2022
- Number of overnight stays in tourist accommodation establishments in the EU 2011-2022
- Hotel market revenue in Europe 2017-2028
- Hotel market revenue in Europe 2017-2028, by region
- Share of hotel market sales in Europe 2017-2028, by channel
- Estimated EV/EBITDA ratio in the online travel market 2024, by segment
- Market capitalization of leading travel and leisure companies in Europe 2024
- Travel and tourism revenue in Europe 2018-2028, by segment
- Number of users of package holidays in Europe 2019-2028
- Number of users of hotels in Europe 2019-2028
- Number of users of vacation rentals in Europe 2019-2028
- Revenue of travel and tourism market in selected countries worldwide 2023
Other statistics that may interest you Travel and tourism in Europe
- Basic Statistic Number of international tourist arrivals worldwide 2005-2023, by region
- Premium Statistic International tourist arrivals worldwide 2019-2022, by subregion
- Basic Statistic Travel and tourism's total contribution to GDP in Europe 2019-2022
- Basic Statistic Distribution of travel and tourism expenditure in Europe 2019-2022, by type
- Basic Statistic Distribution of travel and tourism expenditure in Europe 2019-2022, by tourist type
- Basic Statistic Travel and tourism: share of GDP in the EU-27 and the UK 2019-2022, by country
- Basic Statistic Travel and tourism's total contribution to employment in Europe 2019-2022
- Premium Statistic Leading European countries in the Travel & Tourism Development Index 2021
Inbound tourism
- Premium Statistic International tourist arrivals in Europe 2006-2023
- Premium Statistic International tourist arrivals in Europe 2010-2022, by region
- Premium Statistic European countries with the highest number of inbound tourist arrivals 2019-2022
- Basic Statistic Monthly number of inbound tourist arrivals in Europe 2019-2023
- Basic Statistic Monthly change in tourist arrivals in Europe 2020-2023, by region
- Premium Statistic Inbound tourism visitor growth in Europe 2020-2025, by region
- Premium Statistic International tourist arrival growth in European countries 2019-2023
- Basic Statistic International tourism spending in Europe 2019-2022
Domestic tourism
- Premium Statistic Number of domestic tourist trips in EU-27 countries and the UK 2018-2021
- Basic Statistic Number of domestic arrivals in tourist accommodation in the EU 2011-2022
- Basic Statistic Domestic tourism spending in Europe 2019-2022
- Basic Statistic Domestic tourism spending in EU-27 countries and the UK 2019-2022
- Premium Statistic Share of Europeans planning to take a domestic summer trip 2023, by country
Outbound tourism
- Premium Statistic Outbound tourism visitor growth worldwide 2020-2025, by region
- Premium Statistic Outbound visitor growth in Europe 2020-2025, by region
- Premium Statistic Number of outbound trips from EU-27 countries and the UK 2018-2021
- Premium Statistic European countries with the highest outbound tourism expenditure 2019-2022
European travelers
- Premium Statistic Travel intentions of Europeans in the next six months 2024, by destination
- Premium Statistic Share of Europeans planning to travel domestically or in Europe 2023-2024
- Premium Statistic Europeans planning domestic or European trips in the next six months 2024, by age
- Premium Statistic Europeans planning leisure domestic or European trips 2024, by trip type
- Premium Statistic European travelers' favorite destinations for their next European trip 2024
Accommodation
- Basic Statistic Number of tourist accommodation establishments in the EU 2012-2022
- Basic Statistic Number of overnight stays in tourist accommodation establishments in the EU 2011-2022
- Premium Statistic Hotel market revenue in Europe 2017-2028
- Premium Statistic Hotel market revenue in Europe 2017-2028, by region
- Premium Statistic Share of hotel market sales in Europe 2017-2028, by channel
Travel companies
- Basic Statistic Market cap of leading online travel companies worldwide 2023
- Premium Statistic Estimated EV/EBITDA ratio in the online travel market 2024, by segment
- Premium Statistic Market capitalization of leading travel and leisure companies in Europe 2024
- Premium Statistic Leading airlines in Europe based on passenger numbers 2022
- Premium Statistic Travel and tourism revenue in Europe 2018-2028, by segment
- Premium Statistic Number of users of package holidays in Europe 2019-2028
- Premium Statistic Number of users of hotels in Europe 2019-2028
- Premium Statistic Number of users of vacation rentals in Europe 2019-2028
- Premium Statistic Revenue of travel and tourism market in selected countries worldwide 2023
Further related statistics
- Premium Statistic Number of international tourist arrivals by land Myanmar 2010-2019
- Premium Statistic Italy: number of inbound tourist arrivals in Apulia 2009-2015
- Premium Statistic Number of international tourist arrivals in Myanmar 2010-2019
- Premium Statistic Number of international tourist arrivals by air Myanmar 2010-2019
- Basic Statistic Foreign tourist arrivals Thailand 2015-2023
- Premium Statistic Number of international tourist arrivals by sea Myanmar 2010-2019
- Premium Statistic Italy: number of tourist arrivals in hotels in Lecce by origin 2009-2015
- Premium Statistic Italy: number of international tourist arrivals 2015, by region
- Premium Statistic Italy: number of international tourist arrivals 2015, by country of origin
- Premium Statistic Italy: number of international tourist arrivals 2015, by continent of origin
- Premium Statistic Italy: tourist arrivals in Lecce 2009-2015
- Premium Statistic Italy: share of international tourist arrivals 2015, by continent of origin
- Premium Statistic Number of international visitor arrivals from the Philippines to Indonesia 2014-2023
- Premium Statistic Number of international visitor arrivals from Australia to Indonesia 2014-2023
- Premium Statistic Number of international visitor arrivals from Singapore to Indonesia 2014-2023
- Basic Statistic Arrivals of non-Australian citizens from overseas destinations to Australia 2018-2021
- Basic Statistic TRAVELSAT satisfaction index concerning reception in regions in France 2015
Further Content: You might find this interesting as well
- Number of international tourist arrivals by land Myanmar 2010-2019
- Italy: number of inbound tourist arrivals in Apulia 2009-2015
- Number of international tourist arrivals in Myanmar 2010-2019
- Number of international tourist arrivals by air Myanmar 2010-2019
- Foreign tourist arrivals Thailand 2015-2023
- Number of international tourist arrivals by sea Myanmar 2010-2019
- Italy: number of tourist arrivals in hotels in Lecce by origin 2009-2015
- Italy: number of international tourist arrivals 2015, by region
- Italy: number of international tourist arrivals 2015, by country of origin
- Italy: number of international tourist arrivals 2015, by continent of origin
- Italy: tourist arrivals in Lecce 2009-2015
- Italy: share of international tourist arrivals 2015, by continent of origin
- Number of international visitor arrivals from the Philippines to Indonesia 2014-2023
- Number of international visitor arrivals from Australia to Indonesia 2014-2023
- Number of international visitor arrivals from Singapore to Indonesia 2014-2023
- Arrivals of non-Australian citizens from overseas destinations to Australia 2018-2021
- TRAVELSAT satisfaction index concerning reception in regions in France 2015
- Regional Support Office for Asia and the Pacific (RSOAP)
- Member States in Asia and the Pacific
- SUSTAINABLE TOURISM OBSERVATORIES (INSTO)

According to the first UNWTO World Tourism Barometer of the year, international tourism ended 2023 at 88% of pre-pandemic levels , with an estimated 1.3 billion international arrivals . The unleashing of remaining pent-up demand, increased air connectivity, and a stronger recovery of Asian markets and destinations, are expected to underpin a full recovery by the end of 2024 (UNWTO Tourism Barometer January 2024 – Press Release) .
An estimated 1286 million international tourists (overnight visitors) were recorded around the world in 2023, an increase of 34% over 2022. International tourism recovered 88% of pre-pandemic levels, supported by strong pent-up demand (UNWTO Tourism Barometer January 2024-Excerpt) .
International tourism is expected to fully recover pre-pandemic levels in 2024, with initial estimates pointing to 2% growth above 2019 levels. This central forecast by UNWTO remains subject to the pace of recovery in Asia and to the evolution of existing economic and geopolitical downside risks (UNWTO Tourism Barometer January 2024 – Press Release) .
Asia and the Pacific reached 65% of pre-pandemic levels, with a gradual recovery since the start of 2023 following the reopening of several markets and destinations. However, performance among subregions were mixed, with South Asia recovering 87% of pre-pandemic levels and North-East Asia, 55% (UNWTO Tourism Barometer January 2024-Excerpt) .
There is still significant room for recovery across Asia. The recent reopening of several source markets and destinations is expected to boost recovery in the region and globally (UNWTO Tourism Barometer January 2024- Excerpt) .
Read more on the UNWTO Tourism Barometer (January 2024 excerpt) here .
About the UNWTO World Tourism Barometer
The UNWTO World Tourism Barometer is a publication of the World Tourism Organization (UNWTO) that monitors short-term tourism trends regularly to provide global tourism stakeholders with up-to-date analysis of international tourism. The information is updated several times a year and includes an analysis of the latest data on tourism destinations (inbound tourism) and source markets (outbound tourism). The Barometer also includes three times a year Confidence Index based on the UNWTO Panel of Tourism Experts survey, which provides an evaluation of recent performance and short-term prospects for international tourism.
Regional Support Office in Asia and the Pacific (RSOAP)
Rsoap a to z.
- Sustainable Tourism Observatories(INSTO)
UNWTO A to Z
- About UNWTO
- Affiliate Members
- Member States
- Tourism in the 2030 Agenda
- World Tourism Day
- Technical Cooperation
- ASIA AND THE PACIFIC
- MIDDLE EAST
- RESOURCES/SERVICES
- Sustainable Development of Tourism
- Ethics, Culture and Social Responsibility
- Market Intelligence
- Tourism Data Dashboard
- Publications
- UNWTO Academy
Partners links

© UNWTO Regional Support Office for Asia and the Pacific (RSOAP)
International tourism, number of arrivals

All Countries and Economies
Country Most Recent Year Most Recent Value
- Privacy Notice
- Access to Information
This site uses cookies to optimize functionality and give you the best possible experience. If you continue to navigate this website beyond this page, cookies will be placed on your browser. To learn more about cookies, click here.
Travel, Tourism & Hospitality
- Number of international tourist arrivals worldwide 2005-2023, by region
The number of international tourist arrivals worldwide increased across all regions in 2023 compared to the previous year. That said, except from the Middle East, inbound arrivals remained below the figures reported in 2019, before the impact of the COVID-19 pandemic. Overall, Europe reported the highest volume of inbound travelers over the period considered, with around 700 million arrivals in 2023.
What are the most visited countries by inbound travelers?
With Europe being the most visited region by inbound travelers, it does not surprise that two European destinations top the ranking of countries with the highest number of inbound tourist arrivals worldwide. Both before and after the impact of the health crisis, France and Spain reported the most inbound tourist arrivals in the world, ahead of the United States. That said, the United States was the country with the highest international tourism receipt worldwide over the same period.
What is the global economic impact of travel and tourism?
According to the World Travel and Tourism Council (WTTC), the total contribution of travel and tourism to the gross domestic product worldwide was expected to surpass nine trillion U.S. dollars in 2023, nearly caching up with pre-pandemic levels. This figure refers to the direct, indirect, and induced impact of the global travel and tourism sector. Meanwhile, the total number of travel and tourism jobs worldwide was estimated to exceed 300 million that year.
Number of international tourist arrivals worldwide from 2005 to 2023, by region (in millions)
Additional Information
Show sources information Show publisher information Use Ask Statista Research Service
2005 to 2023
Data prior to 2011 were previously published by the source.
Other statistics on the topic Travel and tourism in Europe
- European countries with the highest number of inbound tourist arrivals 2019-2022
Leisure Travel
- Market cap of leading online travel companies worldwide 2023
- Leading airlines in Europe based on passenger numbers 2022
- Travel and tourism: share of GDP in the EU-27 and the UK 2019-2022, by country
- Immediate access to statistics, forecasts & reports
- Usage and publication rights
- Download in various formats
You only have access to basic statistics.
- Instant access to 1m statistics
- Download in XLS, PDF & PNG format
- Detailed references
Business Solutions including all features.
Statistics on " Travel and tourism in Europe "
- International tourist arrivals worldwide 2019-2022, by subregion
- Travel and tourism's total contribution to GDP in Europe 2019-2022
- Distribution of travel and tourism expenditure in Europe 2019-2022, by type
- Distribution of travel and tourism expenditure in Europe 2019-2022, by tourist type
- Travel and tourism's total contribution to employment in Europe 2019-2022
- Leading European countries in the Travel & Tourism Development Index 2021
- International tourist arrivals in Europe 2006-2023
- International tourist arrivals in Europe 2010-2022, by region
- Monthly number of inbound tourist arrivals in Europe 2019-2023
- Monthly change in tourist arrivals in Europe 2020-2023, by region
- Inbound tourism visitor growth in Europe 2020-2025, by region
- International tourist arrival growth in European countries 2019-2023
- International tourism spending in Europe 2019-2022
- Number of domestic tourist trips in EU-27 countries and the UK 2018-2021
- Number of domestic arrivals in tourist accommodation in the EU 2011-2022
- Domestic tourism spending in Europe 2019-2022
- Domestic tourism spending in EU-27 countries and the UK 2019-2022
- Share of Europeans planning to take a domestic summer trip 2023, by country
- Outbound tourism visitor growth worldwide 2020-2025, by region
- Outbound visitor growth in Europe 2020-2025, by region
- Number of outbound trips from EU-27 countries and the UK 2018-2021
- European countries with the highest outbound tourism expenditure 2019-2022
- Travel intentions of Europeans in the next six months 2024, by destination
- Share of Europeans planning to travel domestically or in Europe 2023-2024
- Europeans planning domestic or European trips in the next six months 2024, by age
- Europeans planning leisure domestic or European trips 2024, by trip type
- European travelers' favorite destinations for their next European trip 2024
- Number of tourist accommodation establishments in the EU 2012-2022
- Number of overnight stays in tourist accommodation establishments in the EU 2011-2022
- Hotel market revenue in Europe 2017-2028
- Hotel market revenue in Europe 2017-2028, by region
- Share of hotel market sales in Europe 2017-2028, by channel
- Estimated EV/EBITDA ratio in the online travel market 2024, by segment
- Market capitalization of leading travel and leisure companies in Europe 2024
- Travel and tourism revenue in Europe 2018-2028, by segment
- Number of users of package holidays in Europe 2019-2028
- Number of users of hotels in Europe 2019-2028
- Number of users of vacation rentals in Europe 2019-2028
- Revenue of travel and tourism market in selected countries worldwide 2023
Other statistics that may interest you Travel and tourism in Europe
- Basic Statistic Number of international tourist arrivals worldwide 2005-2023, by region
- Premium Statistic International tourist arrivals worldwide 2019-2022, by subregion
- Basic Statistic Travel and tourism's total contribution to GDP in Europe 2019-2022
- Basic Statistic Distribution of travel and tourism expenditure in Europe 2019-2022, by type
- Basic Statistic Distribution of travel and tourism expenditure in Europe 2019-2022, by tourist type
- Basic Statistic Travel and tourism: share of GDP in the EU-27 and the UK 2019-2022, by country
- Basic Statistic Travel and tourism's total contribution to employment in Europe 2019-2022
- Premium Statistic Leading European countries in the Travel & Tourism Development Index 2021
Inbound tourism
- Premium Statistic International tourist arrivals in Europe 2006-2023
- Premium Statistic International tourist arrivals in Europe 2010-2022, by region
- Premium Statistic European countries with the highest number of inbound tourist arrivals 2019-2022
- Basic Statistic Monthly number of inbound tourist arrivals in Europe 2019-2023
- Basic Statistic Monthly change in tourist arrivals in Europe 2020-2023, by region
- Premium Statistic Inbound tourism visitor growth in Europe 2020-2025, by region
- Premium Statistic International tourist arrival growth in European countries 2019-2023
- Basic Statistic International tourism spending in Europe 2019-2022
Domestic tourism
- Premium Statistic Number of domestic tourist trips in EU-27 countries and the UK 2018-2021
- Basic Statistic Number of domestic arrivals in tourist accommodation in the EU 2011-2022
- Basic Statistic Domestic tourism spending in Europe 2019-2022
- Basic Statistic Domestic tourism spending in EU-27 countries and the UK 2019-2022
- Premium Statistic Share of Europeans planning to take a domestic summer trip 2023, by country
Outbound tourism
- Premium Statistic Outbound tourism visitor growth worldwide 2020-2025, by region
- Premium Statistic Outbound visitor growth in Europe 2020-2025, by region
- Premium Statistic Number of outbound trips from EU-27 countries and the UK 2018-2021
- Premium Statistic European countries with the highest outbound tourism expenditure 2019-2022
European travelers
- Premium Statistic Travel intentions of Europeans in the next six months 2024, by destination
- Premium Statistic Share of Europeans planning to travel domestically or in Europe 2023-2024
- Premium Statistic Europeans planning domestic or European trips in the next six months 2024, by age
- Premium Statistic Europeans planning leisure domestic or European trips 2024, by trip type
- Premium Statistic European travelers' favorite destinations for their next European trip 2024
Accommodation
- Basic Statistic Number of tourist accommodation establishments in the EU 2012-2022
- Basic Statistic Number of overnight stays in tourist accommodation establishments in the EU 2011-2022
- Premium Statistic Hotel market revenue in Europe 2017-2028
- Premium Statistic Hotel market revenue in Europe 2017-2028, by region
- Premium Statistic Share of hotel market sales in Europe 2017-2028, by channel
Travel companies
- Basic Statistic Market cap of leading online travel companies worldwide 2023
- Premium Statistic Estimated EV/EBITDA ratio in the online travel market 2024, by segment
- Premium Statistic Market capitalization of leading travel and leisure companies in Europe 2024
- Premium Statistic Leading airlines in Europe based on passenger numbers 2022
- Premium Statistic Travel and tourism revenue in Europe 2018-2028, by segment
- Premium Statistic Number of users of package holidays in Europe 2019-2028
- Premium Statistic Number of users of hotels in Europe 2019-2028
- Premium Statistic Number of users of vacation rentals in Europe 2019-2028
- Premium Statistic Revenue of travel and tourism market in selected countries worldwide 2023
Further related statistics
- Premium Statistic Number of international tourist arrivals by land Myanmar 2010-2019
- Premium Statistic Italy: number of inbound tourist arrivals in Apulia 2009-2015
- Premium Statistic Number of international tourist arrivals in Myanmar 2010-2019
- Premium Statistic Number of international tourist arrivals by air Myanmar 2010-2019
- Basic Statistic Foreign tourist arrivals Thailand 2015-2023
- Premium Statistic Number of international tourist arrivals by sea Myanmar 2010-2019
- Premium Statistic Italy: number of tourist arrivals in hotels in Lecce by origin 2009-2015
- Premium Statistic Italy: number of international tourist arrivals 2015, by region
- Premium Statistic Italy: number of international tourist arrivals 2015, by country of origin
- Premium Statistic Italy: number of international tourist arrivals 2015, by continent of origin
- Premium Statistic Italy: tourist arrivals in Lecce 2009-2015
- Premium Statistic Italy: share of international tourist arrivals 2015, by continent of origin
- Premium Statistic Number of international visitor arrivals from the Philippines to Indonesia 2014-2023
- Premium Statistic Number of international visitor arrivals from Australia to Indonesia 2014-2023
- Premium Statistic Number of international visitor arrivals from Singapore to Indonesia 2014-2023
- Basic Statistic Arrivals of non-Australian citizens from overseas destinations to Australia 2018-2021
- Basic Statistic TRAVELSAT satisfaction index concerning reception in regions in France 2015
Further Content: You might find this interesting as well
- Number of international tourist arrivals by land Myanmar 2010-2019
- Italy: number of inbound tourist arrivals in Apulia 2009-2015
- Number of international tourist arrivals in Myanmar 2010-2019
- Number of international tourist arrivals by air Myanmar 2010-2019
- Foreign tourist arrivals Thailand 2015-2023
- Number of international tourist arrivals by sea Myanmar 2010-2019
- Italy: number of tourist arrivals in hotels in Lecce by origin 2009-2015
- Italy: number of international tourist arrivals 2015, by region
- Italy: number of international tourist arrivals 2015, by country of origin
- Italy: number of international tourist arrivals 2015, by continent of origin
- Italy: tourist arrivals in Lecce 2009-2015
- Italy: share of international tourist arrivals 2015, by continent of origin
- Number of international visitor arrivals from the Philippines to Indonesia 2014-2023
- Number of international visitor arrivals from Australia to Indonesia 2014-2023
- Number of international visitor arrivals from Singapore to Indonesia 2014-2023
- Arrivals of non-Australian citizens from overseas destinations to Australia 2018-2021
- TRAVELSAT satisfaction index concerning reception in regions in France 2015
- Publications
- Key Findings
- Interactive data and economy profiles
- Full report
Travel & Tourism Development Index 2024

3. Global context
With 2024 in full swing, the global t&t sector is on track to move past the covid-19 pandemic lows and even exceed the pre-pandemic highs..
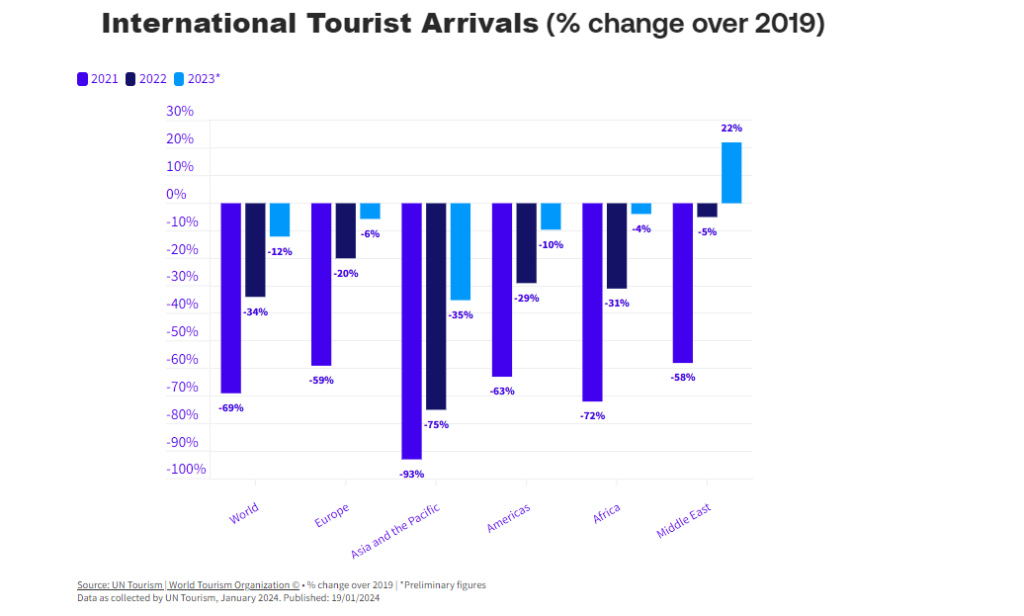
Driven by the lifting of pandemic-related travel and other restrictions and strong pent-up demand, international tourist arrivals are expected to reach pre-pandemic levels in 2024, reaching 88% of the 2019 level in 2023, 1 while at $9.9 trillion, T&T’s contribution to global GDP is nearly at pre-pandemic levels. The Middle East had the highest recovery rates in international tourist arrivals (20% above the 2019 level), 2 while Europe, a resilient destination with strong intraregional travel flows, Africa and the Americas all showed a strong recovery of around 90% in 2023. In 2024, global tourism growth is expected to be reinforced by the continued satisfaction of pent-up demand and growth in major Asian markets after travel restrictions have been lifted following a delay compared to other regions. 3
If T&T can be developed in an inclusive, sustainable and resilient manner, it can become a powerful tool to address many worldwide challenges.
However, the uneven nature of the aforementioned recovery, labour shortages, and supply and demand imbalances leading to travel price increases and service disruptions have put pressure on destinations and businesses in the T&T sector. Moreover, while travel demand has proved resilient, the macroeconomic and geopolitical landscape, defined by economic uncertainty, high inflation and energy prices, increased interest rates and conflicts from Ukraine to the Middle East, has nevertheless exacerbated the sector’s difficult operating conditions and may yet dampen sector growth. 4 Combined with the impact of climate events such as global heatwaves and wildfires in countries like Greece 5 and the return of overcrowding at destinations such as Venice, 6 the sector’s exposure to and influence on economic, social and environmental issues has become even more apparent.
Against this dynamic backdrop, it has become imperative for T&T government and business decision-makers and other stakeholders to ensure that the sector not only addresses near-term issues such as supply and demand imbalances but also ensures sector readiness for the growing economic, environmental, societal, geopolitical and technological challenges and opportunities in the future. If T&T can be developed in an inclusive, sustainable and resilient manner, it can become a powerful tool to address many worldwide challenges, contributing to the collective well-being of the global community. To help guide this goal, this year’s Travel & Tourism Development Index special focus section will outline the external future risks and opportunities the sector will likely face in the coming years, and what can be done to help the sector deal with these trends while simultaneously making it a source of global resilience and prosperity.

Interactive visualization requires JavaScript
Related research and data
- Promote sustained, inclusive and sustainable economic growth, full and productive employment and decent work for all
- Air passengers
- Air passengers per fatality
- Average length of stay of international visitors
- Employment in food and beverage serving activities per 1,000 people
- Employment in tourism-related industries per 1,000 people
- Fatal airliner accidents and hijacking incidents
- Fatal airliner accidents per million commercial flights
- Fatalities from airliner accidents and hijackings
- Foreign guests in hotels and similar establishments
- Global aviation fatalities per million passengers
- International one-day trips
- International one-day trips per 1,000 people
- International tourist departures
- International tourist departures per 1,000 people
- International tourist departures per 1,000 people vs. GDP per capita
- International tourist expenditure abroad
- International tourist expenditure within the country they visit
- International tourist trips by destination region
- International tourist trips by region of origin
- International tourist trips per 1,000 people
- International trips for business and professional reasons
- International trips for personal reasons
- International trips for personal vs. business and professional reasons
- Local guests in hotels and similar establishments
- Local vs. foreign guests in hotels and similar establishments
- Monitoring of sustainable tourism
- Monthly CO₂ emissions from commercial passenger flights
- Monthly CO₂ emissions from domestic and international commercial passenger flights
- Per capita CO₂ emissions from domestic commercial passenger flights
- Per capita CO₂ emissions from commercial aviation, tourism-adjusted
- Per capita CO₂ emissions from international commercial passenger flights, tourism-adjusted Clarke & UNWTO
- Per capita CO₂ emissions from international passenger flights, tourism-adjusted Graver & World Bank
- Ratio of business trips to trips for personal reasons
- Ratio of inbound to outbound tourist trips
- Ratio of same-day trips to tourist trips
- Share of global services exports
- Share of tourism in total GDP
- Trips by domestic tourists per 1,000 people
Our World in Data is free and accessible for everyone.
Help us do this work by making a donation.
UN Tourism | Bringing the world closer
Share this content.
- Share this article on facebook
- Share this article on twitter
- Share this article on linkedin
International tourism reached 97% of pre-pandemic levels in the first quarter of 2024
- All Regions
- 21 May 2024
International tourist arrivals reached 97% of pre-pandemic levels in the first quarter of 2024. According to UN Tourism, more than 285 million tourists travelled internationally in January-March, about 20% more than the first quarter of 2023, underscoring the sector’s near-complete recovery from the impacts of the pandemic.
In 2023 international tourist arrivals recovered 89% of 2019 levels and export revenues from tourism 96%, while direct tourism GDP reached the same levels as in 2019.
UN Tourism’s projection for 2024 points to a full recovery of international tourism with arrivals growing 2% above 2019 levels. In line with this, the newest data released by the UN specialized agency for tourism show that:
Yet it also recalls the need to ensure adequate tourism policies and destination management, aiming to advance sustainability and inclusion, while addressing the externalities and impact of the sector on resources and communities
- The Middle East saw the strongest relative growth, with international arrivals exceeding by 36% pre-pandemic levels in Q1 2024, or 4% above Q1 2023. This follows an extraordinary performance in 2023, when the Middle East became the first world region to recover pre-pandemic numbers (+22%).
- Europe , the world's largest destination region, exceeded pre-pandemic levels in a quarter for the first time (+1% from Q1 2019). The region recorded 120 million international tourists in the first three months of the year, backed by robust intra-regional demand.
- Africa welcomed 5% more arrivals in the first quarter of 2024 than in Q1 2019, and 13% more than in Q1 2023.
- The Americas practically recovered pre-pandemic numbers this first quarter, with arrivals reaching 99% of 2019 levels.
- International tourism is experiencing a rapid recovery in Asia and the Pacific where arrivals reached 82% of pre-pandemic levels in Q1 2024, after recovering 65% in the year 2023.
UN Tourism Secretary-General Zurab Pololikashvili said: "The recovery of the sector is very welcome news for our economies and the livelihoods of millions. Yet it also recalls the need to ensure adequate tourism policies and destination management, aiming to advance sustainability and inclusion, while addressing the externalities and impact of the sector on resources and communities".
By subregions, North Africa saw the strongest performance in Q1 2024 with 23% more international arrivals than before the pandemic, followed by Central America (+15%), the Caribbean and Western Europe (both +7%). Southern Mediterranean Europe exceeded pre-pandemic levels by 1%, while South America virtually reached 2019 levels. Northern Europe recovered 98% of pre-pandemic levels, while Subsaharan Africa and North America both recovered 95%.
According to available data, many destinations across the world continued to achieve strong results in Q1 2024, including Qatar (+177% versus Q1 2019), Albania (+121%), Saudi Arabia (+98%), El Salvador (+90%), Tanzania (+53%), Curaçao (+45%), Serbia (+43%), Turks and Caicos (+42%), Guatemala (+41%) and Bulgaria (+38%).
The robust performance of international tourism can also be seen in the UN Tourism Confidence Index which reached 130 points (on a scale of 0 to 200) for the period January-April, above the expectations (122) expressed for this period in mid-January.
International tourism receipts reached USD 1.5 trillion in 2023, meaning a complete recovery of pre-pandemic levels in nominal terms, but 97% in real terms, adjusting for inflation.
By regions, Europe generated the highest receipts in 2023, with destinations earning USD 660 billion, exceeding pre-pandemic levels by 7% in real terms. Receipts in the Middle East climbed 33% above 2019 levels. The Americas recovered 96% of its pre-pandemic earnings in 2023 and Africa 95%. Asia and the Pacific earned 78% of its pre-crisis receipts, a remarkable result when compared to its 65% recovery in arrivals last year.
Total export revenues from international tourism, including both receipts and passenger transport, reached USD 1.7 trillion in 2023, about 96% of pre-pandemic levels in real terms. Tourism direct GDP recovered pre-pandemic levels, reaching an estimated USD 3.3 trillion in 2023, equivalent to 3% of global GDP.
Several destinations achieved remarkable results in terms of receipts in the first quarter of 2024 as compared to 2019 levels based on available data, including Serbia (+127%), Türkiye (+82%), Pakistan (+72%), Tanzania (+62%), Portugal (+61%), Romania (+57%), Japan (+53%), Mongolia (+50%), Mauritius (+46%) and Morocco (+44%).
Looking ahead to a full recovery globally in 2024
International tourism is expected to recover completely in 2024 backed by strong demand, enhanced air connectivity and the continued recovery of China and other major Asian markets.
The latest UN Tourism Confidence Index shows positive prospects for the upcoming summer season, with a score of 130 for the period May-August 2024 (on a scale of 0 to 200), reflecting more upbeat sentiment than earlier this year. Some 62% of tourism experts participating in the Confidence survey expressed better (53%) or much better (9%) expectations for this 4-month period, covering the Northern Hemisphere summer season, while 31% foresee similar performance as in 2023.
Challenges remain
According to the UN Tourism Panel of Experts, economic and geopolitical headwinds continue to pose significant challenges to international tourism and confidence levels.
IMF's latest World Economic Outlook (April 2024) points to a steady but slow economic recovery, though mixed by region. At the same time, persisting inflation, high interest rates, volatile oil prices and disruptions to trade continue to translate into high transport and accommodations costs.
Tourists are expected to continue to seek value for money and travel closer to home in response to elevated prices and the overall economic challenges, while extreme temperatures and other weather events could impact the destination choice of many travellers. This is increasingly mentioned by the UN Tourism Panel of Experts as a concern for the sector.
Uncertainty derived from the Russian aggression against Ukraine, the Hamas-Israel conflict and other mounting geopolitical tensions, are also important downside risks for international tourism.
As international tourism continues to recover and expand, fuelling economic growth and employment around the world, governments will need to continue adapting and enhancing their management of tourism at the national and local level to ensure communities and residents are at the center of this development.
Related links
- Download News Release on PDF
- Excerpt | World Tourism Barometer - Volume 22 • Issue 2 • May 2024
Category tags
Related content, international tourism to reach pre-pandemic levels in 2024, international tourism to end 2023 close to 90% of pre-p..., tourism’s importance for growth highlighted in world ec..., international tourism swiftly overcoming pandemic downturn.
COMMENTS
Number of international tourist arrivals worldwide from 2005 to 2023, by region (in millions) [Graph], World Tourism Organization (UN Tourism), May 2, 2024. [Online].
Ratio of business trips to trips for personal reasons. Ratio of inbound to outbound tourist trips. Ratio of same-day trips to tourist trips. Share of global services exports. Share of tourism in total GDP. Trips by domestic tourists per 1,000 people. Our World in Data is free and accessible for everyone.
International Tourism and COVID-19. Export revenues from international tourism dropped 62% in 2020 and 59% in 2021, versus 2019 (real terms) and then rebounded in 2022, remaining 34% below pre-pandemic levels. The total loss in export revenues from tourism amounts to USD 2.6 trillion for that three-year period. Go to Dashboard.
In terms of tourist numbers, the year 2022 is expected to close with over 900 million international arrivals, despite growing challenges pointing to a softening of the recovery pace. International tourist arrivals: 2020, 2021 and Scenarios for 2022 (monthly change over 2019,%) Source UNWTO World Tourism Barometer: November 2022 Press Release.
Tourist numbers down 83% in Q1 2021 but confidence slowly rising. International tourist arrivals (overnight visitors) dropped by 83% in the period January-March 2021 compared to 2020, as travel restrictions remained high and consumer confidence low due to the coronavirus pandemic. This follows an unprecedented drop of 73% in 2020, the worst year on record for international tourism. By regions ...
Tourism Statistics. Get the latest and most up-to-date tourism statistics for all the countries and regions around the world. Data on inbound, domestic and outbound tourism is available, as well as on tourism industries, employment and complementary indicators. All statistical tables available are displayed and can be accessed individually ...
International tourism, number of arrivals World Tourism Organization, Yearbook of Tourism Statistics, Compendium of Tourism Statistics and data files. License : CC BY-4.0
The second UNWTO World Tourism Barometer of the year shows that the sector's swift recovery has continued into 2023. It shows that: Overall, international arrivals reached 80% of pre-pandemic levels in the first quarter of 2023. An estimated 235 million tourists travelled internationally in the first three months, more than double the same ...
International tourism up 4% in 2021 but still 72% below pre-pandemic levels Global tourism experienced a mild 4% upturn in 2021, with 15 million more international tourist arrivals (overnight visitors) than in 2020 but remained 72% below the levels of pre-pandemic year 2019 according to preliminary estimates. This follows a 73% plunge in international travel in 2020, the worst year on record ...
Tourism has massively increased in recent decades. Aviation has opened up travel from domestic to international. Before the COVID-19 pandemic, the number of international visits had more than doubled since 2000. Tourism can be important for both the travelers and the people in the countries they visit. For visitors, traveling can increase their ...
The UNWTO Tourism Data Dashboard - provides statistics and insights on key indicators for inbound and outbound tourism at the global, regional and national levels. Data covers tourist arrivals, tourism receipts, tourism share of exports and contribution to GDP, source markets, seasonality, domestic tourism and data on accommodation and employment.
An estimated 700 million tourists travelled internationally between January and July 2023, about 43% more than in the same months of 2022, though 16% fewer than in 2019. By regions, the Middle East saw the best results in January-July 2023, with arrivals exceeding by 20% pre-pandemic levels. Europe, the world's largest destination region ...
Based on UNWTO's scenarios for 2023, international tourist arrivals could reach 80% to 95% of pre-pandemic levels this year, with Europe and the Middle East expected to reach those levels. However, important risks remain ahead, especially economic and geopolitical. According to the latest survey of the Panel of Experts, the challenging ...
According to the first UNWTO World Tourism Barometer of the year, international tourism ended 2023 at 88% of pre-pandemic levels, with an estimated 1.3 billion international arrivals.The unleashing of remaining pent-up demand, increased air connectivity, and a stronger recovery of Asian markets and destinations, are expected to underpin a full recovery by the end of 2024 (UNWTO Tourism ...
Foreign guests in hotels and similar establishments. Global aviation fatalities per million passengers. International one-day trips. International one-day trips per 1,000 people. International tourist departures. International tourist departures per 1,000 people. International tourist departures per 1,000 people vs. GDP per capita.
International travel largely on hold despite uptick in May 2021 International tourist arrivals (overnight visitors) dropped by 85% in January-May 2021 compared to the same period of pre-pandemic year 2019, or 65% over 2020, as travel restrictions remained high due to the coronavirus pandemic. This follows an unprecedented drop of 73% in 2020, the worst year on record for international tourism ...
World Bank Data
international tourist arrivals are expected to reach pre-pandemic levels in 2024, reaching 88% of the 2019 level in 2023,1 while at $9.9 trillion, T&T's contribution to global GDP is nearly at pre-pandemic levels. The Middle East had the highest recovery rates in international tourist arrivals (20% above the 2019
Europe was the world region with the highest international tourist arrivals in 2023. The Asia-Pacific region and the Americas followed behind. ... by region; International tourist arrivals worldwide 2019-2022, by subregion ... by region (in millions) [Graph], World Tourism Organization (UN Tourism), May 2, 2024. [Online]. Available: https ...
As such, international tourism can generate a tourism trade surplus when receipts exceed expenditure, or a deficit (vice versa) in the travel balance of countries. In 2019, the United States of America had the world's largest travel surplus with USD 62 billion, resulting from tourism receipts of USD 214 billion and expenditure of USD 152 billion.
Travel & Tourism Development Index 2024. 3. Global context. With 2024 in full swing, the global T&T sector is on track to move past the COVID-19 pandemic lows and even exceed the pre-pandemic highs. Driven by the lifting of pandemic-related travel and other restrictions and strong pent-up demand, international tourist arrivals are expected to ...
Fatalities from airliner accidents and hijackings. Foreign guests in hotels and similar establishments. Global aviation fatalities per million passengers. International one-day trips. International one-day trips per 1,000 people. International tourist departures. International tourist departures per 1,000 people.
4 International Tourism ighlights - 2023 Edition (Revised and updated, October 2023) In the decades leading up to 2019, tourism saw continued expansion and diversification despite occasional shocks, to become one of the largest and fastest-growing economic sectors in the world. Rapid growth in international tourist arrivals
In 2023 international tourist arrivals recovered 89% of 2019 levels and export revenues from tourism 96%, while direct tourism GDP reached the same levels as in 2019. ... Europe, the world's largest destination region, exceeded pre-pandemic levels in a quarter for the first time (+1% from Q1 2019). The region recorded 120 million international ...