Debug a Website in iOS Safari on Windows 10
- Post author By John Washam
- Post date May 6, 2018
- 4 Comments on Debug a Website in iOS Safari on Windows 10

Have you ever needed to debug a website (especially JavaScript or CSS) in Safari on an iOS device but didn’t have a Mac handy? I ran into this problem, and after hours of trying other ways to debug, I finally discovered a pretty easy way to load up a debug interface on my Windows 10 PC that displayed debug info about a website in Safari on an iPad Mini.
[update 10/20/2019 – I’ve heard reports that this solution only works in iOS 12 and below, not iOS 13 and up. I can neither confirm or deny.]
[update 5/6/2018 – I previously included a solution that used WebIDE in the Mozilla Firefox browser, along with the Valence plugin. At some point, possibly beginning with iOS 9, that solution stopped working. I recently had a chance to try some other solutions and found an even easier solution that works with Google Chrome DevTools!]
Thankfully, this solution uses the Google Chrome browser on your PC and the built-in Chrome DevTools that you should already be used to, but the content is coming from the website in Safari on the iOS device.
According to what I’ve read online, it appears this solution only works with Windows 8 and up, so this may not work on Windows 7.
Let’s get to it!
I recorded a tutorial video of this solution, step-by-step, to go along with this post:

- Install Node.js . When you install, make sure the package manager is selected (it is by default), as we’ll be needing that to install the webkit adapter.
- Run Windows PowerShell as administrator. Press the Windows Key + S to search, then search for “PowerShell”. Right-click on Windows PowerShell and click Run as administrator .
When that is complete, you will see an “updated 1 package in Xs” message:

- Connect your iOS device to your Windows 10 PC via USB. If you haven’t connected the devices previously, you will need to click to trust the connection on both devices.

Once it begins running, you will see the message remotedebug-ios-webkit-adapter is listening on port 9000 followed by iosAdapter.getTargets :

Then, make sure the target “localhost:9000” is in the list:

- Enable web inspector on your iOS device. On your iOS device, go to Settings > Safari > Advanced and enable Web Inspector .

- Click inspect under the target. Success! You can now debug the site in Safari on your iOS device, but from Chrome DevTools on your Windows machine.
It should take you around 5 minutes to set this up, and you can be debugging a website in no time!

Using iOS 11?
You may need some extra steps to get this working on an iOS 11 device. Evidently, the version of the remotedebug-ios-webkit-adapter downloaded via npm is broken for iOS 11. The user bdice wrote a post on the remotedebug-ios-webkit-adapter Github Issues page describing how he was able to get this working on Windows 10 with an iOS 11 device. I tested it out, and here’s the lowdown:
- Download the most recent ZIP release file of remotedebug-ios-webkit-adapter. I downloaded version 1.8.
- Create a new folder named “ios-webkit-debug-proxy-1.8-win64-bin” in the following path (assumes you installed Node.js in the default directory): %AppData%\npm\node_modules\remotedebug-ios-webkit-adapter\node_modules\vs-libimobile\
%AppData%\npm\node_modules\remotedebug-ios-webkit-adapter\node_modules\vs-libimobile\ios-webkit-debug-proxy-1.8-win64-bin
%AppData%\npm\node_modules\remotedebug-ios-webkit-adapter\out\adapters\iosAdapter.js
On line 132, change the proxy variable to the following value:
const proxy = path.resolve(__dirname, '../../node_modules/vs-libimobile/ios-webkit-debug-proxy-1.8-win64-bin/ios_webkit_debug_proxy.exe');
After you have jumped through all these hoops, I would restart Windows PowerShell (as Administrator!), restart Chrome, and unplug then plug back in your iOS device, just to be safe. After doing so, go back to step 6 above, and when you get to step 9, you should now see your device under the list of Remote Targets!
I tested this out, and it definitely worked!
Have you tried debugging a website in Safari on iOS with a Windows machine before? How did it work out for you, and what tool(s) did you use? Or did you have a problem with this solution you’d like to discuss? I’d love to hear from you, so let’s discuss in the comments below!
Share this:
- Tags chrome devtools , debug , ios , javascript , remote-ios-webkit-adapter , safari
Web Inspector Reference Enabling Web Inspector
Ios simulator.
To enable Web Inspector in Safari (or Safari Technology Preview ):
- click the Safari (or Safari Technology Preview ) menu bar item
- select Preferences… (or press ⌘ , )
- go to the Advanced pane
- check the Show Develop menu in menu bar checkbox
Show Web Inspector (or pressing ⌥ ⌘ I ) in the Develop menu or by right-clicking on any page in Safari (or Safari Technology Preview ) and selecting Inspect Element .
Once Web Inspector is enabled, the name of the current the macOS machine will appear as a submenu in the Develop menu of Safari (or Safari Technology Preview ), allowing for inspection of:
To enable remote inspection on an iOS device:
- open the Settings app
- go to Safari
- scroll down to Advanced
- enable the Web Inspector toggle
Once Web Inspector is enabled, connecting the iOS device to any macOS machine, either via a physical cable or after configuring wireless debugging in Xcode , the name of the iOS device will appear as a submenu in the Develop menu of Safari (and Safari Technology Preview ) on the connected macOS machine, allowing for remote inspection of:
- any page in Safari
- websites added to the home screen
- SFSafariViewController
NOTE : in order to use remote inspection, Web Inspector must be enabled on the connected macOS machine.
Remote inspection is always enabled for iOS simulators, meaning they will also appear in the Develop menu of Safari (and Safari Technology Preview ) just like connected iOS devices.
Automatic Inspection
At the bottom of any macOS machine or iOS device submenu in the Develop menu of Safari (or Safari Technology Preview ), there are two toggles:
- Automatically Show Web Inspector for JSContexts controls whether Web Inspector is automatically opened whenever a JSContext is created by any inspectable application on the corresponding macOS machine or iOS device.
- Automatically Pause Connecting to JSContexts controls whether Web Inspector automatically pauses JavaScript execution when inspecting any JSContext on the corresponding macOS machine or iOS device.

Written June 8, 2020 by Brian Burg , Devin Rousso , Joseph Pecoraro , and Timothy Hatcher
Last updated September 8, 2020 by Devin Rousso
- Editor's Choice: Tech Gifts for Mom
- Amazon Prime Tech Deals!
How to Activate the iPhone Debug Console or Web Inspector
Use Safari's web developer tools to study problematic websites
:max_bytes(150000):strip_icc():format(webp)/ScottOrgera-f7aca23cc84a4ea9a3f9e2ebd93bd690.jpg "how to use safari web inspector on windows")
- Saint Mary-of-the-Woods College
- Switching from Android
What to Know
- Activate Web Inspector on iOS: Go to Settings > Safari > Advanced and move the Web Inspector toggle switch to the On position.
- Use Web Inspector on macOS: Connect your iOS device to a Mac and choose the URL to inspect from the Develop menu.
If you run into a bug or another issue with a website on Safari mobile, use the Web Inspector tool to investigate. This article explains how to use the Safari console for iPhone to debug errors with the help of your Mac computer. Instructions apply to iPhones with iOS 14, iOS 12, or iOS 11, and well as Macs with macOS Big Sur (11.0), macOS Catalina (10.15), or macOS Mojave (10.14).
Activate Web Inspector on Your iPhone or Other iOS Device
The Web Inspector is disabled by default since most iPhone users have no use for it. However, if you're a developer or you're curious, you can activate it in a few short steps. Here's how:
Open the iPhone Settings menu.
On an iPhone with an early version of iOS, access the Debug Console through Settings > Safari > Developer > Debug Console . When Safari on the iPhone detects CSS, HTML, and JavaScript errors, details of each display in the debugger.
Scroll down and tap Safari to open the screen that contains everything related to the Safari web browser on your iPhone, iPad, or iPod touch.
Scroll to the bottom of the page and select Advanced .
Move the Web Inspector toggle switch to the On position.
Connect Your iOS Device to Safari on a Mac
To use the Web Inspector, connect your iPhone or another iOS device to a Mac that has the Safari web browser and enable the Develop menu .
With Safari open, select Safari from the menu bar and choose Preferences .
Select the Advanced tab.
Select the Show Develop menu in menu bar check box and close the settings window.
From the Safari menu bar, select Develop and choose the name of your attached iOS device, then select the URL that appears under Safari to open the debug console for that site.
After you connect your device, use your Mac to inspect the website you want to debug and have it open in the Safari mobile browser.
What Is Web Inspector?
Web developers use Web Inspector to modify, debug, and optimize websites on Macs and iOS devices. With Web Inspector open, developers can inspect the resources on a web page. The Web Inspector window contains editable HTML and notes regarding the styles and layers of the web page in a separate panel.
Before iOS 6, the iPhone Safari web browser had a built-in Debug Console that developers used to find web page defects. Recent versions of iOS use Web Inspector instead.
With Safari 9 and OS X Mavericks (10.9), Apple introduced Responsive Design Mode in Web Inspector. Developers use this built-in simulator to preview how web pages scale to different screen sizes, resolutions, and orientations.
To set up Web Inspector on your iPad, open your iPad's Settings and select Safari > Advanced , then turn Web Inspector On . Connect the iPad to a Mac computer, then open Safari on the Mac and select Safari > Preferences > Advanced , then turn on Show Develop menu in menu bar .
You cannot just connect your iPhone to a Windows PC and start using Web Inspector through Chrome like you can with a Mac. Installing package manager software can provide you a sort of workaround, but it's not recommended unless you're familiar with the package management app you intend to use.
Get the Latest Tech News Delivered Every Day
- Add More Features by Turning on Safari's Develop Menu
- 4 Ways to Play Fortnite on iPhone
- How to Activate and Use Responsive Design Mode in Safari
- How to Change the Default Search Engine in Chrome for iOS
- What Is Safari?
- How to Inspect an Element on a Mac
- How to Use Web Browser Developer Tools
- How to Clear Search History on iPhone
- How to Disable JavaScript in Safari for iPhone
- How to Reset Safari to Default Settings
- How to View HTML Source in Safari
- How to Manage History and Browsing Data on iPhone
- 10 Hidden Features in macOS Sonoma
- How to Manage Cookies in the Safari Browser
- How to Change Your Homepage in Safari
- How to Clear Private Data, Caches, and Cookies on Mac
Remotely debugging iOS Safari on Windows and Linux
Published by himbeer on 3rd june 2021 3rd june 2021.
Note: This blog post is a mirror of the README of my GitHub repository .
Using this project you can debug your websites and web applications running in iOS Safari from a PC running Windows or Linux.
It provides a free and up-to-date alternative to the discontinued remotedebug-ios-webkit-adapter by RemoteDebug and is the spiritual successor to the abandoned webkit-webinspector by Arty Gus .
The setup scripts ( generate.sh or generate.ps1 ) download the latest version of WebKit’s built-in WebInspector and patch it to work with the WebSocket ios-webkit-debug-proxy provides and to be compatible with Chromium based browsers.
Requirements for running
- On Windows, it will automatically be downloaded, but you must also install iTunes for it to work
- For Linux, please follow the installation instructions .
- If you have Python or PHP on your system, you don’t need to change anything
- If you have Node.JS on your system, just run npm i -g http-server and you’re set.
- like Google Chrome, Edge or Opera
- like Epiphany/GNOME Web
Requirements for setup
- On Windows, I suggest using git for Windows in PowerShell
- On Linux, I suggest installing svn from your package manager
Instructions
- Clone this repository, https://github.com/HimbeersaftLP/ios-safari-remote-debug-kit to your PC
- On Windows, run generate.ps1 . On Linux, run generate.sh .
This will result in the folder WebKit being created inside src . It contains the WebInspector files.
- Plug your iOS device into your PC via USB
- On the iOS device, go to Settings->Safari->Advanced->Web Inspector and enable it
- Open the website you want to debug in Safari
- On Windows, run start.ps1 . On Linux, run start.sh .
- Then open the Chromium or WebKit based browser of your choice with the following URL: http://localhost:8080/Main.html?ws=localhost:9222/devtools/page/1
- You should be greeted with the WebInspector and can now debug to your heart’s content.
- Two windows will open. One manages the web server and the other one is ios-webkit-debug-proxy .
- Alternatively you can also press Ctrl+C in the web server window
- Press Ctrl+C in the terminal window to exit
Known Issues
- "Events" on the "Timelines" tab don’t work
- Canvas content doesn’t show on the "Graphics" tab
- Minor style glitches due to Webkit vs. Chromium differences
If you want to see details about how this was made, you can read a detailed explanation in in my other post here .
Attribution
- webkit-webinspector for the idea
- ios-webkit-debug-proxy for the ios-webkit-debug-proxy tool
- WebKit for the WebInspector itself
Share this post:
- Click to share on Telegram (Opens in new window)
- Click to share on WhatsApp (Opens in new window)
- Click to share on Twitter (Opens in new window)
13 Comments

Nicholas Fenwick · 26th June 2023 at 09:44
Hi! When trying to debug an old iPhone running iOS (and therefore Safari) 12, do we need to issue commands to change the webkit protocol to 12? I can list available pages with http://localhost:9222/ but when I try to run http://localhost:8000/Main.html?ws=localhost:9222/devtools/page/1 the Web Inspector throws an error “‘Browser’ domain was not found (at :undefined:undefined)”. This message is mentioned at https://github.com/HimbeersaftLP/ios-safari-remote-debug-kit but I am not “trying to inspect a page that is not inspectable” since this same page on a newer iPhone 16 and same URL works fine.

Himbeer · 26th June 2023 at 10:51
Hello, You can select the iOS version when running generate.sh/generate.ps1 using “-i ” or “-iOSVersion ” respectively. (You also need to run with “-f” or “-Force” if you already ran the script before to clean up the old data) Using an incompatible iOS version usually results in an “Unknown Instrument” error ( https://github.com/HimbeersaftLP/ios-safari-remote-debug-kit/issues/12 ). Does the list at http://localhost:9222/ only show this one page? The message “Error: ‘Browser’ domain was not found” usually indicates a successfull WebSocket connection but the selected page/Safari not cooperating with the debugger.

Alex Malz · 9th February 2023 at 15:06
Thank you very much for your great project! Works very well for me and is so easy to install and use!! I previously wasted hours with compiling the old webkit stuff without any benefit…
However, do you have any idea how to get it working with vs code? As vs code is capable of the chrome remote debug protocol it should work somehow. I just don’t get the correct settings for the launch.json configuration.
Thanks! Alex.
Himbeer · 9th February 2023 at 15:13
Hi Alex! You are right that VS Code is capable of the Chrome Remote Debug protocol. However, WebKit uses their own protocol, that’s why my tool bundles the WebKit inspector. There used to be a tool that could translate between the protocols ( remotedebug-ios-webkit-adaptor ) and also a VS Code extension with the same purpose ( vscode-ios-web-debug ), however those are sadly both deprecated (which is the reason I made this project, as running the WebKit inspector is far less maintenance effort than keeping up to date with the inspector protocol).
Alex · 9th February 2023 at 16:31
Thanks for your reply and – again – your great work!
Himbeer · 9th February 2023 at 16:33
You’re welcome!

EVC · 26th July 2022 at 15:09
“This site can’t be reached
localhost refused to connect.
ERR_CONNECTION_REFUSED”
Himbeer · 10th August 2022 at 23:14
Edit the powershell script to use another web server

Rodrigo · 16th February 2022 at 13:13
Thanks for the repo and the blog. I have managed to install most of it but the web server is not loading in Chrome. I get localhost refused to connect.
I tried going directly to http://localhost:9222/ and there it shows my ipad and the web I want to debug that is open but when going to http://localhost:9222/devtools/page/1 it says:
404. That’s an error.
The requested URL /devtools/page/1 was not found. Frontend is disabled
It is using Python3 to serve the WebInspector
Himbeer · 19th February 2022 at 10:57
Hello! Using the python (or other) webserver instead of the page served by the ios-webkit-debug-proxy is necessary as the latter is very outdated. It looks like there might be something else already using port 8080 on your machine that causes the webserver of my script not to load. Try changing the port number in the script.

Joe · 21st June 2021 at 20:50
Hi, I just wanted to write and say THANK YOU VERY MUCH for making these scripts available, and also for taking the time to document everything. I had been pulling my hair out trying to just simply get proper error messages from iOS Safari console. Apple is totally unreasonable with their restricted access to the crippled web browser on iOS, and they furthermore prevent you from really having any other alternatives either because every browser is on iOS is still running the webKit engine as a rule. People like you, however, are making a difference, and I just wanted to say thanks for the effort. If there is a place to make a donation to you, I’d be willing to do so because you have saved me hundreds of dollars by circumventing the necessity to buy an actual Mac just to test my software against their awfully crippled browser, Safari. Your efforts are much appreciated. Thanks, Joe.
Himbeer · 8th July 2021 at 12:03
Thank you for your cheerful comment! I am very glad my project turned out useful for you. I appreciate your offer, but I think there are places that need a donation more than me ^^. btw I love the animations on your website 😀
Joe Harris · 8th July 2021 at 18:31
Thank you once again! 🙂
Leave a Reply Cancel reply
Related posts.

How I brought back iOS Safari remote debugging to Windows and Linux
Here’s how I managed to get a local copy of the WebKit WebInspector working with Google’s ios-webkit-debug-proxy on iOS 14.6 in 2021.

Fixing DaVinci Resolve high-DPI scaling on Windows
After opening Resolve for the first time since I have upgraded to an UHD-monitor I noticed that something was off: Everything is way to small even though I had set my display scaling in Windows Read more…

Decoding my satellite-receiver’s channel list file
TL;DR? Click here to jump directly to the decoding website: Preamble So I have this Triax-Hirschmann S-930 DVB-S2 satellite television receiver. It has a feature that allows exporting the channel list to a USB-Drive which Read more…
How to Use Inspect Element in Chrome, Safari, & Firefox
Published: June 20, 2023
In a way, the job of web developers and designers is to convince users that a website is one singular entity, more than just a series of HTML elements formatted to look nice. With the right tools, however, even non-developers can peel back the curtain on any website to see what’s really happening behind the scenes.

You might be familiar with the classic “view page source” trick, which displays the raw HTML of a page in the browser window. But, there’s a better way to do your detective work: The inspect element feature lets us view and even modify any website’s front-end, which can be quite useful when building a website or learning how websites work .
In this post, we’ll discuss what it means to “inspect” page elements, and how to do so on three common web browsers. If you’re in a pinch, jump ahead to what you’re looking for.
- How to Inspect Elements in Chrome
- How to Inspect Elements in Safari
- How to Inspect Elements in Firefox
What does ‘inspect element’ mean?
Inspect element is a feature of modern web browsers that enables anyone to view and edit a website’s source code, including its HTML, CSS, JavaScript, and media files. When the source code is modified with the inspect tool, the changes are shown live inside the browser window.
Inspect is a web professional’s scout team. Developers, designers, and marketers frequently use it to peek inside any website (including their own) to preview content and style changes, fix bugs, or learn how a particular website is built. For instance, if you find an intriguing interface on a competing website, inspect element lets you see the HTML and CSS that make it up.
You can also think of your browser’s inspect feature as a “sandbox” of sorts: Play around with a web page as much as you want by changing content, colors, fonts, layouts, etc. When finished, just refresh the page to revert everything to normal. Inspect doesn’t change the website itself — only how it appears in your browser — so feel free to experiment!

Free Guide: 25 HTML & CSS Coding Hacks
Tangible tips and coding templates from experts to help you code better and faster.
- Coding to Convention
- Being Browser-Friendly
- Minimizing Bugs
- Optimizing Performance
You're all set!
Click this link to access this resource at any time.
Inspect is also an incredibly valuable tool for those learning web development. Instead of viewing plain source code, use inspect element to interact with the page and see how each line of code maps to an element or style. By better understanding what constitutes the typical web page, you can communicate effectively with developers in the case of an error, or if you want to make a change.
Inspect may be a “developer tool,” but you don’t need to write any code or install any additional software to use it. You can do everything I’ve described right inside your browser — let’s learn how.
How to Inspect Elements
To inspect elements you have to right-click any part of a webpage and click Inspect > Inspect Element. Alternatively, you can press Command+Option+i on your Mac or F12 on your PC to do the same.
Every modern web browser has a native tool for inspecting elements. It can be accessed in any browser, but some browsers like Chrome and Safari have slight differences. Let’s discuss how to use the inspect tool in three desktop web browsers: Google Chrome, Apple’s Safari, and Mozilla Firefox.
How To Inspect Elements in Chrome
Chrome comes with a handy developer tool that allows you to inspect individual elements. This allows you to see the code behind a webpage, and even edit it on your own browser. (Note that the changes are only visible to you, not to anyone else across the web.)
Here's how to get started:
1. Launch Chrome and navigate to the page you want to inspect.
To use the element inspector in Google Chrome, first navigate to any web page. In these examples, I’ll be using HubSpot.com .
2. Open up the Inspect panel.
Once you arrive at your desired page, you have several ways to open Chrome's Inspect tool.
- Option 1 : Right-click any part of the page and choose Inspect . Right-clicking a specific page element will open that element in the inspector view.
- Option 2 : In the top menu bar, select View > Developer > Developer Tools .
- Option 3: Click the three-dot icon in the top right corner of the browser window. From there, choose More Tools > Developer Tools . Then, click the Inspect tab in the popup.
- Option 4 : Use the shortcut control-shift-C on Windows or command-option-C on macOS.
3. Change the location of the inspect panel.
To better view the code, you can change the position of the inspector window.
The Chrome Developer Tools panel will open at the bottom of the browser window, but sometimes it opens in a separate window altogether.
If you want to change the location of the panel, click the three-dots icon in the top right corner of the panel (next to the X icon), then choose your preferred dock position.
I’ll choose Dock to right — this makes it easier to view the rendered page and its source:

Along the top of the inspect panel, you’ll see tabs for Elements , Console , Sources , etc. These are all tools we can use to assess a page’s contents and performance. However, everything we need for inspecting is under the Elements tab.
4. Look at the source HTML code of the page.
The biggest area of the panel will contain the source HTML of the current page. Take some time to explore this region, and notice how hovering the cursor over the piece of code highlights the corresponding element on the page.
Blue indicates the contents of an element, green corresponds to padding , and areas in orange are margins .
5. Select a specific element to inspect.
Rather than trying to read through the code to find an element, we can also do the opposite — we can locate a piece of code by hovering over the page element itself. To do this, click the Element select icon in the top left corner of the panel:

Next, click a page element. You’ll see the source code revealed in the inspect panel.
6. Edit the element's text, if desired.
Besides viewing, we can use the inspect tool to alter the page contents. Let’s start by swapping out some text.
First, find some text content in the source code. Then, right-click the element and choose Edit Text — this opens an inline text input in which you can write whatever you want. When you deselect the text input, you’ll see the changes take effect:

Or, what about no text at all? Just select the element in the source code and delete it. The H1 will be gone from the page.

Don’t worry though — it will reappear when you refresh the page.
7. Hide and edit elements on the page.
You can also hide any element without deleting it by right-clicking the element in the source code and choosing Hide element .
You can even add new page elements — right-click on an element in the source code and choose Edit as HTML . You’ll see a text field where you can paste HTML. For example:

8. Edit the page's CSS code.
Moving down the Chrome inspect panel, we see the Styles tab. This shows us what CSS styling has been applied to the selected element. Click on lines of code to rewrite them, or activate/deactivate certain declarations by checking/unchecking the boxes next to them. Let’s do this for our <h1> element’s font-weight property:
9. View the page's mobile version.
Finally, let’s cover one more feature of Chrome’s inspect feature, mobile view. When building a site, designers need to consider how its pages appear on desktop, mobile, and tablet screens alike.
Fortunately, Chrome lets you preview the same web page in multiple screen resolutions. Start by clicking the Toggle device icon in the top left corner of the panel:

From here, set the screen resolution manually or choose a device preset from the menu, then see how the page layout responds. You can also rotate the screen and even preview performance at “mid-tier mobile” and “low-tier mobile” speeds.

How to Inspect Element on Mac
To inspect an element on Mac, open up Safari. Select Safari > Settings > Advanced, then toggle the option that reads Show Develop menu in menu bar. Then, access your desired webpage, right-click, and tap Inspect Element.
Let's look at how to inspect a page on Mac in more detail below, including tips and tricks. We'll be using Safari, but technically you can also inspect a page on macOS by using Chrome or Firefox.
How To Inspect Elements in Safari
Safari includes a tool, just like Google Chrome, that allows you to inspect a web page. Here's how to use it.
1. Enable Safari's developer tools.
To use Safari’s inspect tool, Web Inspector, we first need to enable Safari's developer tools. Here's how:
- On the top menu, select Safari > Preferences .
- Tap Advanced.
- Check the box next to Show Develop menu in menu bar .
- You’ll see a Develop option added to the menu above.
2. Go to your desired web page.
Next, go to the web page you'd like to inspect. For this example, I'll be using HubSpot.com again.
3. Open up Web Inspector.
There are three ways to open Web Inspector in Safari:
- Option 1 : Right-click any part of the page and choose Inspect Element . Right-clicking a specific page element will open that element in the inspector view.
- Option 2: Choose Develop > Show Web Inspector from the top menu bar.
- Option 3: Use the shortcut command-option-I .
Safari’s inspector opens at the bottom of the window by default.
To change this configuration, click the icon to dock the display on the right side or pop out in a separate window.
Both are located next to the X icon in the top left corner of the display.

4. Look at the source HTML and CSS code of the page.
Safari’s inspector panel has two columns. The first shows the source HTML, and the second shows the page CSS.
Use your cursor to explore the source HTML and see which lines of code correspond to each page region. Blue highlights the contents, green highlights the padding, and orange highlights the margins.
We can also inspect the page directly. Click the element selection icon at the top of the panel:

Now, when you click a page element, Web Inspector reveals the corresponding source code.
6. Edit, add, or delete page elements.
Like Chrome’s inspector, Safari lets us modify, add, and remove page elements. To edit the page, right-click an HTML element in the inspect panel, then choose an option from the Edit menu. Web Inspector will prompt you for new text input, then display your changes in real-time:

Or, add a new element to the page by right-clicking a line of code and choosing an option from the Add menu. In this example, I’ve added a new <h1> child element to an existing <div> :

If you want to delete a page element, simply select some code and delete it. Or, right-click and choose Toggle Visibility to hide an element without deleting it.
7. Activate or deactivate the page's CSS code.
To the right we have the Styles column, where we can change or activate/deactivate CSS declarations for any element, like so:
When testing content and style changes, you’ll want to see the effect on mobile screens as well as desktops. We cover that next.
Safari’s Responsive Design Mode allows you to preview a website across common devices.
To view the page in a mobile viewport, choose Develop > Enter Responsive Design Mode . In this mode, you can use the same inspector tools on pages formatted for Apple devices, or set the dimensions yourself:

How To Inspect Elements in Firefox
Firefox is another great option for inspecting a web page in either macOS, Windows, or Linux. Here's how to get started:
1. Open Firefox's inspect element tool.
To open the Firefox Inspector, you have several options:
- Option 1: Right-click any part of the page and choose Inspect Element . Right-clicking a specific page element will open that element in the inspector view.
- Option 2: Select Tools > Web Developer > Inspector from the top menu bar.
- Option 3: Use the shortcut control-shift-C in Windows or command-option-C in macOS.
Next, go to the web page you'd like to inspect. I'll be using HubSpot.com again.
3. Change the location of the inspector panel.
The Firefox inspector appears along the bottom of the window by default. To change its position, select the three-dots icon in the top right corner of the inspector, then choose an alternative display option.

4. Look at the HTML code of the page.
Firefox’s inspector panel is comparable in features to Chrome’s and Safari’s. The HTML source code indicates the corresponding page element with color codes — content is blue, padding is purple, and margins are yellow:
You can also find code by selecting elements on the page. To enter selection mode, click the cursor icon in the top left corner:

Click any page element to reveal its source code in the inspect panel.
6. Modify or delete page elements.
To modify or delete a page element, select its code in the inspector. Then, either double-click to change the text, or right-click and choose Edit as HTML or Create New Node to add code. Or simply delete the code and see the resulting changes on the page.

7. Toggle the page's CSS styles.
To toggle the CSS styling of an element, use the Filter Styles region at the bottom of the inspect panel. Uncheck the box next to a CSS declaration to deactivate it (or write in new code yourself):
Finally, Firefox’s tools also come with a mobile preview option. To use it, click the Responsive Design Mode icon in the top right corner of the panel:

Responsive Design Mode lets you choose from several preset screen resolutions or set your own, and you can also toggle connection speed and device pixel ratio:

Get a Closer Look With Inspect
Once you learn the basics of your browser’s inspect tool, you might realize just how much information about your favorite websites is publicly available. With a few clicks, you can explore how exactly web pages are built, what styles they use, how they optimize for search engines, how they format on mobile screens, and a lot more.
Editor's note: This article was originally published in December 2020 and has been updated for comprehensiveness.
Don't forget to share this post!
Related articles.

Are .io Domains Good? Why Tech Startups Love .io Domains

15 Backend Project Ideas for Your Developer Portfolio

37 Backend Interview Questions and Answers: The Ultimate Guide 2022
![How to Build & Run an Effective Website With a Small Team or Budget [Startup Tips]](https://blog.hubspot.com/hubfs/website-on-a-budget.jpg "how to use safari web inspector on windows")
How to Build & Run an Effective Website With a Small Team or Budget [Startup Tips]

How to Code a Website for Free in 6 Easy Steps

How Long Does it Take to Build a Website?

Flush DNS: What It Is & How to Easily Clear DNS Cache
![How to Make a Website With User Accounts and Profiles [With WordPress, Wix, and More]](https://blog.hubspot.com/hubfs/how-to-create-user-accounts-and-profiles.jpeg "how to use safari web inspector on windows")
How to Make a Website With User Accounts and Profiles [With WordPress, Wix, and More]

Wildcard SSL Certificates: What They Are & How They Work

A Simple Explanation of SSL Certificate Errors & How to Fix Them
CMS Hub is flexible for marketers, powerful for developers, and gives customers a personalized, secure experience
Navigation Menu
Search code, repositories, users, issues, pull requests..., provide feedback.
We read every piece of feedback, and take your input very seriously.
Saved searches
Use saved searches to filter your results more quickly.
To see all available qualifiers, see our documentation .
- Notifications
Remotely debugging iOS Safari on Windows and Linux
HimbeersaftLP/ios-safari-remote-debug-kit
Folders and files, repository files navigation, remote debugging ios safari on windows and linux.
Using this project you can debug your websites and web applications running in iOS Safari from a PC running Windows or Linux.
It provides a free and up-to-date alternative to the discontinued remotedebug-ios-webkit-adapter by RemoteDebug and is the spiritual successor to the abandoned webkit-webinspector by Arty Gus . It is a free and open source alternative to inspect.dev.
The setup scripts ( generate.sh or generate.ps1 ) download the latest version of WebKit's built-in WebInspector and patch it to work with the WebSocket ios-webkit-debug-proxy provides and to be compatible with Chromium based browsers.
Requirements for running
- On Windows, it will automatically be downloaded, but you must also install and trust the device in iTunes for it to work
- For Linux, please follow the installation instructions .
- If you have Python or PHP on your system, you don't need to change anything
- If you have Node.JS on your system, just run npm i -g http-server and you're set.
- like Google Chrome, Edge or Opera
- like Epiphany/GNOME Web
Requirements for setup
- On Windows, I suggest using git for Windows in PowerShell
- On Linux, I suggest installing git from your package manager
Instructions
- Clone this repository to your PC
- On Windows, run generate.ps1 . On Linux, run generate.sh .
This will result in the folder WebKit being created inside src . It contains the WebInspector files.
- Plug your iOS device into your PC via USB
- On Windows, open iTunes and mark the iOS device as trusted (pop-up asks for confirmation the first time you connect a new device)
- On the iOS device, confirm that you trust the connection if asked
- Go to Settings->Safari->Advanced->Web Inspector and enable it
- Open the website you want to debug in Safari
- On Windows, run start.ps1 . On Linux, run start.sh . Make sure your iOS device's screen is unlocked.
- The ios-webkit-debug-proxy will show your iOS device's name as connected.
- If you have mutliple pages open or extensions installed, refer to http://localhost:9222/ for the page number that is at the end of the URL
- You should be greeted with the WebInspector and can now debug to your heart's content.
Troubleshooting
- If you get an error like Uncaught (in promise) Error: 'Browser' domain was not found from Connection.js:162 you are trying to inspect a page that is not inspectable (this could be caused by having Safari extensions installed). Refer to http://localhost:9222/ for the available pages and put the correct one at the end of the URL (for example http://localhost:8080/Main.html?ws=localhost:9222/devtools/page/2 ) for inspecting the second page.
- If you get an error like WebSocket connection to 'ws://localhost:9222/devtools/page/1' failed: from InspectorFrontendHostStub.js:68 , try unplugging your device and plugging it back in while the site you want to debug is open in Safari. Once you see the ios-webkit-debug-proxy console window display a message like Connected :9222 to Himbeers iPad (...) , refresh the inspector page inside your browser (do not use the refresh button on the inspector page, refresh the entire site from your browser).
- Two windows will open. One manages the web server and the other one is ios-webkit-debug-proxy .
- Alternatively you can also press Ctrl+C in the web server window
- Press Ctrl+C in the terminal window to exit
Known Issues
- "Events" on the "Timelines" tab don't work
- Canvas content doesn't show on the "Graphics" tab
- Minor style glitches due to Webkit vs. Chromium differences
If you want to see details about how this was made, you can read a detailed explanation in HOW_IT_WORKS.md (note that this document only describes how the very first version of this tool was created and might not be completely up-to-date).
Attribution
- webkit-webinspector for the idea
- ios-webkit-debug-proxy for the ios-webkit-debug-proxy tool
- WebKit for the WebInspector itself
Contributors 6
- PowerShell 35.9%
- JavaScript 34.7%
- Shell 28.4%
Productivity
How to use Inspect Element in Chrome, Safari, and Firefox

There's a powerful tool hiding in your browser: Inspect Element.
Right-click on any webpage, click Inspect , and you'll see the innards of that site: its source code, the images and CSS that form its design, the fonts and icons it uses, the JavaScript code that powers animations, and more. You can see how long the site takes to load, how much bandwidth it used to download, and the exact color in its text.
Or, you could use it to change anything you want on the page.
Inspect Element is a perfect way to learn what makes the web tick, figure out what's broken on your sites, mock up what a color and font change would look like, and keep yourself from having to Photoshop out private details in screenshots. Here's how to use Inspect Element—your browser's secret superpower—to do all the above and more.
Table of contents:
Why should I use Inspect Element?
How to inspect elements with google chrome, how to inspect elements with firefox, how to inspect elements with safari, tools you can access through inspect element (+ tutorials), find anything on a site with inspect element search, change anything with elements, test a site on any device with emulation.

If you've never peeked at a website's code out of curiosity, you might wonder why you should learn how to use Inspect Element. Below are just a few reasons why different roles can benefit from learning this trick of the trade.
Designer: Want to preview how a site design would look on mobile? Or want to see how a different shade of green would look on a sign-up button? You can do both in seconds with Inspect Element.
Marketer: Curious what keywords competitors use in their site headers, or want to see if your site's loading too slow for Google's PageSpeed test? Inspect Element can show both.
Writer: Tired of blurring out your name and email in screenshots? With Inspect Element, you can change any text on a webpage in a second.
Support agent: Need a better way to tell developers what needs to be fixed on a site? Inspect Element lets you make a quick example change to show what you're talking about.
Web developer: Need to look for broken code, compare layouts, or make live edits to a page? Inspect Element does that, too.
For these and dozens of other use cases, Inspect Element is a handy tool to keep around. For now, let's see how to use the main Elements tab to tweak a webpage on your own.
There are a few ways to access Google Chrome Inspect Element. Just open a website you want to try editing (to follow along with this tutorial, open the Zapier blog post What is AI? ), then open the Inspect Element tool in one of these three ways:
Method 1: Right-click anywhere on the webpage, and at the very bottom of the menu that pops up, click Inspect .

Method 2: Click the hamburger menu (the icon with three stacked dots) on the far-right of your Google Chrome toolbar, click More Tools , then select Developer Tools .

Once you take your preferred route to opening the Developer Tools pane, by default, it will show the Elements tab—that's the famed Inspect Element tool we've been looking for.
If you want to change the orientation of the Inspect Element pane, click the three vertical dots on the top-right side of the Inspect Element pane near the "X" (which you'd click to close the pane). Now, you'll see options to move the pane to the bottom, left, or right side of your browser or to open the pane in a completely separate window (undock view).

For this tutorial, let's dock the pane on the right side of our browser window to give us more space to work. You can make the Developer Tools panel wider or narrower by hovering over the left-side border. Once the ↔ cursor appears, drag the pane left to widen it or right to narrow it.
To get to Inspect Element on Firefox, like Chrome, you have three options.
Method 1: Right-click anywhere on the page and click Inspect at the bottom of the menu.

Method 2: Click the hamburger menu (three horizontal lines at the top-right corner of the window), select More tools , then click Web Developer Tools .

Method 3: The keyboard shortcut on Firefox is command + option + I for Macs and Control + Shift + C for PCs.
The Element pane in Firefox likes to pop up at the bottom of the window, which doesn't give you much room to work with. To move that pane to the side and free up more room, click the hamburger menu (three horizontal dots, next to the "X" in the top-right corner) and click Dock to Right (or left, if you prefer).

If you like, you can also move the pane into a separate window in this menu. You can also expand the pane further or narrow it by hovering over the edge until your cursor changes, and then drag it to the left or right.
To launch Inspect Element with Safari, you'll need to activate the developer capabilities in the advanced settings first. Here's how.
Click the Safari dropdown in the top navigation bar above the Safari window, and then click Preferences .

Navigate to Advanced , and check the box at the bottom of the window by Show Develop menu in the menu bar . Close the window.

Now, you should be able to right-click anywhere on the page and click Inspect Element to open the Elements pane.

The pane should appear along the bottom of your window. To move it to a side alignment and give yourself a little more space to look at the code, click the Dock to right of window (or left of window) option on the top-left corner of the pane, next to the "X."

I prefer right, but you can easily switch this to the other side or detach the pane into its own separate window if you prefer. To make the pane wider or narrower, just hover over the edge until the cursor changes to the dragger, then drag to move the edge.
Now that we're in Inspect Element, there's an array of useful tools at our fingertips that we can use to make any site look exactly how we want. For this tutorial, we'll focus on the Search , Elements , and Emulation tabs. These aren't the only useful tools Inspect Element opens up—not by a long shot—but they're extremely helpful ones that beginners can start putting to use right away.
Note that, for simplicity, I'll be using Chrome to demonstrate, but the instructions should be essentially the same for all three browsers.
Wondering what goes into your favorite sites? Search is your best tool for that, aside from reading a site's entire source code.
You can open the default Elements view, press Ctrl + F or command + F , and search through the source code. But the full Search tool will also let you search through every file on a page, helping you find text inside CSS and JavaScript files or locate an icon image you need for an article.
To get started, open Zapier's blog article on " What is AI? " in Chrome, then open Inspect Element, click the hamburger menu, and select Search . The Search tab will appear on the bottom half of the Developer Tools pane.

In the search field, you can type anything— anything —that you want to find on this webpage, and it will appear in this pane. Let's see how we can use this.
Type meta name into the search field, press Enter, and you'll immediately see every occurrence of "meta name" in the code on this page. Now, you can see this page's metadata, the SEO keywords it's targeting, and whether or not it's configured to let Google index it for search. That's an easy way to see what your competitors are targeting—and to make sure you didn't mess anything up on your site.

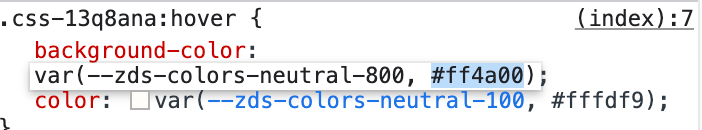
Search is an effective tool for designers as well since you can search by color, too. Type #ff4a00 into the search field and press Enter (and make sure to check the box beside Ignore case to see all of the results). You should now see every time the color #ff4a00, Zapier's shade of orange, appears in this site's CSS and HTML files. Then, just click the line that reads "color: #ff4a00;" to jump to that line in the site's HTML and tweak it on your own (something we'll look at in the next section).

This is a handy way for designers to make sure a site is following their brand's style guide. With the Search tool, designers can easily check the CSS of a webpage to see if a color is applied to the wrong element, if an incorrect font family is used on a webpage, or if you're still using your old color somewhere on your site.
The Search tool is also the perfect way to communicate with developers better since you can show them exactly where you've found a mistake or exactly what needs changing. Just tell them the line number where the problem exists, and you'll get your fix that much quicker.
Or you can change the webpage yourself with Elements , the core part of Chrome's Developer Tools.
Front-end developers use the Inspect Element tool every day to modify the appearance of a webpage and experiment with new ideas—and you can, too. Inspect Element lets you tweak the appearance and content of a webpage by adding temporary edits to the site's CSS and HTML files.
Once you close or reload the page, your changes will be gone; you'll only see the changes on your computer and aren't actually editing the real website itself. That way, you can feel free to experiment and change anything—and then copy and save the very best changes to use later.
Let's see what we can do with it.
Click the Elements tab in the Developer Tools pane—and if you want more room, tap your Esc key to close the search box you had open before. You should see the HTML for this page—now you know how the sausage gets made.

In the top-left corner of the Developer pane, you'll see an icon of a mouse on top of a square. Click it, then you can select any element on the page you want to change. So let's change some things!
Change the text on a webpage
Ever wanted to change text on a site? Perhaps to see how a new tagline would look on your homepage or to take your email address off a Gmail screenshot? Now you can.
Click the icon of a mouse cursor on a square in the top-left corner of the pane.
Click any text on the page (like the copy on our " What is AI? " blog), which will correspond with a blue highlight over the related code.

Double-click the highlighted text in the Developer Tools pane (not the text on the live page) to turn it into an editable text field.

Type anything you want in this text field ("Auri is a genius" should work just fine), and press Enter .
Voila! You've just (temporarily) changed the text on the webpage.

Refresh the page, and everything will go back to normal.
Fun? Let's try another way to change some things on this page by closing out of the Developer pane altogether. You can then highlight any part of the live webpage you want to edit, then right-click it and hit Inspect .

When your Developer Tools pane opens, it should automatically highlight that sentence. Pretty neat, huh? It's the little things that count.
Now that we've selected a sentence to change on our blog, let's change how it looks.
Change the color and font of elements
On the lower half of the Developer Tools pane, you'll see a sub-pane with a few additional tabs that allow you to change how this text looks on the page. Let's get started on the Styles tab.

You may notice that some things are crossed out. This means that these styles are not active for the element we've selected, so changing these values will have no effect.
Let's try changing something.
Look through the code for the "font-size" field and click into it. Let's change it from 34px to 42px.

Now scroll down to "color" and change it to Zapier's signature #ff4a00.

This will look a bit cramped, so let's finish by changing the "line-height" to 44px.

Now check the blog post to see the difference.

Now let's try something really cool.
Change element states
Want to see how a button or link will look once someone interacts with it? Inspect Element can show that, too, with force element state tools. You can see how the element will look once a visitor hovers over the element (hover state), selects the element (focus state), and/or has clicked that link (visited state).
As with the other examples, you'll need to click the mouse cursor/box icon. For this example, we'll select the "Artificial Intelligence (AI)" tag on the "What is AI" article to try a color change.
In the Developer Tools pane, right-click on that code in the Elements tab, hover over Force state , and click the :active: option. Do this one more time, but click the :hover: option this time.
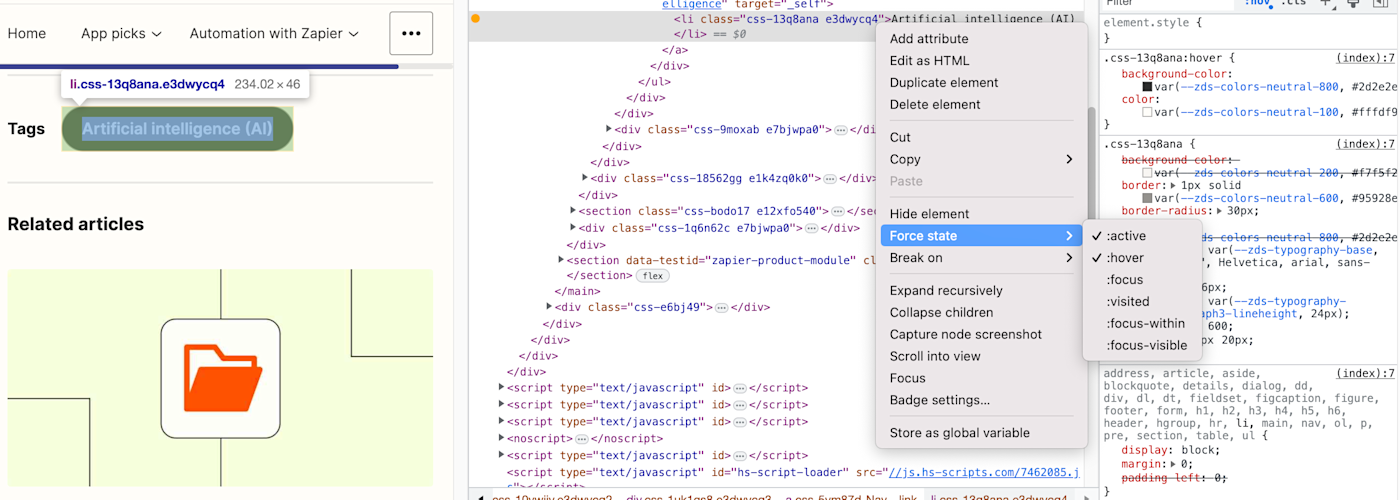
That will change the button's background to black, which is what happens when you hover over the button on the live site.
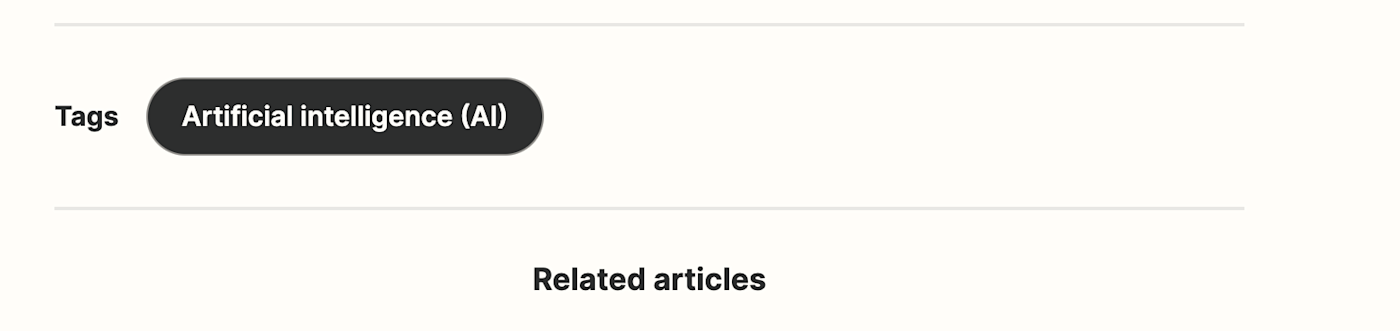
Now, change the "background-color" value to #ff4a00.
You should instantly be able to see what the new hover color will look like.

Try experimenting—change the :hover: color, then uncheck :hover: in the right-click menu and drag your mouse over the button to see the new button color.
Change images
You can easily change images on a webpage with Inspect Element, too. Using the same "What is AI?" blog post as an example, let's replace the orange solid color background on the "Power your automation with AI" button with a dramatic photo of a solar flare from NASA.
First, copy this link to the image: https://c1.staticflickr.com/9/8314/7931831962_7652860bae_b.jpg
Open Inspect Element on the orange background of the "Power your automation with AI" button and look for the "background-color" code in the pane.

Click "background-color" and replace color with image —this should cause an error. Just replace the color code with url and then paste the URL you copied into the parentheses.

This should automatically replace that boring single-color background with a flashy new image.

Note: You can also change a photo to a GIF or a video—all you need is a link to the file, and you can add it in.
Editing text is handy, swapping out images is fun, and changing colors and styles just might help you quickly mock up the changes you want made to your site. But how will that new tagline and button design look on mobile?
That's where Emulation comes in—it's where everything we've reviewed so far can be applied even further. Let's see how.
Everything has to be responsive today. Websites are no longer only viewed on computers—they're more likely than ever to be viewed on a phone, tablet, TV, or just about any other type of screen. You should always keep that in mind when creating new content and designs.
Emulation is a great tool to approximate how websites will look to users across various devices, browsers, and even locations. Though this does not replace actual testing on a variety of devices and browsers, it's a great start.
In the Developer Tools pane, you'll notice a little phone icon in the top-left corner. Click it. This should change the page into a tiny, phone-styled page with a menu at the top to change the size.

Resize the small browser to see how things look if you were browsing on a tablet, phone, or even smaller screen. Or, click the menu at the top to select default device sizes like Surface Duo or iPhone 12 Pro—let's go ahead and select the latter.
The webpage screen should shrink down to the device's size, and you can zoom in a bit by clicking the percentage dropdown next to the dimensions.
If you change the device preset to "Responsive," you can enlarge the view by dragging the right edge of the webpage emulation right. See what happens? Dragging the screen along the grid allows you to see how the webpage will change as the screen size changes. You can even toggle portrait and landscape views by clicking the little rotation icon at the end of the top menu.
Play around with the other devices to see how the webpage and screen resolution changes. All of the other developer tools we've gone over so far will also react to the device view.
Emulate mobile device sensors
When you start interacting with a device preview, you may notice that your mouse now appears as a little circle on the webpage. This allows you to interact with the page as if you're on your mobile device.
If you click while dragging the page down, it doesn't highlight text like it normally would in your browser—it drags the screen down like you're on a touchscreen device. Using this view, you can see how large touch zones are on a webpage. This means you can see which buttons, icons, links, or other elements are easily touchable with the finger.
You can even make your browser act like a phone. Press your Esc key to open the Search pane in Inspect Element again, and this time click the hamburger menu on the top-right. Select More tools and then Sensors to get four new tools: Location, Orientation, Touch, and Emulate Idle Detector state.
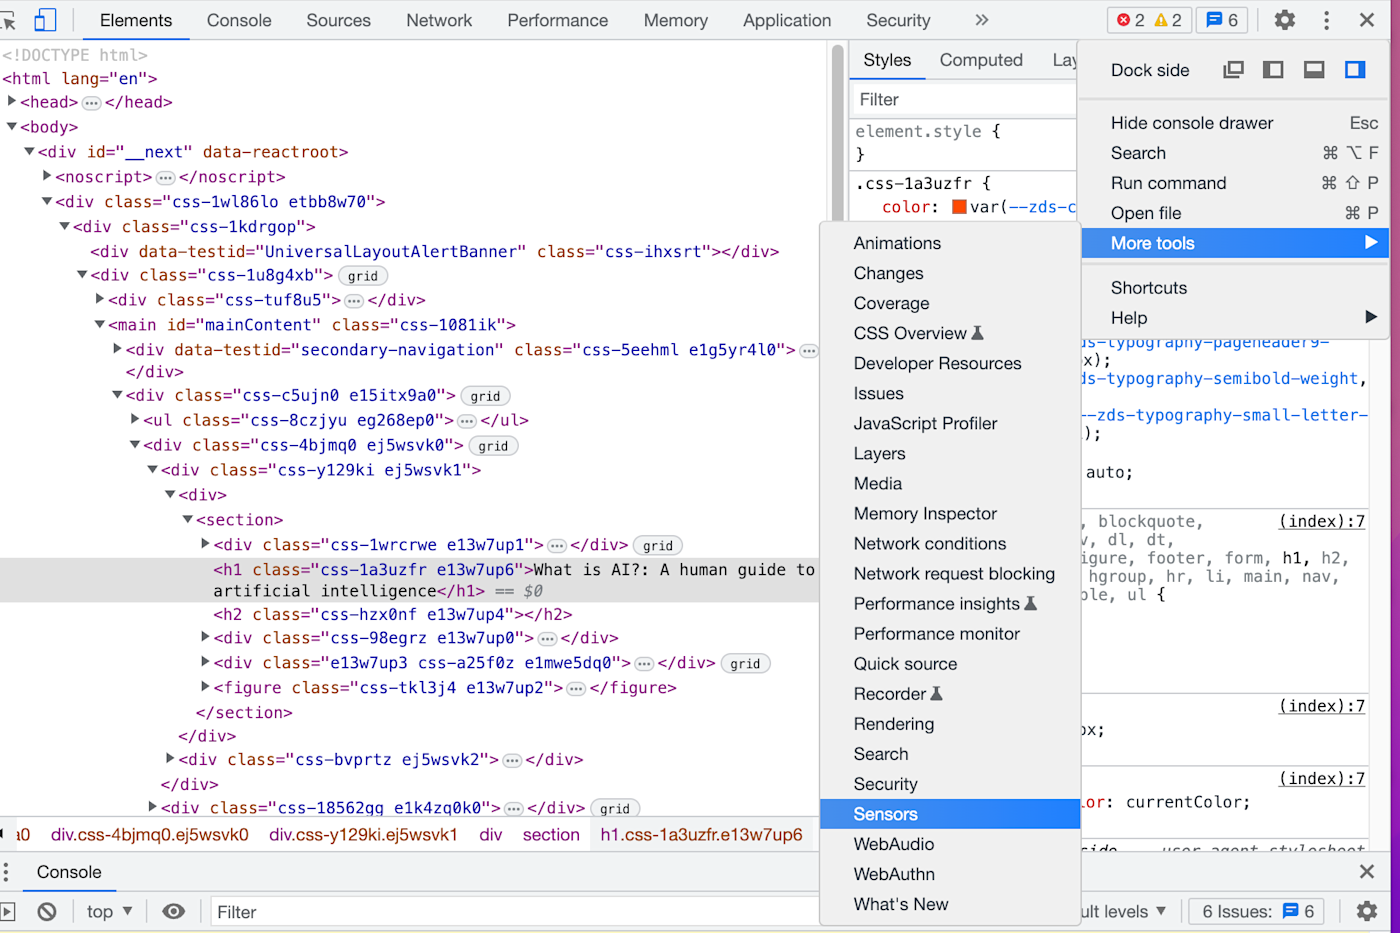
Touch lets you choose whether the circle selector that acts more like a finger than a normal mouse cursor is forced or device-specific.
Orientation lets you interact with motion-sensitive websites, such as online games that let you move things by moving your phone.
Location lets you pretend you're in a different location.
Emulate Idle Detector state allows you to toggle between different idle user conditions.
Let's try viewing this site from Berlin. Just click the dropdown and select the city—nothing changes, right?
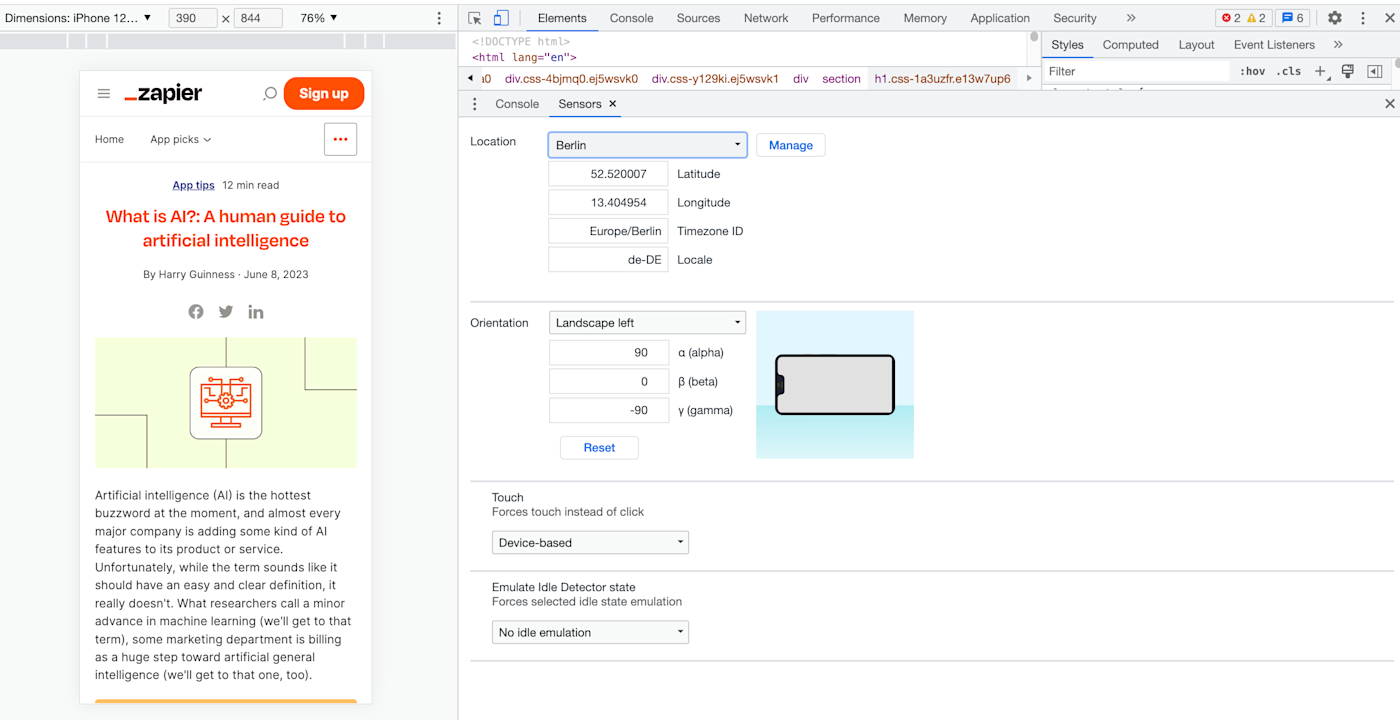
This is because there isn't content on this page that changes based on your location. If you change the coordinates on a site like Groupon.com that uses your location to show localized content, though, you would get different results. Go to Google.com in a different location, and you'll perhaps see a new Google logo for a holiday in another country, or at least will get the results in a different language.
Emulation is a great way to put yourself in your user's shoes and consider what the user may be seeing on your webpage—and it's a fun way to explore the international web.
Emulate mobile networks
You can also see what it's like to browse a site on different networks—perhaps to see if your site will load even if your users are on a slower 3G network.
To give it a try, click the hamburger menu in the top-right corner of the pane, hover over More tools , and select Network conditions .

There, you can choose from fast or slow 3G, or offline to see how the page works without internet. Or, click Add... to include your own testing (perhaps add 56Kbps to test dial-up internet). Now, reload the page, and you'll see just how long it'd take for the site to load on a slow connection—and how the site looks while it's loading. That'll show why you should improve your site to load faster on slow connections.

You can also change your user agent—uncheck Use browser default in the User agent field and select Firefox — Mac perhaps to see if the site changes its rendering for other browsers on different devices. That's also a handy hack to make webpages load even if they claim they only work in a different browser.
This is by no means a complete list of things you can do with Inspect Element. As you start exploring, you'll see many more features. My advice: click all the buttons .
Code by Zapier: How to add customizable triggers and actions to your Zaps
What is no code and why should you care?
Automate your work with the Zapier Chrome extension
The best collaboration tools for teams
This article was originally published in January 2015 by Auri Pope. The most recent update was in June 2023.
Get productivity tips delivered straight to your inbox
We’ll email you 1-3 times per week—and never share your information.

Bryce Emley
Currently based in Albuquerque, NM, Bryce Emley holds an MFA in Creative Writing from NC State and nearly a decade of writing and editing experience. His work has been published in magazines including The Atlantic, Boston Review, Salon, and Modern Farmer and has received a regional Emmy and awards from venues including Narrative, Wesleyan University, the Edward F. Albee Foundation, and the Pablo Neruda Prize. When he isn’t writing content, poetry, or creative nonfiction, he enjoys traveling, baking, playing music, reliving his barista days in his own kitchen, camping, and being bad at carpentry.
- Software & web development
- Internet browsers
Related articles

How to add an email signature in Outlook

How to create and customize Airtable views

Why won't Google Docs let me paste without installing an extension?
Why won't Google Docs let me paste without...

How to use IMPORTRANGE in Google Sheets
Improve your productivity automatically. Use Zapier to get your apps working together.

Safari Web Inspector Guide
- Table of Contents
- Jump To…
- Download Sample Code
Retired Document
Important: This document no longer represents the most current version of Safari developer tools. Links to downloads and other resources may no longer be valid. For new documentation on Safari Web Inspector, please visit Safari Developer Help .
About Safari Web Inspector
Web Inspector is an open source web development tool built into Safari that makes it easy to prototype, optimize, and debug your web content on iOS and OS X.

Read this guide to get started using Web Inspector.
At a Glance
This document is organized by areas of the Web Inspector interface.
Get Started
Learn how to enable and customize the appearance of Web Inspector.
Inspect the DOM and Resources
At the heart of Web Inspector is the ability to inspect the Document Object Model (DOM). Web Inspector shows you the structure of your DOM as perceived by Safari’s rendering engine, WebKit. But the DOM isn’t all you can inspect. External resources and locally stored data—such as scripts, stylesheets, and offline storage—can be inspected, providing insight to the data available to your web content.
Measure and Improve Page Performance
Web Inspector provides a suite of tools you can use to quantify the speed of your webpages. You can monitor network requests as they download, observe page layout calculations performed by the WebKit rendering engine, and profile the efficiency of your JavaScript functions and CSS selectors.
Debug JavaScript
Turn to Web Inspector when your front-end logic goes awry. Web Inspector offers a debugging environment that lets you pause script execution and observe the values of your variables as they are defined.
Interact with the Console
Lift up the hood of your webpages and interact directly with your web content in the console.
How to Use This Document
When reading this document, follow along with Web Inspector open in Safari. It is recommended to actively use Web Inspector on this page while you read about its features for a hands-on learning experience.
WWDC 2013: Getting to Know Web Inspector provides a walkthrough of the Web Inspector UI.
WWDC 2013: Getting the Most Out of Web Inspector describes advanced concepts of harnessing the power of Web Inspector to your advantage.
Safari Extensions Development Guide delivers step-by-step directions for creating Safari extensions using Extension Builder.
Safari Extensions Reference lists the JavaScript classes, methods, and properties you can access with Safari extensions.
Safari Web Content Guide offers guidance for developing web content for iOS.
Copyright © 2018 Apple Inc. All Rights Reserved. Terms of Use | Privacy Policy | Updated: 2018-02-07
- Español – América Latina
- Português – Brasil
- Tiếng Việt
- Chrome for Developers
Debugging websites in Chrome on iOS 16.4+

From Chrome 115 you can enable Safari Web Inspector debugging for Chrome on iOS. This post explains how to get started.
Prior to Chrome 115, debugging webpages required building Chrome for iOS from source, as the release version of WKWebView did not support remote Web Inspector debugging. In Chrome 73, we added the chrome://inspect page which locally displays JavaScript logs to assist in debugging webpages. Now that WKWebView allows Web Inspector debugging in release (as of iOS 16.4), we have added a setting in Chrome 115 to enable this feature and further improve the developer experience.
Getting started
On your iOS device you need:
- iOS 16.4 or greater.
- Chrome 115 or greater.
On your Mac you need:
- The Safari Develop menu enabled. Enable this from Safari application settings, Advanced Settings tab.
On your iOS device launch the Chrome app and navigate to Settings . In Content Settings , enable Web Inspector. Relaunch Chrome for iOS after changing this setting.
Debugging your site
With the setting enabled, you can debug any page running in Chrome for iOS by following these steps.
- Connect your iOS device to a Mac with a cable.
- In Chrome for iOS, navigate to the website which you'd like to inspect.
- On your Mac, launch Safari. From the Develop menu, hover over the name of your connected device and select the url of the website which you would like to inspect.
The displayed Web Inspector window will allow debugging of the current web view. For more details about using Safari Developer Tools, refer to Apple's documentation .
Except as otherwise noted, the content of this page is licensed under the Creative Commons Attribution 4.0 License , and code samples are licensed under the Apache 2.0 License . For details, see the Google Developers Site Policies . Java is a registered trademark of Oracle and/or its affiliates.
Last updated 2023-07-18 UTC.
COMMENTS
New iOS 6 Safari comes with Web Inspector feature which allows to connect to it from your desktop Safari via USB cable. It then allows you to debug pages opened in iOS Safari from your desktop. ... Stumbled upon this blog which shows how to debug iOS web app on Windows using a stndalone app by Telerik called AppBuilder. You're supposed to ...
The most complete resource for Web Inspector is the Web Inspector Reference, and help links in Web Inspector itself can take you to help specific to the current part of the tools you are using. The Interface. Web Inspector is divided into multiple tabs, with navigation and details sidebars, a main content area, a console prompt at the bottom ...
Hover over the desired handset. (Let's take iPhone 11 Pro for this example) From the two options available - Chrome and Safari icon. Click on the Safari logo. Clicking on the Safari icon will initiate a new Safari session on a real iPhone 11 Pro. Now, the user can navigate to the desired website that needs to be debugged.
Press the Windows Key + S to search, then search for "PowerShell". Right-click on Windows PowerShell and click Run as administrator. Install the remotedebug-ios-webkit-adapter. Use the following PowerShell command: npm install remotedebug-ios-webkit-adapter -g. When that is complete, you will see an "updated 1 package in Xs" message:
Have you ever needed to debug a website (especially JavaScript or CSS) in Safari on an iOS device but didn't have a Mac handy? I ran into this problem, and a...
Web development tools. Apple has brought its expertise in development tools to the web. Safari includes Web Inspector, a powerful tool that makes it easy to modify, debug, and optimize websites for peak performance and compatibility on both platforms. And with Responsive Design Mode, you can preview your web pages in various screen sizes ...
On your iOS device, go to Settings > Safari > Advanced and enable Web Inspector, more details can be found here. Step 2 Instal the RemoteDebug iOS WebKit Adapter npm package: npm i -g remotedebug ...
Now, if you want to debug a website with a specific defect for a particular screen size or review a particular webpage element, you need to use the Web Inspector on the Safari Developer Tools. To enable Web Inspector, go to Develop > Show Web Inspector; Then, click View > Customise Toolbar. In the dialog box, drag the Web Inspector icon and ...
Step 2: Plug in your apple device. Step 3: Start the remote debug package on an unused port: remotedebug_ios_webkit_adapter --port=9000. Step 4: Open chrome on windows, and navigate to device ...
To enable Web Inspector in Safari(or Safari Technology Preview): click the Safari(or Safari Technology Preview) menu bar item. select Preferences…. (or press ⌘,) go to the Advancedpane. check the Show Develop menu in menu barcheckbox. Show Web Inspector(or pressing ⌥⌘I) in the Developmenuor by right-clicking on any page in Safari(or ...
Activate Web Inspector on iOS: Go to Settings > Safari > Advanced and move the Web Inspector toggle switch to the On position. Use Web Inspector on macOS: Connect your iOS device to a Mac and choose the URL to inspect from the Develop menu. If you run into a bug or another issue with a website on Safari mobile, use the Web Inspector tool to ...
Using this project you can debug your websites and web applications running in iOS Safari from a PC running Windows or Linux. ... On the iOS device, go to Settings->Safari->Advanced->Web Inspector and enable it; Open the website you want to debug in Safari; On Windows, run start.ps1.
Open up Web Inspector. There are three ways to open Web Inspector in Safari: Option 1: Right-click any part of the page and choose Inspect Element. Right-clicking a specific page element will open that element in the inspector view. Option 2: Choose Develop > Show Web Inspector from the top menu bar.
On Windows, open iTunes and mark the iOS device as trusted (pop-up asks for confirmation the first time you connect a new device) On the iOS device, confirm that you trust the connection if asked; Go to Settings->Safari->Advanced->Web Inspector and enable it; Open the website you want to debug in Safari; On Windows, run start.ps1. On Linux, run ...
To get to Inspect Element on Firefox, like Chrome, you have three options. Method 1: Right-click anywhere on the page and click Inspect at the bottom of the menu. Method 2: Click the hamburger menu (three horizontal lines at the top-right corner of the window), select More tools, then click Web Developer Tools.
Enabling Web Inspector. To start using Web Inspector, you must first enable the Develop menu. Enable the Develop Menu. Choose Safari > Preferences, and click Advanced. At the bottom of the pane, select the "Show Develop menu in menu bar" checkbox. Choose Develop > Show Web Inspector.
Enable web inspector on your iOS device. Take your iOS device and go to Settings > Safari > Advanced and enable Web Inspector. Open Safari on your iOS device and browse to a website. You should almost immediately see the website appear in Chrome under the Remote Target section. edited Feb 9, 2023 at 14:27.
Enable Web Inspector on iOS : Open the Settings app on your iPhone or iPad. Scroll down and tap Safari. Scroll to the bottom of the page and tap Advanced. Tap the toggle next to Web Inspector to the On position. Enable Safari Developer Mode on Mac : Open Safari on your Mac. Click Safari in the top left corner of your Menu Bar.
To access the Responsive Design Mode, enable the Safari Develop menu. Follow the steps below to enable the Develop menu: Launch Safari browser. Click on Safari -> Settings -> Advanced. Select the checkbox -> Show Develop menu in menu bar. Once the Develop menu is enabled, it'll show up in the menu bar as shown in the image below: Note ...
Get Oriented. Resources and the DOM. Timelines. Debugger. The Console. Appendix A: The Develop Menu. Appendix B: Keyboard Shortcuts. Revision History. Describes the developer tool built into Safari that helps you prototype, optimize, and debug web content.
Connect your iOS device to a Mac with a cable. In Chrome for iOS, navigate to the website which you'd like to inspect. On your Mac, launch Safari. From the Develop menu, hover over the name of your connected device and select the url of the website which you would like to inspect. The displayed Web Inspector window will allow debugging of the ...