How to debug mobile websites on iPhone using Inspect

Millions of users worldwide expect to access websites and web apps on their iOS devices (typically iPhones) through the Safari browser. As a result, web developers need to ensure that their website works flawlessly on iPhone-Safari combination browsers.

The easiest way to Inspect and debug web apps and pages in Safari
Inspect allows you to debug Safari and WebViews from any iOS, macOS, Linux, and Windows device with ease, making the platform accessible to virtually every developer.

As an added benefit, users do not need any additional hardware to use Inspect for iOS Safari debugging since it's a cross-platform software solution. With Inspect, you can get straight to the task at hand without wasting money on expensive hardware units or wasting time teaching yourself how to navigate a complicated platform.
How to use Inspect to debug iOS Safari apps and sites
Inspect has a user-friendly interface that's intuitive to anyone with web development experience. All you need to get started is your iOS device, PC, and a USB cord or a Wi-Fi connection. With Inspect, you can begin using our DevTools to modify, debug, and optimize your website to create a smooth browsing experience for iOS Safari users.

Here are the simple steps to follow whether you're testing or debugging an iOS Safari web page or app with Inspect:
- Connect your iOS device to your PC via USB cable or Wi-Fi . You can use any device with a macOS, Linux, or Windows operating system.
- Start Inspect and follow the instructions on how to setup your computer.
- You are good to go!
Noteworthy features of Inspect DevTools
So, you already know that Inspect's interface is extremely simple to operate. But, what else makes Inspect stand out from the countless other DevTool platforms on the market? In other words, why should you choose Inspect over its competitors?
Inspect rises above other industry leaders because our DevTools software is easy to use and is loaded with great features for developers. Using Inspect DevTools proves to be much less complicated than navigating Apple's Web Inspector and other platforms. You don't have to alter your devices' settings or enable menu bars. Our interface is completely streamlined, and most iOS Safari debugging phases can be done through the platform.
Here are Inspect's advanced features that make our software stand out from the crowd:
- Cross-platform iOS Safari debugging
- Built on Chrome DevTools UI
- DOM inspection
- CSS editing
- JavaScript debugging
- Storage inspecting
- ServiceWorker debugging
- Screencasting
Begin your free trial of Inspect today!
Our DevTools software has all of the features you've been searching for when debugging an iOS Safari web page and more.
We offer cross-platform support for fixing Safari webpages, so there’s no need to invest in a MacBook when using our software. We’re sure you’ll love Inspect because of its ability to streamline the debugging process, allowing you to get your site up and running faster than your competitors.
Many successful website engineers from well-known companies such as Eventbrite, Plaid, Microsoft, Instacart, and Philips are already reaping the benefits of our innovative platform.
Try Inspect today and see the magic for yourself!
Happy Inspecting!
Inspecting Safari’s Web Browser on a Mobile Device

Article summary
Why inspect on a device mobile browser, set up osx safari for inspection.
Inspecting the browser gives you access to the details of a website or application. Using built-in developer tools and third-party add-ons, we can view the inner workings of an application.
For example, you can see the content structure in DOM, view the console for logs or error messages, and review network requests for assets being loaded. When debugging a user interface problem, you can use the elements panel to modify live content on the screen, changing the content, type color, or button sizes.
By parsing though this information, you can often get to the bottom of your issue.
Most browsers now have tools to mimic devices such as tablets and mobiles, so you can inspect and debug right on your computer. This has been extremely helpful in developing and testing our work, but sometimes, it doesn’t go far enough.
Because this solution is just emulating a mobile device, it doesn’t always have the same oddities as the actual device. Fortunately, you can plug in a device and inspect it just as you would with a normal browser on your computer.
Let’s walk through an example using Safari.
For this solution to work, both your device and computer need to be properly configured. In our example, we’ll be using OSX Safari on an iPhone with iOS 10 and a Macbook Pro.
Set up your device
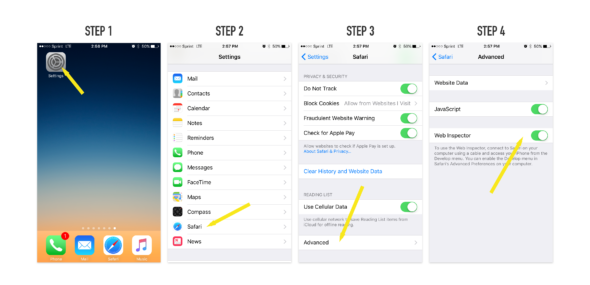
- Click Setting to access your general iPhone Settings.
- Scroll and select Safari’s Settings.
- Scroll and select Advanced.
- Toggle the Web Inspector to On.
Set up your computer
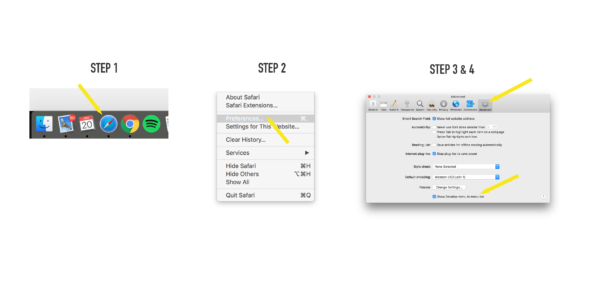
- Open Safari.
- Open Preferences from the File Safari dropdown menu.
- Click the Advance tab in the options.
- Turn on Show Develop menu in menu bar.
Great! We’re almost there.
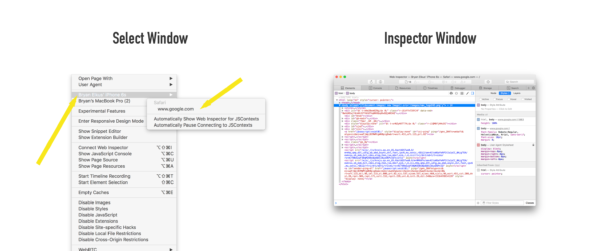
Now plug your device into the computer via USB. Using the mobile device, navigate to a page or application you want to inspect.
Next, shift over to your computer. With Safari open, select the Develop menu in the menu bar. Toward the top of that list, you should see your device’s name and the windows that are available to inspect. Select the page or application to inspect, and the inspection window will open.
From here, the review process works the same as it would if you were inspecting a window on your local machine. There are a couple of drawbacks such as not being able to target an element with your mouse or right-click to inspect an element. Instead, you’ll have to navigate up and down the DOM tree or leverage the find feature via Command + F in the inspect window.
This method has allowed us to fix difficult bugs as well as test and prototype right in the native browser. Give it a try next time you’re in that situation.
Related Posts
5 tailwind css anti-patterns to avoid, what to consider when selecting a component library, prime faces: a worthy bootstrap alternative, keep up with our latest posts..
We’ll send our latest tips, learnings, and case studies from the Atomic braintrust on a monthly basis.

Hello, i believe that i noticed you visited my web site so i got here to return the favor?.I’m attempting to to find things to enhance my website!I guess its ok to make use of a few of your ideas!!|
Comments are closed.
Tell Us About Your Project
We’d love to talk with you about your next great software project. Fill out this form and we’ll get back to you within two business days.
How To Use Inspect In Safari

- Software & Applications
- Browsers & Extensions

Introduction
Safari, Apple's widely used web browser, offers a powerful tool known as the Inspector, which allows users to delve into the inner workings of web pages. Whether you're a web developer, designer, or simply a curious user, the Inspector can provide valuable insights into the structure, layout, and functionality of websites. By understanding how to use the Inspector effectively, you can gain a deeper understanding of web development and design, and even troubleshoot issues that may arise while browsing the web.
In this article, we will explore the various features of the Inspector in Safari, guiding you through its different tabs and demonstrating how each can be utilized to analyze and manipulate web content. From inspecting and modifying HTML elements to examining network activity and debugging JavaScript, the Inspector offers a wide array of tools to aid in understanding and enhancing the web browsing experience.
Whether you're looking to customize the appearance of a webpage, optimize its performance, or gain insights into its underlying code, the Inspector in Safari is a versatile and indispensable tool. By the end of this article, you will have a comprehensive understanding of how to leverage the Inspector to gain valuable insights into web development and design, empowering you to make the most of your browsing experience.
Opening the Inspector
To begin exploring the powerful capabilities of the Inspector in Safari, you first need to open it. There are several ways to access the Inspector, each providing quick and convenient access to its robust features.
Using the Menu Bar
One of the simplest methods to open the Inspector is through the Safari menu bar. By navigating to the "Develop" menu and selecting "Show Web Inspector," you can swiftly launch the Inspector, ready to delve into the inner workings of any webpage.
Keyboard Shortcuts
For those who prefer to streamline their workflow with keyboard shortcuts, Safari offers a quick and efficient way to open the Inspector. By pressing "Option + Command + I" on a Mac, or "Ctrl + Option + I" on a Windows PC , you can instantly access the Inspector, saving valuable time and effort.
Right-Click Context Menu
Another convenient way to open the Inspector is by right-clicking on any element within a webpage and selecting "Inspect Element" from the context menu. This method allows for immediate inspection of specific elements, making it ideal for targeted analysis and modification.
Using the Address Bar
Safari also provides a direct method to open the Inspector by entering a special command in the address bar. By typing "inspect" or "inspector://" followed by the Enter key, the Inspector will promptly appear, ready for exploration.
Docked Inspector
Once the Inspector is open, it can be docked to the bottom, right, or left of the browser window, providing a customizable layout that suits your preferences. This feature allows for seamless multitasking, as you can simultaneously view the Inspector and the webpage, making it easier to analyze and modify elements in real-time.
By familiarizing yourself with these various methods to open the Inspector, you can seamlessly integrate its powerful capabilities into your web browsing and development workflow. With the Inspector readily accessible, you are well-equipped to embark on a journey of exploration and discovery within the intricate world of web development and design.
Elements Tab
The Elements tab within the Inspector in Safari serves as a gateway to the underlying structure of a web page. Upon opening the Inspector and navigating to the Elements tab, you are presented with a visual representation of the Document Object Model (DOM) of the current webpage. This hierarchical view allows you to inspect and manipulate various elements, providing valuable insights into the composition and layout of the page.
Understanding the DOM Tree
At the core of the Elements tab lies the DOM tree, which organizes the HTML elements of the webpage in a nested structure. Each HTML element, such as headings, paragraphs, images, and more, is represented as a node within the tree. By expanding and collapsing nodes, you can navigate through the DOM tree to locate specific elements and understand their relationships to one another.
Inspecting Elements
The Inspector empowers you to inspect individual elements within the DOM, revealing a wealth of information about each element. By hovering over elements in the Inspector or on the webpage itself, you can visually highlight the corresponding elements, making it easier to identify and select specific components for further analysis.
Modifying Attributes and Styles
One of the most powerful features of the Elements tab is the ability to modify attributes and styles of HTML elements in real-time. By double-clicking on an element's attributes or styles, you can directly edit them within the Inspector, instantly observing the visual changes on the webpage. This dynamic editing capability is invaluable for experimenting with different design and layout modifications without altering the actual source code.
Event Listeners
In addition to visual and structural inspection, the Elements tab provides insights into event listeners attached to various elements. This feature is particularly useful for understanding the interactivity and functionality of a webpage, as it allows you to view and manage event listeners associated with specific elements.
Accessibility and Validation
Furthermore, the Inspector in Safari includes accessibility and validation tools within the Elements tab, enabling you to assess the accessibility of elements and validate the HTML structure for compliance with web standards. This functionality is essential for ensuring that web content is accessible to all users and adheres to best practices in web development.
By mastering the Elements tab in the Inspector, you gain the ability to dissect and manipulate the building blocks of web pages, fostering a deeper understanding of web development and design. Whether you're fine-tuning the layout, debugging issues, or optimizing accessibility, the Elements tab equips you with the tools to navigate the intricate web of HTML elements with confidence and precision.
The Styles tab, a pivotal component of the Inspector in Safari, serves as a gateway to the visual presentation and styling of a web page. Upon navigating to the Styles tab within the Inspector, you are greeted with a comprehensive overview of the CSS (Cascading Style Sheets) rules that define the appearance and layout of the current webpage. This powerful tool provides invaluable insights into the styling hierarchy, inheritance, and applied styles, empowering you to analyze, modify, and optimize the visual aspects of web content.
Comprehending the Style Rules
At the heart of the Styles tab lies a detailed display of CSS rules that dictate the appearance of elements on the webpage. Each rule encompasses selectors, properties, and values, collectively shaping the visual presentation of the content. By examining these rules, you can gain a profound understanding of how styles are applied and inherited throughout the DOM, unraveling the intricacies of the cascading nature of CSS.
Visualizing Box Model and Layout
The Styles tab offers a visual representation of the box model for selected elements, illustrating the dimensions, padding, borders, and margins that define the layout of each element. This feature provides a clear and intuitive depiction of the spatial attributes of elements, facilitating precise adjustments to the layout and spacing without the need to decipher complex CSS code.
Modifying Styles in Real-Time
One of the most compelling capabilities of the Styles tab is the ability to modify CSS styles directly within the Inspector, observing instantaneous visual updates on the webpage. By clicking on individual style properties, you can alter their values, experiment with different design variations, and witness the immediate impact on the layout and appearance of the content. This dynamic editing functionality empowers you to fine-tune the visual presentation of web pages with unparalleled efficiency and precision.
Understanding Computed Styles
In addition to the explicit CSS rules, the Styles tab provides insights into the computed styles of elements, revealing the final, computed values of all CSS properties. This feature is instrumental in understanding how styles are resolved and applied to elements, shedding light on the intricate process of style computation and inheritance within the DOM.
Optimizing Performance and Responsiveness
Furthermore, the Styles tab includes tools for analyzing and optimizing the performance and responsiveness of web content. By inspecting and managing styles related to layout and rendering, you can identify opportunities to enhance the speed and efficiency of webpage display, ensuring a seamless and responsive user experience across various devices and screen sizes.
By harnessing the capabilities of the Styles tab within the Inspector, you gain a profound understanding of the visual presentation and styling of web content. Whether you're refining the layout, optimizing performance, or experimenting with design variations, the Styles tab equips you with the tools to navigate the intricate realm of CSS with confidence and finesse.
Resources Tab
The Resources tab in Safari's Inspector serves as a comprehensive resource management tool, offering insights into various aspects of web content, including network activity, storage, and more. Upon navigating to the Resources tab within the Inspector, you gain access to a wealth of information that enables you to analyze, monitor , and optimize the resources utilized by web pages.
Resource Overview
The Resources tab provides a holistic overview of the resources loaded by the current webpage, encompassing a wide range of elements such as documents, stylesheets, scripts, images, fonts, and more. This comprehensive view allows you to understand the composition of resources that contribute to the rendering and functionality of the webpage, providing valuable insights into the underlying assets that shape the user experience.
Network Requests
One of the key features of the Resources tab is the network request log, which meticulously records all HTTP requests initiated by the webpage. This log includes details such as request and response headers, timing, and resource size, enabling you to assess the performance and efficiency of network requests. By analyzing the network activity, you can identify potential bottlenecks, optimize resource loading, and ensure swift and seamless delivery of content to users.
Storage and Caching
In addition to network activity, the Resources tab offers visibility into various forms of storage utilized by web pages, including cookies, local and session storage, and application caches. This feature allows you to monitor and manage the storage of data, ensuring compliance with privacy regulations and optimizing the utilization of storage resources for enhanced user experience.
Initiating and Analyzing XHR/Fetch Requests
The Resources tab facilitates the inspection and analysis of XMLHttpRequest (XHR) and Fetch requests made by web pages, providing detailed insights into the data exchanged between the client and server. By monitoring XHR and Fetch requests, you can troubleshoot data retrieval and transmission issues, validate response data, and ensure the seamless operation of dynamic web applications.
Performance Analysis
Furthermore, the Resources tab includes tools for performance analysis, enabling you to assess the loading times of individual resources, identify potential performance bottlenecks, and optimize the delivery of content for enhanced user experience. This functionality is instrumental in fine-tuning the performance of web pages, ensuring swift and efficient resource loading across diverse network conditions and devices.
By leveraging the capabilities of the Resources tab within the Inspector, you gain a comprehensive understanding of the resources utilized by web pages, empowering you to optimize network activity, storage, and performance for an unparalleled user experience. Whether you're analyzing network requests, managing storage, or fine-tuning performance, the Resources tab equips you with the tools to navigate the intricate realm of web resources with precision and efficiency.
Network Tab
The Network tab within Safari's Inspector is a vital tool for analyzing the network activity of web pages, providing valuable insights into the loading and transmission of resources. Upon navigating to the Network tab, you gain access to a comprehensive log of network requests initiated by the webpage, along with detailed information about each request and response.
Monitoring Network Activity
The Network tab meticulously records all network requests, including HTTP requests for documents, stylesheets, scripts, images, and other resources. Each request is accompanied by essential details such as request and response headers, timing, resource size, and the initiator responsible for the request. This comprehensive log allows you to monitor the sequence and performance of network requests, enabling you to identify potential bottlenecks and optimize resource loading.
Request and Response Details
By selecting individual network requests in the log, you can delve into the specifics of each request and response. This includes insights into request headers, response headers, status codes, and response content, providing a granular understanding of the data exchange between the client and server. Analyzing these details allows you to troubleshoot issues related to resource loading, validate response data, and ensure the efficient delivery of content to users.
Performance Analysis and Timing
The Network tab offers tools for performance analysis, allowing you to assess the loading times of individual resources and the overall timeline of network activity. By examining the timing of network requests, you can pinpoint potential performance bottlenecks, optimize resource loading, and ensure swift and efficient delivery of content. This functionality is instrumental in fine-tuning the performance of web pages, ensuring a seamless user experience across diverse network conditions.
Filtering and Sorting Capabilities
To streamline the analysis of network activity, the Network tab provides filtering and sorting capabilities, enabling you to focus on specific types of requests or isolate requests based on various criteria. This feature empowers you to efficiently identify and address issues related to resource loading, network latency, and content delivery, fostering a responsive and optimized web browsing experience.
Initiating XHR/Fetch Requests
In addition to monitoring network requests initiated by the webpage, the Network tab facilitates the inspection and analysis of XMLHttpRequest (XHR) and Fetch requests. This feature provides detailed insights into the data exchanged between the client and server, allowing for thorough validation of response data and troubleshooting of dynamic web application functionality.
By harnessing the capabilities of the Network tab within the Inspector, you gain a comprehensive understanding of the network activity of web pages, empowering you to optimize resource loading, troubleshoot performance issues, and ensure seamless content delivery. Whether you're analyzing network requests, fine-tuning performance, or validating response data, the Network tab equips you with the tools to navigate the intricate realm of network activity with precision and efficiency.
Console Tab
The Console tab within Safari's Inspector serves as a dynamic interface for interacting with the JavaScript console of web pages, offering a powerful set of tools for debugging, logging, and executing JavaScript code. Upon navigating to the Console tab, you gain access to a versatile environment that enables you to monitor runtime errors, log messages, inspect JavaScript objects, and execute ad-hoc scripts, providing invaluable insights into the behavior and functionality of web applications.
Error Logging and Debugging
One of the primary functions of the Console tab is to capture and display runtime errors and exceptions encountered by JavaScript code within the webpage. By monitoring the console output, you can swiftly identify and address errors, ensuring the smooth operation of web applications. Additionally, the console provides detailed stack traces and contextual information for each error, facilitating thorough debugging and troubleshooting of JavaScript code.
Logging Messages and Variables
The Console tab allows for the logging of custom messages, variables, and objects, providing a means to track the execution flow and state of JavaScript code. By utilizing the console.log() method, you can output informative messages and inspect the values of variables and objects at specific points in the code, enabling you to gain visibility into the internal workings of web applications and pinpoint potential issues.
Interactive JavaScript Execution
In addition to logging and debugging, the Console tab offers an interactive environment for executing JavaScript code directly within the Inspector. This feature allows you to experiment with JavaScript expressions, test functions, and manipulate objects in real-time, fostering a dynamic and exploratory approach to understanding and modifying the behavior of web applications.
Network Request Monitoring
Furthermore, the Console tab provides visibility into network requests and responses, allowing you to monitor the exchange of data between the client and server. By capturing network-related messages and errors, you can assess the performance and integrity of data transmission, troubleshoot connectivity issues, and validate the handling of network requests within web applications.
Performance Profiling
Moreover, the Console tab includes tools for performance profiling, enabling you to analyze the execution time and memory usage of JavaScript code. By leveraging the built-in profiling capabilities, you can identify performance bottlenecks, optimize code efficiency, and ensure the responsive and efficient operation of web applications.
By harnessing the capabilities of the Console tab within the Inspector, you gain a comprehensive understanding of JavaScript runtime behavior, empowering you to debug, log, and execute JavaScript code with precision and agility. Whether you're troubleshooting errors, monitoring network activity, or profiling performance, the Console tab equips you with the tools to navigate the intricate realm of JavaScript development with confidence and insight.
In conclusion, the Inspector in Safari is a multifaceted and indispensable tool that empowers users to delve into the inner workings of web pages, gaining valuable insights into web development and design. By exploring the various tabs of the Inspector, including Elements, Styles, Resources, Network, and Console, users can unravel the complexities of web content, optimize performance, troubleshoot issues, and gain a deeper understanding of the technologies that drive the modern web.
The Elements tab provides a window into the hierarchical structure of web pages, allowing users to inspect, manipulate, and validate HTML elements with precision. From understanding the Document Object Model (DOM) to modifying attributes and styles in real-time, the Elements tab equips users with the tools to dissect and fine-tune the building blocks of web content.
Moving on to the Styles tab, users can gain a comprehensive understanding of the visual presentation and styling of web pages. By analyzing CSS rules, visualizing the box model, and modifying styles on the fly, the Styles tab facilitates the optimization of layout, performance, and design, empowering users to craft visually compelling and responsive web experiences.
The Resources and Network tabs offer invaluable insights into the resources utilized by web pages and the network activity that drives content delivery. From monitoring network requests and performance analysis to managing storage and optimizing resource loading, these tabs provide the tools to ensure swift, efficient, and seamless delivery of web content to users across diverse network conditions and devices.
Finally, the Console tab serves as a dynamic interface for interacting with the JavaScript console, enabling users to log messages, debug errors, execute scripts, and profile performance. This feature-rich environment empowers users to troubleshoot JavaScript code, monitor network activity, and validate the behavior of web applications, fostering a deeper understanding of client-side development and interactivity.
In essence, the Inspector in Safari transcends its role as a mere debugging tool, evolving into a comprehensive suite of features that cater to the diverse needs of web developers, designers, and enthusiasts. By mastering the capabilities of the Inspector, users can navigate the intricate realm of web development and design with confidence, creativity, and precision, ultimately enhancing the quality and user experience of web content across the digital landscape.
Leave a Reply Cancel reply
Your email address will not be published. Required fields are marked *
Save my name, email, and website in this browser for the next time I comment.
- Crowdfunding
- Cryptocurrency
- Digital Banking
- Digital Payments
- Investments
- Console Gaming
- Mobile Gaming
- VR/AR Gaming
- Gadget Usage
- Gaming Tips
- Online Safety
- Software Tutorials
- Tech Setup & Troubleshooting
- Buyer’s Guides
- Comparative Analysis
- Gadget Reviews
- Service Reviews
- Software Reviews
- Mobile Devices
- PCs & Laptops
- Smart Home Gadgets
- Content Creation Tools
- Digital Photography
- Video & Music Streaming
- Online Security
- Online Services
- Web Hosting
- WiFi & Ethernet
- Browsers & Extensions
- Communication Platforms
- Operating Systems
- Productivity Tools
- AI & Machine Learning
- Cybersecurity
- Emerging Tech
- IoT & Smart Devices
- Virtual & Augmented Reality
- Latest News
- AI Developments
- Fintech Updates
- Gaming News
- New Product Launches
Learn To Convert Scanned Documents Into Editable Text With OCR
Top mini split air conditioner for summer, related post, comfortable and luxurious family life | zero gravity massage chair, when are the halo awards 2024, what is the best halo hair extension, 5 best elegoo mars 3d printer for 2024, 11 amazing flashforge 3d printer creator pro for 2024, 5 amazing formlabs form 2 3d printer for 2024, related posts.

How To Inspect In Safari On IPad

How To Inspect On IPhone Safari

How To Get Developer Tools In Safari

How To Inspect Page On Safari

How To Open Developer Tools In Safari

How To Enable Inspect In Safari

What Is Web Inspector In Safari

How To View Page Source On Safari
Recent stories.

Fintechs and Traditional Banks: Navigating the Future of Financial Services

AI Writing: How It’s Changing the Way We Create Content

How to Find the Best Midjourney Alternative in 2024: A Guide to AI Anime Generators

How to Know When it’s the Right Time to Buy Bitcoin

Unleashing Young Geniuses: How Lingokids Makes Learning a Blast!
- Privacy Overview
- Strictly Necessary Cookies
This website uses cookies so that we can provide you with the best user experience possible. Cookie information is stored in your browser and performs functions such as recognising you when you return to our website and helping our team to understand which sections of the website you find most interesting and useful.
Strictly Necessary Cookie should be enabled at all times so that we can save your preferences for cookie settings.
If you disable this cookie, we will not be able to save your preferences. This means that every time you visit this website you will need to enable or disable cookies again.
How to use Safari Web Inspector on Mac, iPad, and iPhone
If you’re a web developer, then you likely already know about Safari’s Web Inspector. But if you’re just starting to use Safari for development or have just begun your Web Development career, this guide will show you the basics for getting started with the Safari Web Inspector on iOS and Mac.

What is the Safari Web Inspector?
For those not yet familiar with the tool, you can use the Safari Web Inspector for help with your web development. It allows you to review page elements, make changes, troubleshoot problems, and review page performance. Apple sums it up with:
Web Inspector is the primary web development tool in Safari. Web Inspector allows you to inspect, tweak, debug, and analyze the performance of your web content in a Safari tab.
Enable and open Safari Web Inspector
You can use the Safari Web Inspector for development on your iPhone, iPad, or Mac. Here’s how to enable and open it on iOS and macOS so you’re ready to use it when you need it.
If you’re going to use the Web Inspector frequently, whether for iOS or Mac, you might as well add the Develop tab to your menu bar so you can access it easily.
- Open Safari on your computer and click Safari > Settings or Preferences from the menu bar.
- Choose the Advanced tab.
- Check the box at the bottom for “ Show features for web developers ” or Show Develop menu in menu bar .

Now when you want to enable the Web Inspector, click Develop > Show Web Inspector from your menu bar.

If you prefer to forgo adding the Develop button to your menu bar, you can access the Web Inspector on Mac with a shortcut. Navigate to the page you want to inspect, right-click on it, and pick Inspect Element from the context menu.

Just keep in mind that if you plan to use Web Inspector for Safari on your iOS device, you’ll need the Develop button in the menu bar on your Mac.
For iPhone and iPad
To use the Web Inspector for iOS on your Mac, grab your USB cable and connect your iPhone or iPad to your computer. Then, follow these steps to enable the tool:
- Open the Settings app on your iPhone or iPad and tap Safari .
- Scroll to the bottom and tap Advanced .
- Enable the toggle for Web Inspector .

Next, make sure Safari is open on your iOS device and your Mac. After that, follow these steps:
1) Click Develop from the Safari menu bar on Mac, and you’ll see your iPhone or iPad listed here.

2) Mouse over the device, and you’ll then see the websites open in Safari on your mobile device.
3) Select the one you want, and the Web Inspector will pop open in a new window for you to use.

Note: If this is the first time you’re using your iPhone or iPad for this work, take your mouse cursor over that iPhone or iPad and click Use for Development . Next, tap Trust on your iPhone or iPad and enter the device passcode. Now, this iOS or iPadOS device is ready to be used for web inspection. If it still shows a correction error, simply unplug the USB cable and plug it in again.

Position the Safari Web Inspector
If you’re using the Web Inspector for iOS, it will remain in its own floating window.
If you’re using it for Safari on your Mac, you can change its position. By default, Web Inspector displays at the bottom of your Safari window. To detach it and place it in a separate window or dock it to the left or right side of Safari, select one of the buttons from the top left of the Inspector window.

Get to know the Web Inspector
The Safari Web Inspector has a handy toolbar and tabs with some options that you can adjust to fit your needs.
Web Inspector toolbar
- “X” to close the Inspector
- Positioning buttons
- Reload button
- Download web archive button
- Activity viewer (resource count, resource size, load time, logs, errors, warnings)
- Element selector button
Web Inspector tabs
You can use all tabs or just a few. You can right-click or hold Control and click the tabs and then check and uncheck those you want to see. Rearrange the tabs by holding and dragging them to their new positions. And all the way to the right of the tabs bar, you’ll see a Settings button. This lets you adjust settings for tabs, indents, source maps, zoom, and more.

- Elements : Current state of the page’s Document Object Model
- Network : Resources loaded by the current page
- Debugger : View the JavaScript execution, variables, and control flow
- Resources : Resources being used by the current page’s content
- Timelines : A view of what the page’s content is doing
- Storage : State that is available to the page’s content
- Canvas : Contexts created from CSS
- Console : Shows logged messages and lets you evaluate JavaScript code
For in-depth help on a specific tab, you can head to the Apple Developer Support site . Select Table of Contents > Get started in Safari Developer Tools > Web Inspector .

Good luck with your inspection!
Hopefully, this guide will help you as you start working with the Safari Web Inspector for your iPhone, iPad, or Mac web development.
If you currently use the Web Inspector and have tips and tricks you’d like to share with others who are just starting, please feel free to comment below!
Check out next: How to view the source code of a webpage in Safari
- Is Hulu Worth It?
- iPad Pro vs. Surface Pro: What's the Difference?
How to Activate and Use Responsive Design Mode in Safari
Access developer tools in Apple's web browser
:max_bytes(150000):strip_icc():format(webp)/ScottOrgera-f7aca23cc84a4ea9a3f9e2ebd93bd690.jpg "safari inspect device size")
What to Know
- To enable: Preferences > select Advanced tab > toggle Show Develop menu in menu bar on.
- To use: select Develop > Enter Responsive Design Mode in Safari toolbar.
This article explains how to enable Responsive Design Mode in Safari 9 through Safari 13, in OS X El Capitan through macOS Catalina.
How to Enable Responsive Design Mode in Safari
To enable the Safari Responsive Design Mode, along with other Safari developer tools:
Go to the Safari menu and select Preferences .
Press the keyboard shortcut Command + , (comma) to access Preferences quickly.
In the Preferences dialog box, select the Advanced tab.
At the bottom of the dialog box, select the Show Develop menu in menu bar check box.
You'll now see Develop in the top Safari menu bar.
Select Develop > Enter Responsive Design Mode in the Safari toolbar.
Press the keyboard shortcut Option + Command + R to enter Responsive Design Mode quickly.
The active web page displays in Responsive Design Mode. At the top of the page, choose an iOS device or a screen resolution to see how the page will render.
Alternatively, see how your web page will render in various platforms by using the drop-down menu above the resolution icons.
Safari Developer Tools
In addition to Responsive Design Mode, the Safari Develop menu offers other useful options.
Open Page With
Opens the active web page in any browser currently installed on the Mac.
When you change the User Agent, you can fool a website into thinking you're using another browser.
Show Web Inspector
Displays all a web page's resources, including CSS information and DOM metrics.
Show Error Console
Displays JavaScript , HTML, and XML errors and warnings.
Show Page Source
Lets you view the source code for the active web page and search the page contents.
Show Page Resources
Displays documents, scripts, CSS, and other resources from the current page.
Show Snippet Editor
Lets you edit and execute fragments of code. This feature is useful from a testing perspective.
Show Extension Builder
Helps you build Safari extensions by packaging your code accordingly and appending metadata.
Start Timeline Recording
Lets you record network requests, JavaScript execution, page rendering, and other events within the WebKit Inspector.
Empty Caches
Deletes all stored caches within Safari, not only the standard website cache files.
Disable Caches
With caching disabled, resources are downloaded from a website each time an access request is made as opposed to using the local cache.
Allow JavaScript from Smart Search Field
Disabled by default for security reasons, this feature allows you to enter URLs containing JavaScript into the Safari address bar.
Get the Latest Tech News Delivered Every Day
- Add More Features by Turning on Safari's Develop Menu
- How to Reset Safari to Default Settings
- How to Activate the iPhone Debug Console or Web Inspector
- How to View Internet Explorer Sites on a Mac
- How to Use Web Browser Developer Tools
- Speed Up Safari With These Tuneup Tips
- How to View HTML Source in Safari
- How to Change the Default Search Engine in Chrome for iOS
- What Is Safari?
- How to Enable Safari's Debug Menu to Gain Added Capabilities
- How to Manage Cookies in the Safari Browser
- How to Use Reading Mode on an iPhone or iPad
- How to Inspect an Element on a Mac
- How to Modify Text Size in the Safari Browser on a Mac
- Keyboard Shortcuts for Safari on macOS
- How to Disable JavaScript in Safari for iPhone
- Meta Quest 4
- Google Pixel 9
- Google Pixel 8a
- Apple Vision Pro 2
- Nintendo Switch 2
- Samsung Galaxy Ring
- Yellowstone Season 6
- Recall an Email in Outlook
- Stranger Things Season 5
How to use Inspect Element on Mac using the Safari browser
If you’re just getting started as a front-end developer or need to debug errors while testing web applications, Safari is likely in your list of browsers to check for compatibility. With this comes the need for a tool called Inspect Element.
Enable Inspect Element for Safari on Mac
Open inspect element in safari, how to use inspect element on mac.
Going beyond just checking the source code of a page, Inspect Element lets you view everything going on behind the scenes of a webpage. You can see the HTML, style sheets, media, and other elements, all in one spot. Here’s how to use Inspect Element on Mac.
What You Need
Mac computer
Safari browser
Before you can use the Inspect Element tool on Mac, you need to enable it in Safari.
Step 1: Open Safari and click Safari > Preferences from the menu bar.
Step 2: Select the Advanced tab.
- 5 web browsers you should use instead of Google Chrome or Edge
- How to find a Wi-Fi password on Mac
- How to take a screenshot on a Mac
Step 3: Check the box for Show Develop menu in menu bar .
Inspect Element is now available and ready for you to use in Safari on Mac .
With the tool enabled. you can access it a couple of different ways. If you want to look at a particular element on the page, you can select it first. Otherwise, you can simply open Inspect Element and select it from there.
Either click Develop > Show Web Inspector from the menu bar or right-click the page and pick Inspect Element from the shortcut menu.
Once you open Inspect Element, you’ll have all the tools you need to review every item on the webpage. And there are a lot of tools at your fingertips. Let’s take a look at the basics of using Inspect Element.
Step 1: Move and resize Inspect Element.
You can dock the tool at the bottom or on the side of the page or pop it out to a separate window. Use the icons on the top left of the inspector toolbar to move it where you want. If you dock the tool, you can drag the border to increase or decrease its size.
Step 2: Customize the tabs.
Inspect Element provides nine tabs for you to work with across the top of the toolbar. These include Elements, Storage, Layers, and Timelines. You can hide those you don’t need if you like. Right-click a tab and then select the ones you want to see. This places checkmarks next to them and puts the tabs in the toolbar.
Step 3: Inspect an element.
To select items on the page to display in the tool, click the compass icon in the toolbar. Then, drag through or click the element on the page. You can also select the code or item in the tool for that element to display on the page.
Step 4: Search for an element.
If you want to find a specific item on the page such as a text string, click the search icon on the right of the toolbar. Enter your search term into the box on the left and view your results directly beneath.
Step 5: View warnings or errors.
If the tool detects warnings or errors on the page, you’ll see these icons display in the toolbar as well. Click an icon to view either the warnings or errors.
Step 6: Adjust the settings.
To change the appearance of Inspect Element, show page rulers, enable source maps, zoom, and more, click the gear icon on the far right of the toolbar to open the Inspect Element settings.
When you finish using Inspect Element in Safari, click the X on the top left of the toolbar to close it.
You can take your code inspection, application testing , or debugging to the next level with Inspect Element on Mac for Safari.
Editors' Recommendations
- How to change your MAC address on Windows and Mac
- How to convert FLAC to MP3 on Mac, Windows, and web
- How to forget a network on a Mac
- How to add and use text replacements on Mac
- How to convert HEIC files to JPEG on a Mac
- How-To Guides

If you want to have a bit of music playing in the background or want to have your favorite YouTube video running in the corner of your screen, then the picture-in-picture YouTube feature needs to be on your radar. This allows you to turn your YouTube videos into a tiny pop-up window that can be moved and repositioned around your screen.
Mac users have several ways to activate the feature, including support on both Safari and Google Chrome. There's also a nifty Chrome extension that simplifies the task to a single button press. Here's a look at how to enable picture-in-picture for YouTube on your Mac.
A stocked computer cache may be convenient for logging into and out of go-to sites in seconds flat, but a major buildup of these tracking codes could significantly impact your PC’s performance. If you’ve noticed that your PC has been running rather slow of late, or you’re using a new browser and don’t know how to clear its cache, we’ve got you covered with the following guide.
Not everyone builds their home office around video calls. And if your home office also doubles as your bedroom, kitchen, or is tucked away in a cluttered corner of your basement, you'll be glad to know that Zoom lets you hide your surroundings from your co-workers. One way the software does this is by letting you change your Zoom background, allowing others in the chat to see you while swapping out your environment for something more professional.
Want to make use of the cool feature? In this guide, we'll go over how to change your Zoom background using both built-in images and custom images uploaded by the user. We also cover how to blur your Zoom background, in case you want something a bit more low-key, along with how to add filters for something more fun. Step 1: Access your Zoom settings
- Apple Watch
- Accessories
- Digital Magazine – Subscribe
- Digital Magazine – Info
- Smart Answers
- Let Loose iPad event
- New iPad Air
- iPad mini 7
- Best Mac antivirus
- Best Mac VPN
When you purchase through links in our articles, we may earn a small commission. This doesn't affect our editorial independence .
Safari to get an AI boost in iOS 18, macOS 15 with smarter search, web page ‘eraser’

Much of the noise being made about Apple’s efforts into AI has been focused on general improvements to iOS 18 and Siri as well as the upcoming M4 chip for the Mac. However, as we get closer to WWDC, more reports about the AI software that Apple will create are coming out, with the most recent one covering Apple’s efforts to enhance the next major version of Safari.
AppleInsider reports that the company is working on a new “Intelligent Search” feature that uses on-device AI to summarize a web page. The language learning model that Apple has developed can identify key phrases and topics that give an idea of what a web page’s content is about and create a summary for the user.
Other features that Apple is working on include:
- A Web Eraser that gives users the option to remove parts of a web page. This includes ads, text, and images. Safari will remember the parts that have been removed when the page is closed, and if the page is revisited, Safari alerts the user that the page has been modified.
- A new page controls menu that appears in the address bar. This menu essentially collects user controls that are spread throughout Safari (text size, zoom, Reader mode, Privacy Report, and more).
- An AI enhancement to Visual Lookup that gives users product information. This feature could also be implemented system-wide, not just in Safari.
Apple plans to implement the new Safari 18 features in both iOS 18 and macOS 15, which will be announced at WWDC24 on June 10. The report claims some features, such as the AI Visual Lookup, may not be available until 2025. That tracks with previous rumors that have suggested AI features will be rolled out in waves. AppleInsider also reported recently on Apple’s plans to update the Notes and Calculator apps.
For the latest news and rumors, check out our iOS 18 and macOS 15 superguides. And learn more about WWDC24 in June.
Author: Roman Loyola , Senior Editor

Roman has covered technology since the early 1990s. His career started at MacUser, and he's worked for MacAddict, Mac|Life, and TechTV.
Recent stories by Roman Loyola:
- Apple’s M3 chip is a victim of the times
- macOS 15: Everything you need to know about the next big Mac update
- If your iPhone alarm stopped working in iOS 17.4.1, here’s a fix
IMAGES
VIDEO
COMMENTS
Method 2: Using Web Inspector for Debugging on Safari. Furthermore, developers can leverage the Web Inspector to inspect any particular element and debug a specific issue for a specific screen size. One can find the web inspector in the Develop menu. Once the web inspector is active, inspect a particular element using the element selector.
Enabling inspecting your device from a connected Mac. Before you can connect your device to a Mac to inspect it, you must allow the device to be inspected. Open the Settings app. Go to Safari. Scroll down to Advanced. Enable the Web Inspector toggle. Now, connect the device to your Mac using a cable. In Safari, the device will appear in the ...
229. In your Safari menu bar click Safari > Preferences & then select the Advanced tab. Select: "Show Develop menu in menu bar". Now you can click Develop in your menu bar and choose Show Web Inspector. See the detailed guide here for more info: LINK. You can also right-click and press "Inspect element". EDIT As suggested by @dennis in the ...
Apple has brought its expertise in development tools to the web. Safari includes Web Inspector, a powerful tool that makes it easy to modify, debug, and optimize websites for peak performance and compatibility on both platforms. And with Responsive Design Mode, you can preview your web pages in various screen sizes, orientations, and resolutions.
Overview. Web Inspector helps you inspect all the resources and activity on webpages, Service Workers, Mac and Home Screen web apps, and JavaScript running inside your applications, making development more efficient across Apple platforms. The clean, unified design puts each core function in a separate tab, which you can rearrange to fit your ...
Enable Web Inspector on iOS : Open the Settings app on your iPhone or iPad. Scroll down and tap Safari. Scroll to the bottom of the page and tap Advanced. Tap the toggle next to Web Inspector to the On position. Enable Safari Developer Mode on Mac : Open Safari on your Mac. Click Safari in the top left corner of your Menu Bar.
Click on Safari -> Preferences -> Advanced. Select the checkbox -> Show Develop menu in menu bar. Once the Develop menu is enabled, it'll show up in the menu bar as shown in the image below: Also learn: How to remotely debug on iOS and Mac Safari. Now follow the steps below to view the mobile version of a web page using Safari DevTools ...
Close the window. On your IOS Device, go to Settings > Safari > Advanced. Press the toggle for Web Inspector. Connect your device to your Mac using a USB cable, or try the following over Wifi. On ...
Here are the simple steps to follow whether you're testing or debugging an iOS Safari web page or app with Inspect: Connect your iOS device to your PC via USB cable or Wi-Fi. You can use any device with a macOS, Linux, or Windows operating system. Start Inspect and follow the instructions on how to setup your computer. You are good to go!
Using the mobile device, navigate to a page or application you want to inspect. Next, shift over to your computer. With Safari open, select the Develop menu in the menu bar. Toward the top of that list, you should see your device's name and the windows that are available to inspect. Select the page or application to inspect, and the ...
In Safari, there are two ways to begin inspecting a webpage. The first is via the Develop menu. With the webpage you wish to inspect frontmost in Safari, go to the Develop menu and choose Show Web Inspector (⌥⌘I). Web Inspector will then appear, and will be inspecting the webpage. The second was to show Web Inspector is to right click on ...
I have once seen safari showing me the pixel dimensions of the browser window, even when I resized it dragging left or right, it showed how many pixels in the x axis and how many pixels in the y axis. But now when I resize the window it doesn't show the number of pixels of any current size.
To inspect elements on iPhone with Safari developer tools, follow these steps: On an iPhone, open the Settings and tap Safari. Scroll down and tap Advanced . On the next screen, toggle on Web Inspector . On your Mac device, open the Safari browser. Click Safari in the menu bar and select Preferences.
Keyboard Shortcuts. For those who prefer to streamline their workflow with keyboard shortcuts, Safari offers a quick and efficient way to open the Inspector. By pressing "Option + Command + I" on a Mac, or "Ctrl + Option + I" on a Windows PC, you can instantly access the Inspector, saving valuable time and effort.
1. I recently upgraded to latest Safari 14.1.1 and the device inspector dev tools have stopped working. When selecting a target through the Develop menu, the inspector window pops up but is unusable and many of the inspector tabs are disabled. The device I'm inspecting is running latest iOS.
It can be beneficial both for the app developer, as well as web authors, to be able to inspect content in these views, as the size of the view may not match that of Safari's, or the app developer may be injecting script into the view to provide integration with their app. Web content is often dynamic, delivered by a server—not in the app ...
1) Click Develop from the Safari menu bar on Mac, and you'll see your iPhone or iPad listed here. 2) Mouse over the device, and you'll then see the websites open in Safari on your mobile device. 3) Select the one you want, and the Web Inspector will pop open in a new window for you to use. Note: If this is the first time you're using your ...
Select Develop > Enter Responsive Design Mode in the Safari toolbar. Press the keyboard shortcut Option + Command + R to enter Responsive Design Mode quickly. The active web page displays in Responsive Design Mode. At the top of the page, choose an iOS device or a screen resolution to see how the page will render.
Step 1: Open Safari and click Safari > Preferences from the menu bar. Step 2: Select the Advanced tab. Step 3: Check the box for Show Develop menu in menu bar. Inspect Element is now available and ...
Safari provides Web Inspector, a set of tools that web developers use to inspect and debug their webpages. These built-in development tools are useful for analyzing basic issues in HTML, CSS, and JavaScript. In Safari 16 or later, you can create a custom web development tool that can inspect and interact with a webpage in a target window.
Apple plans to implement the new Safari 18 features in both iOS 18 and macOS 15, which will be announced at WWDC24 on June 10. The report claims some features, such as the AI Visual Lookup, may ...
Size. The current effective size of the viewport, in screen points. You can click on the width or height to begin editing the specific dimension. You can also grab the handles on the left, bottom, and right sides of the viewport to quickly resize to any dimension, or grab one of the bottom corners to resize in both dimensions simultaneously. Zoom