Join TheConstructor to ask questions, answer questions, write articles, and connect with other people. When you join you get additional benefits.
Confirm Password *
First Name *
Last Name *
Country Select a country… Åland Islands Afghanistan Albania Algeria Andorra Angola Anguilla Antarctica Antigua and Barbuda Argentina Armenia Aruba Australia Austria Azerbaijan Bahamas Bahrain Bangladesh Barbados Belarus Belau Belgium Belize Benin Bermuda Bhutan Bolivia Bonaire, Saint Eustatius and Saba Bosnia and Herzegovina Botswana Bouvet Island Brazil British Indian Ocean Territory British Virgin Islands Brunei Bulgaria Burkina Faso Burundi Cambodia Cameroon Canada Cape Verde Cayman Islands Central African Republic Chad Chile China Christmas Island Cocos (Keeling) Islands Colombia Comoros Congo (Brazzaville) Congo (Kinshasa) Cook Islands Costa Rica Croatia Cuba CuraÇao Cyprus Czech Republic Denmark Djibouti Dominica Dominican Republic Ecuador Egypt El Salvador Equatorial Guinea Eritrea Estonia Ethiopia Falkland Islands Faroe Islands Fiji Finland France French Guiana French Polynesia French Southern Territories Gabon Gambia Georgia Germany Ghana Gibraltar Greece Greenland Grenada Guadeloupe Guatemala Guernsey Guinea Guinea-Bissau Guyana Haiti Heard Island and McDonald Islands Honduras Hong Kong Hungary Iceland India Indonesia Iran Iraq Isle of Man Israel Italy Ivory Coast Jamaica Japan Jersey Jordan Kazakhstan Kenya Kiribati Kuwait Kyrgyzstan Laos Latvia Lebanon Lesotho Liberia Libya Liechtenstein Lithuania Luxembourg Macao S.A.R., China Macedonia Madagascar Malawi Malaysia Maldives Mali Malta Marshall Islands Martinique Mauritania Mauritius Mayotte Mexico Micronesia Moldova Monaco Mongolia Montenegro Montserrat Morocco Mozambique Myanmar Namibia Nauru Nepal Netherlands Netherlands Antilles New Caledonia New Zealand Nicaragua Niger Nigeria Niue Norfolk Island North Korea Norway Oman Pakistan Palestinian Territory Panama Papua New Guinea Paraguay Peru Philippines Pitcairn Poland Portugal Qatar Republic of Ireland Reunion Romania Russia Rwanda São Tomé and Príncipe Saint Barthélemy Saint Helena Saint Kitts and Nevis Saint Lucia Saint Martin (Dutch part) Saint Martin (French part) Saint Pierre and Miquelon Saint Vincent and the Grenadines San Marino Saudi Arabia Senegal Serbia Seychelles Sierra Leone Singapore Slovakia Slovenia Solomon Islands Somalia South Africa South Georgia/Sandwich Islands South Korea South Sudan Spain Sri Lanka Sudan Suriname Svalbard and Jan Mayen Swaziland Sweden Switzerland Syria Taiwan Tajikistan Tanzania Thailand Timor-Leste Togo Tokelau Tonga Trinidad and Tobago Tunisia Turkey Turkmenistan Turks and Caicos Islands Tuvalu Uganda Ukraine United Arab Emirates United Kingdom (UK) United States (US) Uruguay Uzbekistan Vanuatu Vatican Venezuela Vietnam Wallis and Futuna Western Sahara Western Samoa Yemen Zambia Zimbabwe
By registering, you agree to the Terms of Service and Privacy Policy . *
Log in to TheConstructor to ask questions, answer people’s questions, write articles & connect with other people. When you join you get additional benefits.

Join for free or log in to continue reading...
Username or email *
Forgot Password
Lost your password? Please enter your email address. You will receive a link and will create a new password via email.
Sorry, you do not have permission to ask a question, You must log in to ask a question. Join now!
The Constructor
6 types of road patterns.
Do you need to remove the ads? Join now!
🕑 Reading time: 1 minute
When a road is constructed in a rectangular, radial, hexagonal, or any other pattern for proper traffic management, it is called a road pattern.
Roadway patterns are essential for developing a city's settlements. Current urban development does not analyze road designs before construction which leads to several interconnected roadways, housing projects, and commercial developments built far from town centers.
Because of the increasing distances between the city's residential and business hubs, an increasing number of people are forced to rely on vehicles to make their daily commute. The primary goal of executing road patterns is to shorten travel time, reduce pollution, and distance for vehicles. It also emphasizes how the branch roads are connected.
Types of Road Patterns
- Rectangular or block pattern
- Radial or star and block pattern
- Radial or star and circular pattern
- Radial or star and grid pattern
- Hexagonal pattern
- Minimum travel pattern
- Grid pattern
- Linear pattern
1. Rectangular or Block Pattern
In this type of road pattern, the complete area is divided into a rectangle or block-shaped plots to create a rectangle or block pattern. Streets and roads in block patterns intersect at a 90° (right angle).
Other branch roads may be slightly narrow, but the main road that goes through the center of the area should be sufficiently wide. The rectangle or block design provides a nice view when seen from a height.

Benefits of Block or Rectangular Pattern
- To construct back-to-back buildings with front-facing roadways, the rectangular plots may be further divided into smaller rectangular blocks.
- The city roadways have adopted this pattern.
- Construction and maintenance of highways using this design are relatively simpler.
Drawbacks of Block or Rectangular Patterns
- This pattern is inconvenient since the roads are perpendicular at junctions, causing the traffic to converge towards a single point.
2. Radial Road Pattern
In this road pattern, the network of roadways is constructed in the shape of a circle that radiates away from the center of the area.
This pattern is divided into three types based on its layout.
2.1 Radial or Star & Block Pattern
This type of road network combines radial and block road patterns. The whole area is arranged into a block-pattern road network that runs between the radial main streets and radiates outward from the center.

Benefits of Radial or Star & Block Patterns
- Safer when compared to a rectangular pattern.
- It reduces congestion at the main bottleneck point.
- If one radial route is closed, another may be utilized as an alternative.
Drawbacks of Radial or Star & Block Pattern
- Lack of safety equipment such as post-support bases, crash attenuators, and rail transitions.
- It is only effective when the downstream end of a two-lane ramp does not need a merging.
2.2 Radial or Star & Circular Pattern
This network is a combination of radial and circular road patterns. It is a road pattern in which the major roadways, or radial roads, radiate outward from the center and are joined by the ring roads, or concentric roads, which likewise radiate outward.

Benefits of Radial or Star & Circle Pattern
- Compared to the abovementioned patterns, it is safer since all the traffic moves in the same direction.
- This traffic plan includes roundabouts, which enhances traffic flow. Additionally, this lowers the vehicle's fuel consumption.
- Lowers the chances of rear-end collisions.
Drawbacks of Radial or Star & Circle Pattern
- Its design is complex, and it isn't easy to provide a decent curve.
- It impacts driving abilities (most drivers experiencing this issue are senior citizens).
- The appropriate installation of traffic signals, road markings, and illumination is required to alert the driver.
- Splitter islands must be made long enough to include a crosswalk and a roundabout description.
2.3 Radial or Star & Grid Pattern
This kind of road network combines radial and grid patterns. From the center, a radial network of roads radiates outward. The grid pattern is then used to interconnect the main radial streets.

Benefits of Grid and Star and Radial Pattern
- It increases the effectiveness of land usage unit density.
- Using Savannah's cellular structure improves traffic flow in both directions.
- It has a high percentage of 3-way intersections, offering great vehicle traffic safety.
- Cut-through traffic is reduced.
Drawbacks of Grid and Star and Radial Pattern
- There should be sufficient distance between splitter islands.
- High construction cost for additional traffic lights and road markings.
3. Hexagonal Road Pattern
A hexagonal pattern is a network of roadways that form a hexagonal shape, similar to a circular road pattern. Three roads intersect with the constructed region at each corner of the hexagon. A hexagonal boundary is further split into plots of the appropriate sizes.

Benefits of Hexagonal Road Pattern
- Travel time and distance are cut down.
- Reduced traffic congestion
Drawbacks of Hexagonal Road Pattern
- There should be enough traffic signs, pavement markings, and illumination to alert vehicles to lower their travel speed and minimize the risk of accidents.
4. Minimum Travel Pattern
The town is served by sector centers, suburban facilities, and neighborhood centers in this road plan, all of which are connected to the city center by a highway that can be reached in the shortest amount of time. Also, the shortest roads interconnect the city center with neighboring and suburban centers. The alignment of the road is made straight to shorten it.
Benefits of a Minimum Travel Pattern
- The potentially dangerous collisions are almost eliminated.
Drawbacks of the Minimum Travel Pattern
- The right amount of traffic signs, pavement markings, and illumination should be in place to alert vehicles to slow down.
- For senior drivers, intersections may be particularly difficult.
5. Grid Pattern
A network of intersecting parallel lines, real or imaginary, is referred to as a grid. When seen from above, this pattern is made up of streets that connect at right angles to form squares. A physical network not always constructed of straight or parallel lines may also be called a grid.
Regular grid systems often have greater infrastructure costs than those with disjointed street patterns.

Street width, street length, block width, and pavement width are the four main factors that affect street costs.
Benefits of a Grid Pattern
- Grids benefit pedestrians since there are several routes from point A to point B.
- Grids benefit restaurants and retail establishments since they provide several corner lots.
- A grid's navigation is quite simple.
Drawbacks of Grid Pattern
- Grids are dangerous for motorists and bicycles because they contain numerous junctions and many potential conflict places.
- Grids may encourage individuals to take shortcuts through residential areas.
- Grids don't work well in places with many hills since they result in unnecessarily steep streets.
- Traffic mayhem may readily occur on a grid that is uneven or unfinished.
6. Linear Pattern
It comprises a road that expands linearly in one direction, potentially due to certain natural resources like the sea or ocean existing on one side of the city.

Benefits of a Linear Pattern
Drawbacks of the linear pattern.
- The right amount of traffic signs, pavement markings, speed breakers, and illumination should be in place to alert vehicles to slow down.
The different types of road patterns are: 1. Rectangular or block pattern 2. Radial pattern a. Radial or star and block pattern b. Radial or star and circular pattern c. Radial or star and grid pattern 3. Hexagonal pattern 4. Minimum travel pattern 5. Grid pattern 6. Linear pattern
1. Grids benefit pedestrians since there are several routes from point A to point B. 2. Grids benefit restaurants and retail establishments since they provide several corner lots. 3. A grid's navigation is quite simple.
1. To construct back-to-back buildings with front-facing roadways, the rectangular plots may be further divided into smaller rectangular blocks. 2. The city roadways have adopted this pattern. 3. Construction and maintenance of highways using this design are relatively simpler.
How to Divert Traffic during Road Construction?
Solar Roadways: Purpose, Construction, and Applications
Road Studs – Types, Requirement, and Placement

Fasi Ur Rahman
Related posts.

What is Intelligent Transportation System? Its Working and Advantages

The Road Printer: A Futuristic Approach To Highway Construction
Suggestions or feedback?
MIT News | Massachusetts Institute of Technology
- Machine learning
- Social justice
- Black holes
- Classes and programs
Departments
- Aeronautics and Astronautics
- Brain and Cognitive Sciences
- Architecture
- Political Science
- Mechanical Engineering
Centers, Labs, & Programs
- Abdul Latif Jameel Poverty Action Lab (J-PAL)
- Picower Institute for Learning and Memory
- Lincoln Laboratory
- School of Architecture + Planning
- School of Engineering
- School of Humanities, Arts, and Social Sciences
- Sloan School of Management
- School of Science
- MIT Schwarzman College of Computing
Study reveals a universal travel pattern across four continents
Press contact :, media download.

*Terms of Use:
Images for download on the MIT News office website are made available to non-commercial entities, press and the general public under a Creative Commons Attribution Non-Commercial No Derivatives license . You may not alter the images provided, other than to crop them to size. A credit line must be used when reproducing images; if one is not provided below, credit the images to "MIT."

Previous image Next image
What explains how often people travel to a particular place? Your intuition might suggest that distance is a key factor, but empirical evidence can help urban studies researchers answer the question more definitively.
A new paper by an MIT team, drawing on global data, finds that people visit places more frequently when they have to travel shorter distances to get there.
“What we have found is that there is a very clear inverse relationship between how far you go and how frequently you go there,” says Paolo Santi, a research scientist at the Senseable City Lab at MIT and a co-author of the new paper. “You only seldom go to faraway places, and usually you tend to visit places close to you more often. It tells us how we organize our lives.”
By examining cellphone data on four continents, the researchers were able to arrive at a distinctive new finding in the urban studies literature.
“We might shop every day at a bakery a few hundred meters away, but we’ll only go once a month to the fancy boutique miles away from our neighborhood. This kind of intuitive notion had never been empirically tested. When we did it we found an incredibly regular and robust law — which we have called the visitation law,” says Carlo Ratti, a co-author of the paper and director of the Senseable City Lab, which led the research project.
The paper, “The universal visitation law of human mobility,” is published today in Nature .
The paper is co-authored by Markus Schläpfer, a scholar in the Urban Complexity Project at the ETH Future Cities Lab in Singapore; Lei Dong, a researcher at Peking University in Beijing; Kevin O’Keeffe, a postdoc at the MIT Senseable City Lab; Santi, a research director at Istituto di Informatica e Telematica, CNR (the National Research Council of Italy); Michael Szell, an associate professor in Data Science at IT University of Copenhagen; Hadrien Salat of the Future Cities Laboratory, Singapore-ETH Centre; Samuel Anklesaria, a researcher at the MIT Senseable City Lab; Mohammad Vazifeh, a senior postdoc at the MIT Senseable City Lab; Ratti; and Geoffrey West, a professor at and former president of the Santa Fe Institute. Schläpfer, Dong, Santi, and Szell are also former members of the Senseable City Lab.
To conduct the study, the researchers used anonymized cellphone data from large communications providers to track the movement of people in the metro areas of Abidjan, Ivory Coast; Boston; Braga, Lisbon, and Porto, Portugal; Dakar, Senegal; and Singapore.
Cellphone data are ideal for this kind of study because they establish both the residence area of people and the destinations they travel to. In some cases, the researchers defined areas visited by using grid spaces as small as 500 square meters. Overall, the researchers charted over 8 billion location-indicating pieces of data generated by over 4 million people, charting movement for a period of months in each location.
And, in each case, from city to city, the same “inverse law” of visitation held up, with the charted data following a similar pattern: The frequency of visits declined over longer distances, and higher-density areas were filled with people who had, on aggregate, taken shorter trips. To the extent that there was some variation from this pattern, the largest deviations involved sites with atypical functions, such as ports and theme parks.
The paper itself both measures the data and presents a model of movement, in which people seek out the closest locations that offer particular kinds of activity. Both of those buttress “central place theory,” an idea developed in the 1930s by German scholar Walter Christaller, which seeks to describe the location of cities and towns in terms of the functions they offer to people in a region.
The scholars note that the similarity in movement observed in very different urban areas helps reinforce the overall finding.
“This generalized behavior is not just something you observe in Boston,” Santi says. “From a scientific viewpoint, we are adding evidence about a generalized pattern of behavior.”
The researchers also hope the finding, and the methods behind it, can be usefully applied to urban planning. Santi suggests this type of study can help predict how substantial changes in the physical layout of a city will affect movement within it. The method also makes it possible to examine how changes in urban geography affect human movement over time.
“The visitation law could have many practical applications — from the design of new infrastructure to urban planning,” adds Ratti. “For instance, it could help implement the concept of the ‘Fifteen-Minute City,’ which aims to reorganize physical space around walkable neighborhoods and which has become very popular during the Covid-19 pandemic. Our law suggests that we can indeed capture a large fraction of all urban trips within a fifteen-minute radius, while leaving the rest — perhaps 10 percent — further away.”
Support for the research was provided by the National Science Foundation, the AT&T Foundation, the Singapore-MIT Alliance for Research and Technology (SMART), the MIT Center for Complex Engineering Systems, Audi Volkswagen, BBVA, Ericsson, Ferrovial, GE, the MIT Senseable City Lab Consortium, the John Templeton Foundation, the Eugene and Clare Thaw Charitable Trust, the U.S. Army Research Office Minerva program, the Singapore National Research Foundation, and the National Natural Science Foundation of China.
Share this news article on:
Press mentions, financial times.
Writing for the Financial Times , Prof. Carlo Ratti explores the concept of the “15-minute city,” which is aimed at creating walkable neighborhoods. “The 15-minute city must be paired with investment in transport between neighborhoods,” writes Ratti, noting that investment is especially needed in public transportation to ensure that 15-minute cities do not contribute to greater segregation.
United Press International (UPI)
UPI reporter Brooks Hays writes that a new study by MIT researchers finds that people tend to follow a predictable travel pattern that remains consistent in countries around the world. The findings could help urban planners “better understand how populations interact with their surroundings, as well as assist city planners with zoning, infrastructure and other development decisions,” writes Hays.
Motherboard
Researchers from the MIT Senseable City Lab have uncovered a new travel pattern in human mobility that remains consistent across four continents, reports Beck Ferreira for Motherboard . “The notion that distance and frequency of visitation are related is in accordance with intuition,” the researchers explain. “What is surprising is that the relationship between these two quantities can be described by a simple and clean mathematical law.”
Previous item Next item
Related Links
- Carlo Ratti
- Paolo Santi
- Senseable City Lab
- Department of Urban Studies and Planning
- School of Architecture and Planning
Related Topics
- Urban studies and planning
- National Science Foundation (NSF)
- Transportation
- Social sciences
Related Articles

Tracking contagion in cities, using mobile phone data

Taking a city’s pulse with moveable sensors

Study: Commuting times stay constant even as distances change
More mit news.

Using art and science to depict the MIT family from 1861 to the present
Read full story →

Convening for cultural change

Q&A: The power of tiny gardens and their role in addressing climate change

In international relations, it’s the message, not the medium

A modest intervention that helps low-income families beat the poverty trap

Understanding why autism symptoms sometimes improve amid fever
- More news on MIT News homepage →
Massachusetts Institute of Technology 77 Massachusetts Avenue, Cambridge, MA, USA
- Map (opens in new window)
- Events (opens in new window)
- People (opens in new window)
- Careers (opens in new window)
- Accessibility
- Social Media Hub
- MIT on Facebook
- MIT on YouTube
- MIT on Instagram
- Search Menu
- Sign in through your institution
- Advance articles
- Collections
- Editor's Choice
- Supplements
- Author Guidelines
- Submission Site
- Open Access
- About Journal of Travel Medicine
- About the International Society of Travel Medicine
- Editorial Board
- Advertising and Corporate Services
- Journals Career Network
- Self-Archiving Policy
- Journals on Oxford Academic
- Books on Oxford Academic

Article Contents
Introduction, latest international trends in tourism, inbound tourism, outbound tourism 6, long-term trends 1.
- < Previous
Global travel patterns: an overview
- Article contents
- Figures & tables
- Supplementary Data
Dirk Glaesser, John Kester, Hanna Paulose, Abbas Alizadeh, Birka Valentin, Global travel patterns: an overview, Journal of Travel Medicine , Volume 24, Issue 4, July-August 2017, tax007, https://doi.org/10.1093/jtm/tax007
- Permissions Icon Permissions
In recent decades, the global tourism market has experienced continual growth and deepening diversification making it one of the world’s fastest growing economic sectors. International tourist arrivals have grown steadily from 25 million in 1950 to a total of 1.186 billion arrivals in 2015. This growth is projected to continue and according to World Tourism Organization (UNWTO) forecasts, international tourist arrivals will increase to 1.8 billion by 2030. 1 In addition to this significant market growth, tourism’s increasing significance can be seen in a variety of relevant international processes, most prominently in the Rio + 20 (The United Nations Conference on Sustainable Development (Rio+20), held in Rio de Janeiro, Brazil in 2012, was the third UN conference on sustainable development aimed at reconciling the economic and environmental goals of the global community. Specifically, in this conference, it was recognized that tourism, if well managed, can make a significant contribution to the three dimensions of sustainable development.), 2 the SENDAI Framework (The Sendai Framework for Disaster Risk Reduction 2015–2030 adopted at the Third United Nations World Conference on Disaster Risk Reduction in Sendai, Japan, 2015, highlighted the need to link approaches in the tourism sector and disaster management.) 3 and the 2030 Agenda for Sustainable Development (The 2030 Agenda for Sustainable Development, also known as Sustainable Development Goals (SDGs), is a set of 17 aspirational Global Goals with 169 targets. Tourism has been recognized in Goals 8, 12 and 14, for its capacity to contribute to achieving the SDGs, namely by fostering economic growth, creating jobs, promoting local culture and accelerating the change to more sustainable consumption and production patterns.) 4 among others underscoring the integral role of tourism in our societies. 1
Tourism encompasses the range of activities that visitors engage in while travelling to and staying in places outside their usual environment for not more than one consecutive year, for any primary purpose—business, leisure or other personal—except to be employed by a resident entity in the country or place visited. 5 Global trends in tourism are expressed in terms of the number of international tourist arrivals in destinations, which quantifies the number of foreign tourists that arrive in a destination and stay for at least one night. 6 2015 marked the sixth consecutive year of above-average 1 growth in international tourism since the global economic crisis in 2009. The number of international tourist arrivals (overnight visitors) in 2015 increased by 4.6% (an additional 52 million international tourists) from the previous year, reaching a total of 1.186 billion globally. By UNWTO region, the Americas and Asia and the Pacific recorded close to 6% growth in international tourist arrivals in 2015, with Europe experiencing 5% growth. In the same period, tourist arrivals in the Middle East (According to UNWTO classification, members of the Middle East region include Bahrain, Egypt, Iraq, Jordan, Kuwait, Lebanon, Libya, Oman, Qatar, Saudi Arabia, Syrian Arab Republic, United Arab Emirates and Yemen.) increased by 2% while in Africa they declined by 3%, primarily due to weak tourist arrivals in North Africa.
UNWTO expects 2016 to be the seventh consecutive year of above-average growth in the tourism sector. The latest tourism barometer published by UNWTO 7 indicates that international tourist arrivals grew by 4% compared with the previous year between January and September 2016 with destinations around the world receiving 956 million international tourists (overnight visitors) during the same period. The highest increase in international arrivals between January and September 2016 was recorded in Asia and the Pacific region, a 9% increase compared with 2015, with a robust growth in all the Asian sub-regions. UNWTO forecasts expect international tourist arrivals to increase by 3.5–4.5% by the end of 2016, which is in line with the Organization’s long-term projection of 3.8% annual growth for the period 2010–2020.
Tourist arrivals can be either international arrivals where tourists travel across international borders, or domestic arrivals where tourists travel within their country. However, to date, availability of reliable data is limited to international arrivals; and hence, this article will focus on international tourist arrivals.

International tourist arrivals and receipts over the years. Source: UNWTO (2016a)
Regional Perspective
International tourist arrivals in advanced and emerging economies
Source : UNWTO (2016a).
Top tourist destinations by international arrival
Source : Data as collected by UNWTO, August 2016.

International tourist arrivals by region. Source : UNWTO (2016a)
Travel Motivations
In 2015, more than half of international tourist arrivals (53% or 632 million) were motivated by holidays, recreation and leisure-related travel. In the same year, business and professional travel accounted for 14% of all international tourist arrivals, and another 27% travelled for other reasons such as visiting friends and relatives (VFR), religious reasons and health treatments. 6 The purpose of travel for the remaining 6% of arrivals was not specified. According to UNWTO forecasts, trends will remain largely stable into 2030, when it is projected that leisure, recreation and holidays will represent 54%, business and professional travel 15%, and VFR, health, religion and other purposes 31% of all international arrivals. 1
In general, the majority of international travel takes place within a traveller’s own region, with approximately four out of five arrivals originating in the same region.
International tourist arrivals by region of origin
Top Tourism Source Markets 6
When looking in detail at the individual source markets, China, the United States and the United Kingdom led in outbound tourism numbers within their respective regions in 2015, mainly due to their favourable exchange rates and strong economies. China has been dominating global outbound travel for the past decade, especially after achieving double-digit growth in tourism expenditures every year since 2004. The total number of outbound travellers from China rose by 11 million from 2014 to reach 128 million in 2015. Chinese outbound tourism focuses mainly on regional destinations such as Japan and Thailand but also many Chinese travellers are visiting the United States and Europe.
The number of outbound travellers from the United States, the world’s second largest source market, reached 73 million in 2015. The United Kingdom (UK), the fourth largest source market, led growth in outbound demand in Europe with the support of a strong British pound against the euro. In comparison to 2014, outbound tourists from the UK were up by 5 million, totalling 64 million in 2015. Weaker currencies adversely affected the contribution of other source markets such as Germany and France. Russian Federation, Republic of Korea, Canada, Italy and Australia retained their place in the list of top 10 source markets. In addition to the top 10 markets, other source markets which showed double-digit growth in expenditure last year included Spain, Sweden, Taiwan (People’s Republic of China), Kuwait, the Philippines, Thailand, Argentina, the Czech Republic, Israel, Egypt and South Africa.
As previously discussed (see Section 2), forecasts of international tourist arrivals predict an average of 3.3% increase until 2030. In absolute numbers, international tourist arrivals are expected to increase by almost 43 million a year on average between 2010 and 2030 compared with an increase of 28 million a year during the period from 1995 to 2010. At this rate, international tourist arrivals worldwide are expected to reach 1.4 billion by 2020 and 1.8 billion by the year 2030.
From a regional perspective, Asia and the Pacific is expected to witness the strongest growth in tourist arrivals, where the forecast suggests an increase by 331 million over the 2010–2030 period to reach 535 million in 2030 with a growth of 4.9% per year. Tourist arrivals are also expected to double in the Middle East (from 61 million to 149 million) and Africa (from 50 million to 134 million) in the period from 2010 to 2030. In contrast, projections suggest that growth in Europe (from 475 million to 744 million) and the Americas (from 150 million to 248 million) will be slower compared with the projections for other regions.
Moreover, emerging economy destinations are expected to experience nearly twice as much growth in international tourist arrivals (+4.4% a year) as advanced economy destinations (+2.2% a year), exceeding the total number of arrivals in advanced economies before 2020. As a result, it is expected that in 2030, 57% of international arrivals will be in emerging economy destinations (versus 30% in 1980) and the remaining 43% in advanced economy destinations (vs 70% in 1980).
The existing data and forecasts suggest a clear increase in the number of travellers in the coming decades as well as significant overall growth in the tourism sector worldwide. While the information presented in this review has focussed on global travel trends and international tourist flows, it is important to note that domestic tourism is also expected to expand continuously, opening up more destinations and source markets in the future. In addition, the data underscore how the rapid expansion of the sector is increasingly being driven by growth of the tourism markets in emerging economies, as well as an increase in the number of first-time travellers. These factors have largely been enabled by a combination of reduced barriers to tourism and significant increases in disposable income.
The outlook for the sector poses opportunities while raising distinct challenges, in particular regarding sustainability, and highlights the need for proper planning and management in tourism. These trends provide valuable insight that should be taken into account when developing strategies and actions to address travel-related health issues such as accidents, food safety and diseases, and to ensure that tourism growth is inclusive, sustainable and resilient for both the host communities and the travellers.
Conflict of interest: None declared.
World Tourism Organization . Tourism Towards 2030/Global Overview . Madrid ; 2011 .
Google Scholar
Google Preview
United Nations General Assembly . Resolution 66/288: The future we want . New York ; 2012 .
United Nations . Sendai Framework for Disaster Risk Reduction 2015-2030 . New York ; 2015 .
United Nations General Assembly . Resolution 70/1:Transforming our world: the 2030 Agenda for Sustainable Development . New York ; 2015 .
United Nations . International Recommendations for Tourism Statistics 2008 . New York ; 2010 .
World Tourism Organization . UNWTO Tourism Highlights . Madrid ; 2016a .
World Tourism Organization . UNWTO World Tourism Barometer and Statistical Annex . Madrid ; 2016b .
Email alerts
Related articles in pubmed, citing articles via.
- Recommend to your Library
Affiliations
- Online ISSN 1708-8305
- Copyright © 2024 International Society of Travel Medicine
- About Oxford Academic
- Publish journals with us
- University press partners
- What we publish
- New features
- Open access
- Institutional account management
- Rights and permissions
- Get help with access
- Accessibility
- Advertising
- Media enquiries
- Oxford University Press
- Oxford Languages
- University of Oxford
Oxford University Press is a department of the University of Oxford. It furthers the University's objective of excellence in research, scholarship, and education by publishing worldwide
- Copyright © 2024 Oxford University Press
- Cookie settings
- Cookie policy
- Privacy policy
- Legal notice
This Feature Is Available To Subscribers Only
Sign In or Create an Account
This PDF is available to Subscribers Only
For full access to this pdf, sign in to an existing account, or purchase an annual subscription.
A tourism inflex: Generation Z travel experiences
Journal of Tourism Futures
ISSN : 2055-5911
Article publication date: 16 August 2019
Issue publication date: 18 September 2019
The purpose of this paper is twofold. First, it highlights the emergence of Generation Z and the interface of its members with the tourism system. Second, by way of a theoretical model, the paper provides a more holistic approach to understanding Generation Z travel experiences in which the emphasis is shifted from the destination to the traveller. This is in keeping with the trend which lays more emphasis on people rather than landscape.
Design/methodology/approach
This is qualitative research founded on an interpretive (constructivist) paradigm. Selecting Generation Z as the subject locates this study under generational theory and assumes prima facie a socially constructed reality. The paper is based on research conducted in New Zealand aimed at understanding the travel experiences of inbound Generation Z travellers. Data were collected from 12 semi-structured interviews lasting about 30 min each and from 5 blogs. Nvivo 11 programme was used in analysing data and developing themes. Core categories and related themes were generated forming building blocks of a theoretical model.
Findings revealed interplay of multiple factors in Generation Z’s travel experiences at a destination. The factors are global in nature, destination centric and those which are immediate or proximate to the individual. To fully grasp the notion of experience requires the gestalt of the three as well as pre-trip, during-trip and post-trip factors.
Research limitations/implications
The impact of significant events upon participants is assumed. A specific analysis of the events and the magnitude of their influence on the individual participants may be necessary.
Practical implications
Destination marketers tend to concentrate on psychological aspects to appeal to the traveller. The focus, in this case, is creating an attractive image in the mind of travellers to get them to come to the destination. This research suggests shifting the focus to understanding the evolving traveller.
Social implications
Governments and tourism purveyors may require an ever-increasing budget to map out strategies to meet the continuously morphing needs of the future traveller. The constantly evolving global environment necessitates greater flexibility in institutional framework with less bureaucratic bottlenecks.
Originality/value
Generation Z is a relatively new entrant into the tourism market which makes this research relevant and timely. The paucity of academic literature on a generation which is contemporaneously in its “highly influenceable” period of life and entering adulthood in an increasingly changing world is further credence for this research. A more holistic theoretical model to understanding Generation Z travel experience is proposed.
- Theoretical model
- Generation Z
Realm of experience
- Travel pattern
Robinson, V.M. and Schänzel, H.A. (2019), "A tourism inflex: Generation Z travel experiences", Journal of Tourism Futures , Vol. 5 No. 2, pp. 127-141. https://doi.org/10.1108/JTF-01-2019-0014
Emerald Publishing Limited
Copyright © 2019, Victor Mueke Robinson and Heike A. Schänzel
Published in Journal of Tourism Futures . Published by Emerald Publishing Limited. This article is published under the Creative Commons Attribution (CC BY 4.0) licence. Anyone may reproduce, distribute, translate and create derivative works of this article (for both commercial and non-commercial purposes), subject to full attribution to the original publication and authors. The full terms of this licence may be seen at http://creativecommons.org/licences/by/4.0/legalcode
Introduction
Any successful tourism industry player requires not only the ability to recognise change, but also effectively respond to this change. Generational change is one such occurrence, rending both opportunities and challenges for tourism destinations. A new generation is entering adulthood amidst shifting global realities and concerns such as climate change, terrorism and technological advancements. Christened Generation Z, this young generation comprises individuals born in the year 1995 and after, making the oldest members 24 years old ( Eisner, 2005 ; Chhetri et al. , 2014 ). Visitor statistics for the year ending April 2018 show that of the 3,790,505 New Zealand inbound visitors, 428,192 were aged 15–24 years which translates to 11 per cent ( Statistics New Zealand, 2018 ). A key element of a successful tourism industry is the ability to recognise and deal with change across a wide range of key factors and the way they interact ( Dwyer et al. , 2009 ). The key external drivers of global change are economic, political, environmental, technological, social and demographic.
Demographic changes can affect tourism directly or indirectly ( Grimm et al. , 2009 ). Direct impacts relate to demand (volume and structure) and the labour market (number of workers and their qualification) while the indirect impacts relate to jobs within the tourism industry, and tourism services. Demography is, therefore, a key driver for future tourism demand ( Yeoman et al. , 2013 ). Exploring demographic trends allows important change agents, on both the supply side and the demand side of tourism to be highlighted and discussed ( Dwyer et al. , 2009 ). The future growth of tourism will depend to some extent on how well the industry understands the social and demographic trends influencing traveller behaviour ( Moscardo et al. , 2010 ). Destinations and individual operators that make decisions on the supply side without matching them to changing travellers and traveller needs suffer “strategic drift”, a phenomenon which occurs when strategy gradually deviates from addressing the forces in the external environment with a clear direction ( Dwyer et al. , 2009 ).
While numerous market surveys biased towards effective marketing and advertising have been conducted on Generation Z, a dearth of academic literature has been noted. It is only recently that Generation Z literature is beginning to appear in tourism academic journals. The recent special issue on Millennials and Generation Z in Journal of Tourism Futures is one such contribution ( Corbisiero and Ruspini, 2018 ). This may be attributed to the fact that the oldest members of this generation have only recently attained legal age of adulthood and can travel independently. In addition, they no longer require parental consent to participate in research. The USA and Western Europe predominate in generation-based studies, thus creating a gap in other regions. Based on research of New Zealand inbound Generation Z travellers, this paper provides a lens through which the generation’s travel experiences can be understood. It is a contribution to the body of knowledge from which future studies can borrow. In addition it provides, by way of a theoretical model, a more holistic approach and deeper insights into Generation Z travel experiences in which emphasis is shifted from the destination to the traveller.
from an erstwhile “destination-centric” model to a “traveller-centric” model thus focusing more on the “experiencer” ( O’Dell, 2007 );
from market research and surveys orientation to an academic orientation; and
from a unilateral (Managerialist) coverage to a multi-dimensional/cross-disciplinary coverage ( Echtner and Jamal, 1997 ; Hollinshead, 2004 ).
The study goes back to more of the roots of generational theory in sociology and psychology. The aim of this research is to understand the travel experiences of New Zealand inbound Generation Z by examining their travel patterns, attitudes and travel motives. The possible factors shaping these experiences are identified.
The next section explores the context of life for Generation Z. This is followed by some projections and economic value of the generation. In the literature review the Generation theory is explored and so is the experience. The research methodology is then presented with findings being discussed thereafter. The main contribution of this research, a theoretical model is then explained along with implications and recommendations.
Generation Z in context
Generation Z is mostly the off-Spring of Generation X and has been raised during changes occasioned by the internet, smartphones, laptops, freely available network and digital media ( Tulgan, 2013 ). Elsewhere they have been called “postmillennial”, “centennials”, “pivotals” or “digital natives” among other tags ( Grail Research, 2011 ; Southgate, 2017 ). Noting that the most common name used for this group is Generation Z, Hertz (2016) tags them Generation K after the fictional character “Katniss Everdeen”, the determined heroine of the Hunger Games. This is attributed to their view of the world as one of perpetual struggle, characterised by inequality and harshness. In her 18 months interviews of 2,000 teenagers in the UK and USA, Hertz (2016) notes that this generation feels profoundly anxious and distrustful. This can be attributed to the fact that the generation developed their personalities and life skills in a socio-economic environment marked by chaos, uncertainty, volatility and complexity ( Sparks and Honey, 2014 ). They have come of age in an era of economic decline, increased inequality, job insecurity and social media presence. As argued by Read and Truelove (2018) , Generation Z has never known a world without war and terrorism and as such they crave safety and financial security.
Although some other generations, such as the First World War and the Second World War generation cohorts lived through war, no generation before has been exposed to war and terrorism 24/7 through the internet and social media. Similarly, Seemiller and Grace (2016) have identified connectivity, information at the fingertips, creative entrepreneurship, diversity and social justice, fear of disaster and tragedies and economic hardships as some of the common events constituting the context for this generation. A further list is offered by Read and Truelove (2018) to include recession, ISIS, Sandy Hook shooting, marriage equality, the first black president of USA and the rise of populism. Instructively, Generation Z members have developed coping mechanisms. They are considered to be highly educated, creative and innovative and able to multi-task in an increasingly changing environment ( Corbisiero and Ruspini, 2018 ).
Generation Z and the economic value
In the USA, Generation Z makes up a quarter of the population. The generation contributes US$44bn to the American economy and influences US$600bn in family spending ( Sparks and Honey, 2014 ; Ketchum, 2015 ; Southan, 2017 ). It is further projected that by 2020 the generation will account for one-third of the USA population and will become the most powerful spenders representing 40 per cent of consumers in the USA, Europe and BRIC (Brazil, Russia, India and China). In tourism and travel, Generation Z is considered an incredibly important cohort ( Barnes, 2018 ). This, Paul Redmond, a generation cohort expert observes, is due to several factors; first is their powerful influence on family holidays as their parents opt to consult them prior to booking trips. Second, is their preference for experiences rather than possessions thus increasing their propensity to travel in search of “fun experiences”. Furthermore, it is observed that they are open-minded, bucket-list oriented and look for off-the-beaten path locations ( Expedia, 2017 ). Consequently, they can be expected to seek out remote places and engage in numerous travels/activities. Southan (2017) has further noted that Generation Z members are budget conscious travellers and usually start off their travel without a set destination in mind.
Born into a digital age and with increasing international travel, this young generation is likely to transform tourism and destinations. Indeed, it has been argued that “Fordian” (mass) tourism may no longer provide destinations with requisite competitiveness in the face of new tourism ( Stănciulescu et al. , 2011 ). The implication is that destinations relying on mass tourism characterised by an ageing demography will find it increasingly difficult to operate profitably in an environment characterised by an emerging and more contemporary form of tourism comprising youth and youthful travellers. This envisaged demographic change represents an important phenomenon which may pose both opportunities and challenges for the development of tourism and destinations ( Bernini and Cracolici, 2015 ). Generation-based research that identifies different groups of consumers and their specific needs and desires is therefore important ( Chhetri et al. , 2014 ). Recent findings, for instance, indicate that the less technologically enabled tourism destinations can benefit by employing contemporary principles and practices to meet the needs of the new generation of tourists who seek rich digital and gamified tourism experiences ( Skinner et al. , 2018 ).
The importance of this generation and the wider youth market lies in the fact that it represents the market of the future ( Vukic et al. , 2015 ). From an academic perspective, it is to be expected that as the generation matures and takes centre stage as adults more research will be conducted and published.
Generation theory
Generation cohorts have been widely explored. Despite the extensive research, there are differing opinions as to the historical location of any particular generation and what they are to be referred to as. There, however, exists some consensus on what generations are like as explained in Manheim’s concepts of generation actuality and generation unit ( Donnison, 2007 ). Extant generation cohort studies have focussed on mapping consumption patterns so as to develop effective marketing strategies ( Rentz et al. , 1983 ; Holbrook and Schindler, 1989 ; Schuman and Scott, 1989 ; Schewe and Noble, 2000 ; Schewe and Meredith, 2004 ). This, it would seem, deviates from the theory’s “ancestral roots” in sociology and psychology. This research incorporates socio-cognitive thought.
Recent years have seen an increase in generational analysis in the tourism literature ( Beldona et al. , 2009 ; Huh and Park, 2010 ; Li et al. , 2013 ; Pennington-Gray et al. , 2003 ). Studies on lifelong travel patterns have concluded that a greater use of cohort analysis is needed to examine changes in travel behaviour ( Oppermann, 1995 ). Gardiner et al. (2014) indicate that future travel behaviour will differ between the generations. Therefore, there is an implied necessity for continuous studies and research on each generation in order to effectively respond to the needs and demands of each of them. This research on Generation Z is a contribution to this demand.
Experience in tourism
In English, the word experience refers both to lived experiences as well as to the knowledge and expertise gained over time as a result of lived experiences ( Duerden et al. , 2015 ). A distinction is made between experience as a noun and experience as a verb. A further distinction is made between two German words for experience; “Erlebnis” and “Erfahrung” ( Larsen, 2007 ; Cutler and Carmichael, 2010 ). Larsen notes that both these words are applicable to tourism in that tourists participate in events while travelling and also accumulate memories from the trips. Elsewhere, Schmitt (1999) defines experience as the triggered stimulations to the senses, the heart and the mind occurring because of encountering, undergoing or living through situations.
Beyond the definitional lacuna, however, experience is a widely studied phenomenon across disciplines. In tourism, the concept of experience is considered important for a destination’s competitiveness ( Jensen et al. , 2015 ). Tourist experience studies vary in approach and perspectives with concentration being on a social science approach and a management/marketing approach ( MacCannell, 1973 ; Lee and Crompton, 1992 ; Quan and Wang, 2004 ; Volos, 2009 ). Experience has been viewed as an interaction between destinations as the “theatres” and tourists as the “actors” ( Stamboulis and Skayannis, 2003 ). The tourism industry is considered a player in generating, staging and consuming of experiences through manipulation of place and presentation of culture ( O’Dell, 2007 ; Cutler and Carmichael, 2010 ). However, it has also been suggested that places do not attract people, nor do they push people away ( Larsen, 2007 ). Consequently, the author opines, that studies should concentrate on individuals engaged in or about to engage in tourism. The argument shifts the locus of experience and experiencing to the tourist/traveller. Indeed, in his observation, Uriely (2005) notes a shift from tourism’s displayed objects being the determinants of experience to the tourist’s subjective negotiation of meaning being the determinant.
This research regards Larsen and Uriely’s suggestions that the individual is the arena of experience. Experience is realised by the individual and can, therefore, be viewed as subjective. In this regard, experience is a reality bound within the person and not an externality. Similarly, this research holds that travel is more about the person and his/her experiences rather than about places and things ( King, 2002 ; Morgan, 2010 ). Consequently, and as suggested by King (2002) the focus of destination marketing organisations should increasingly shift from promoting physical features of the destination to being more traveller centric. Equally important is that while some literature narrows experience to occurrences at the destination, this research incorporates the gestalt of pre-trip, during trip and after trip in the discourse on experiences. The research underscores the necessity of a multi-dimensional and multidisciplinary analysis of experience in tourism.
Methodology/methods
An interpretivist paradigm underpins this study. This fits with the more sociological and subjective approach taken. Two methods were used to gather data; 12 interviews, and 5 blogs. These methods and approaches were considered reality-aware and context-appropriate ( Hollinshead, 2004 ) in that Generation Z has grown up in a digital environment, thus making use of online platforms to communicate a norm. Increasingly, social media and blogging have become avenues to post and share experiences and life happenings. Therefore, these platforms are a source of potentially rich data. In addition, the methods complement each other. The blogs helped in overcoming limitations of time, space and individuals’ biases; factors which are endemic to face-to-face interviews. Interviews ameliorated the absence of personal cues in blogs.
Recruitment of face-to-face participants was through publicly displayed posters bearing the researcher’s contact details. These were displayed in accommodation facilities where young people frequent as well as by the researcher on the streets. In addition, the referral method – snowballing was applied. For blogs, the process involved the use of search engines such as Google and Explorer. By using key search words such as tourism blogs/bloggers, travel blogs, youth travel blogs and generation Z bloggers/blogs, several blogs were identified from numerous options. Two criteria suggested by Hookway (2008) – diary style blogs and availability of search function according to location were utilised to shortlist the blogs. Eventually, five blogs were selected.
Elimination process followed to ensure that selected blogs entries were by persons within the correct age bracket and who visited New Zealand. Some bloggers were forthright with their age while for some key “give-away” information was used. An example is a participant who posted that she bought a 1997 car and added “it is older than me but runs very good”. Only participants born after 1995 and above 18 years of age were selected. Interviews were digitally recorded and later transcribed verbatim. The transcripts were saved in Microsoft word format and later uploaded to NVivo 11 programme for coding and analysis. For blogs, data were directly copied from the online entries and pasted on a word document. The documents were formatted to an acceptable standard and uploaded to Nvivo 11 programme for coding and analysis. Six steps were used in this process as shown in Figure 1 .
The steps involved data collection, transcribing, back and forth reading of the transcribed and copied data. Codes (referred to as nodes in Nvivo 11) were assigned and later developed into initial themes within which codes were now clustered (referred to as parent and child nodes, respectively, in Nvivo 11). The codes were then assigned more meaningful categories. Step 6 explored the categories to form core categories which are the building blocks of theory ( Goulding, 1998 ). The process yielded nine categories. These were re-assigned to form six core categories. While four of the categories (travel patterns, destination profile, reasons for travel and identity) are common in available literature, two are unique to this research; context and realm of experience. The six core categories and their corresponding themes represent a lens through which travel experiences of Generation Z can be understood.
Findings and discussion
Of all the participants 13 were female, while 4 were male (see Table I ). In total, seven nationalities are represented. Seven participants are from Germany, two from the USA, two from the Netherlands, two from France, two from Luxembourg, one from Iceland and one from England.
Table II presents the six categories and their related themes. Column three provides a more meaningful interpretation associated with each category/themes. It is the synthesis of the interpretations that forms the basis of the theoretical model and thus, an overall of understanding of Generation Z travel experiences.
Travel patterns
The themes related to the core category, travel patterns, are accommodation, activities, places visited, transport and travel profile. These are interpreted as services/destination interfaces and travel career. Destinations are an arena of multiple interactions to a tourist. The tourists/travellers interface with the destination through engaging with the spaces, places, cultures, facilities and systems at the destination ( Wearing and Foley, 2017 ). These contribute to the experiences of the participants. A poor interaction with the above services may lead to an overall negative experience at the destination ( Morgan et al. , 2010 ). Several factors were found to influence the choice of service. These included affordability and budgets, convenience and accessibility to these services, the flexibility of the travel plans but also serendipity. Participant 13 blogged – “After the fair we went to the harbour where someone proposed us a tour on his sailing boat. We couldn’t resist”. Participant 3 said of her travels that – “the plan is to have no plan”. Majority of the participants planned to take up temporary work to supplement their travel budget Participant 12 blogged – “I worked there 2-3 hours a day for accommodation”.
authority constraints which are imposed by law or institutions as noted by Participant 8 – “I think the rules here are too strict because I am not used to strict alcohol rules and also prices for alcohol”;
coupling constraints which relate to family, friends and colleagues; and
capability constraints which are caused by availability of travel options and/or resources such as money.
In this research, participants were drawn from seven different nationalities. The implications of this from a generation cohort perspective are varied. First, it could be argued that each participant would exhibit unique characteristics, values and behaviours because of the unique circumstances within their own country. This, it can be said will differ from a participant from a different nation where he or she experiences a different set of circumstances. Participant 7 notes – “In Germany lots of people go to New Zealand”. Participant 3 said – “New Zealand is a new country, in Europe we are like more old country so we had time to develop”. In these examples it can be said that the participants’ views and behaviours are influenced by their context of life. The context within which travel behaviour of any group occurs is important to understanding the behaviour ( Wilson et al. , 2008 ). These contexts include historical, temporal, institutional, social, global and cultural. Similarly, Jennings (2010) notes that evaluation of tourism experiences requires a consideration of local, glocal, national and global environment.
A study of Millennials by Bernardi (2018) supports this view. In the study, differences relating to country of origin were observed. The Chinese were found to be the largest spenders, while Singaporeans and Indonesians were more budget conscious, seeking budget flights and accommodation. This would put to question the cross-cultural and cross-border generation cohort validity of shared behavioural and attitudinal patterns; each nation would have its own generation cohort. However, observations by Corbisiero and Ruspini (2018) repudiate this. They opine that, due to ubiquitous connectivity, this generation has more in common with their international peers than any previous generation.
Reasons for travel
While it is possible to locate Generation Z’s multiple reasons for travel within different models in literature, an intrinsic-extrinsic classification is preferred for this research. Among the intrinsic factors are, seeking for adventure and novelty. The extrinsic factors included attractions, escapism and engaging in travel because it is the popular culture (norm). While it could be argued that escapism is also intrinsic in nature, it is generated by external circumstances such as undesirable events in country of residence or workplace. Participant 10 from the USA said – “I was kind of running away from the negative changes that are happening and I didn’t really want to be associated with that I guess”. An alternative classification would be on a hedonic-utilitarian continuum. Hedonic reasons have to do with emotional and experiential aspects while utilitarian are benefits driven ( Asraar, 2015 ). Generation Z behaviour and choices were not only consistent with the search of travel experiences, but also with the quest for value for the resources invested in the travel.
Travel for Generation Z is also a time of conviviality, socialisation and empowerment ( Haddouche and Salomone, 2018 ). In travelling, new friendships were forged, interactions with locals and fellow travellers craved and deeper meanings to personal life and self-development sought. Participant 9 – “I’ve met people now in my hostel, now we are going in March for a road trip”. Furthermore, travel was attributed to the popular concept known as fear-of-missing-out. This is a pervasive apprehension that others might be having rewarding experiences from which one is absent ( Przybylski et al. , 2013 ). A survey by Smith (2018) corroborates this, reporting that 82 per cent of Generation Z regretted losing out on chances to travel.
Two participants were travelling on internship. However, these participants were intent on using internship as the means to get to New Zealand and do some travelling. While the participants expressed a desire to tour more places in New Zealand, the time limit on their internship prevented them from undertaking longer trips. The diversity of flora and fauna motivated one of the travellers whose interests are botany to visit and immerse in the country’s nature. Research shows that the 15–24 year old age groups are more likely to travel for educational purposes when compared to older age groups ( Collins and Tisdell, 2002 ; Huh and Park, 2010 ). Related to this is partnership and transnational connections between organisations which saw the two afore mentioned participants travel to New Zealand as interns through partnership of an organisation in Germany with a New Zealand-based organisation.
Destination profile
This relates to perceptions about New Zealand as a destination, the attractions and facilities and the resultant expectations. Expectations are further linked to the appraisal of the destination by the traveller, which relates to satisfaction or dissatisfaction. Eventually, this will influence the sort of experience that the traveller has. However, a destination is not just a geographical unit but is also subject to people’s judgement and evaluation ( Chen and Šegota, 2015 ). Implied are not only the evident physical features but, also the abstract and subjective psychological elements as perceived by the tourist. Elsewhere, this dichotomy is observed by Echtner and Ritchie (1993) who opine that destinations have functional (tangible) and psychological (abstract) characteristics.
cognitive which constitutes what Generation Z knew about the destination;
affective which relates to Generation Z’s feelings about the destination;
evaluative which describes how the destination was appraised – Participant 3 – “I think the rules here are too strict because I am not used to strict alcohol rules”; and
behavioural which is tied to decisive actions to undertake an activity or to visit a place.
The regular frequency of terrorist attacks has seen increased measures by governments to curb the menace. This has significantly changed the mind-set of international tourists. Some of the participants believed destinations have become safer because of terror attacks. Reasons presented included the resultant increase in surveillance and security procedures. Still others believed that shrinking back from travelling would mean a triumph of terrorism. It would therefore appear that, Generation Z has become accustomed to and adapted to the volatile global environment in which they have grown up in.
On environmental issues a participant thought it contradictory that New Zealand is portrayed as this pristine green environment but there appeared to be a crisis with plastic bags: Participant 8 – “I always thought New Zealand is so natural, and they take care of their environment but, the biggest problem is the plastic bags at the super market, it’s so crazy”. This participant also considered it paradoxical that there were issues with harsh sun rays, but that protective sunscreen was expensive or at least higher than at her home country.
A further area of focus is the socio-political issues in the destination (New Zealand). Commenting on society, a participant reported what they perceived as discrimination against indigenous people. There was a feeling that the Maori were treated unfairly. Participant 2 – “We spoke to a lot of Maori and local people and I think, I don’t know whether it’s right to say but, there was quite a lot of discrimination which we found shocking”. Separately, some participants who engaged in part time jobs felt exploited by their employers. Another participant felt extorted by mechanics and car dealers. The use of English as an official language contributed to a seamless and fulfilling experience to some as it eliminated possible language barriers: Participant 7 – “Because it is an English country and a lot of people speak English so it’s a good place to come”. However, this might be viewed differently by participants drawn from non-English speaking regions. Immigration policy permitting work is critical to the long period of stay. Participants needed work to supplement their travel budget or subsidise on spending such as accommodation and activities.
Seasonality and weather patterns were factored before and during travel. To some the timing of the trip was to coincide with Summer season in the destination. Participant 9 – “Winter is starting in Germany. This is the reason I came here”. Locally, some participants altered their schedules to fit to the weather patterns of the time. Whereas the majority favoured Summer, there were some who, because of their passion for skiing thought Winter months would be good time to plan a visit to Queenstown. A study in Romania showed that seasonality was a determinant of the type of adventure and sport tourism practiced by the youth ( Demeter and Brătucu, 2014 ). New Zealand statistical data show a preference for the warmer Autumn and Summer months by international travellers. In the year 2017, international arrivals during the Autumn–Summer months were 57.8 per cent while Spring–Winter months were 42.2 per cent ( Smiler, 2018 ). In this regard, global, socio-political and environmental factors appear to alter or modify the travellers’ behaviours and contribute to their overall experience.
Because Generation Z is characterised as being digitally adept, social and mobile, ICT is a critical component and a linkage to services or to the outer world. The widespread use of mobile apps, such as Campmate, and the reliance on social media was a common feature among the participants. Participant 1 – “Instagram is a big feature because I have seen so many beautiful pictures of New Zealand holy crap and I want to visit these places and take these exact photos”. There was reliance on social media to make travel decisions. These technological advancements facilitate ease of access to information, facilities and places. Therefore, Generation Z behavioural patterns in a destination and their experiences may be impacted or influenced by ICT advancements.
It is observed that travel offered the opportunity to plan one’s life. Being far away from the accustomed way of life, New Zealand provided the requisite environment for self-reflection: Participant 3 – “I think in those moments you really get to know yourself”. Photos and experiences shared online by the participants is a way of building personal identity and part of experience ( Bernardi, 2018 ).
physiological realm (sensory experience – relating to body);
psychological realm (cognitive, affective and conative experiences – relating to the soul); and
spiritual realm – spirit (spiritual experiences – relating to spirit).
Seemingly, this agrees with Walls’ (2013) definition of tourist experience as a blend of many individual elements coming together and may involve the tourist emotionally, physically and intellectually. Indeed, everything tourists go through at a destination can be experience, whether behavioural or perceptual, cognitive or emotional, expressed or implied ( Oh et al. , 2007 ). Noteworthy though is that, the reasons and patterns of travel exhibited by Generation Z do not appear to be fundamentally different to previous generations when they were of the same age. In this regard, this research evinces extant literature on youth/backpacker/gap year or even other recent generations such as Generation Y travellers ( Adler, 1985 ; Benckendorff et al. , 2010 ; Luo et al. , 2015 ; Richards, 2015 ). While the reasons and/or patterns may be similar, contemporary factors can impact on a generation’s experiences. The advances in technology (internet, social media and smartphones), for example, have fostered internet-based travel services, thus, altering traveller expectations, and resultant travel experiences.
Conclusions and recommendations
Immediate influences (forces) – including family, friends, events in the home country. Participant 13 offered – “We took a bath in the outdoor bathtubs of the villa. It was like a childhood memory. As children we always used to take a bath together. Still another observed, we grew up buying fish in a supermarket in plastic but here someone comes with fresh fish caught an hour ago”.
Destination influences (forces) – including socio-political, cultural, physical features/attributes. A participant talking about a local couple she met said – we ate together and shared our food. I really enjoyed listening to all their stories. Participant 3 noted – “I also did glow worms which is definitely an experience that I will remember probably for the rest of my life”. On her part Participant 4 said – “We listened to locals’ advice”.
Global influences (forces) – including events with global ramifications, climate change, terrorism, financial volatility, geo-politics and technological advancements as noted by Participant 1 – “For me going to New Zealand it was like stepping out of the craziness happening in Europe”. Participant 5 mentioned – “I’m from Germany, the east, so my parents did not get a chance to travel at all because of the separation […] I think they could only go to Ukraine and maybe Russia […] They didn’t have the chance to travel like we are doing now”.
The individual arrives at the destination with embedded subjective elements as a result of interfacing with immediate influences and global influences. Additional elements are embedded in the individual through interfacing with the tourism system at the destination. The amalgamation of these elements contributes to the traveller’s experience at the destination. The destination can further be described as an “agitator” or “instigator” of the experience. To effectively understand the individual’s experience requires an appreciation of the context of life from which he/she has come. This entails awareness of both historical and contemporary influences in the life of that individual or group of individuals. While it is a logistical and practical impossibility to fully profile each individual travelling to a destination, an understanding of the multiple channels that contribute to the individual’s ethos would lend additional credence to understanding and managing tourist experiences.
Generation Z is progressively taking the centre stage. Members of this generation will soon be the adults occupying leadership positions and become the financiers of tourism and travel. Investment into more research informed by an impending future is recommended. While tourism infrastructure development is important, significant focus needs to be placed on understanding the tourist of the future. Governments and tourism purveyors may require an ever-increasing budget to map out strategies to meet the continuously morphing needs of the future traveller. In addition, strategies are required to address the evolving global consumer trends, especially bearing in mind the global influences (forces). Incorporating current technologies at every level should be at the forefront of government and industry future planning. This may include deployment of internet connectivity in remote areas which lack strong links. Greater flexibility in institutional frameworks, with less bureaucratic bottlenecks is further suggested. Destination marketers tend to concentrate on psychological aspects to appeal to the traveller. The goal, in this case, is creating an attractive image in the mind of travellers to get them to come to the destination. Emphasis is more about the destination. This research suggests shifting the focus to understanding the evolving traveller’s needs and preferences.
A key limitation of the research is that the impact of significant events upon participants is assumed. A specific analysis of the events and the magnitude of their influence on the individual participants may be necessary. Research is recommended for not only the different ephemeral factors, but also longitudinal studies of generations.
Coding process
A theoretical model of Generation Z travel experiences
Demographic profile of New Zealand inbound Generation Z participants
Core categories, related themes and interpretation of Generation Z travel experiences
Adler , J. ( 1985 ), “ Youth on the road: reflections on the history of tramping ”, Annals of Tourism Research , Vol. 12 No. 3 , pp. 335 - 54 .
Asraar , A.K.A. ( 2015 ), “ Utilitarian and hedonic motives of university students in their online shopping – a gender based examination ”, Global Management Review , Vol. 9 No. 4 , pp. 75 - 91 .
Avraham , E. and Ketter , E. ( 2008 ), Media Strategies for Marketing Places in Crisis. Improving the Image of Cities, Countries and Tourist Destinations , Butterworth-Heinemann , Amsterdam .
Barnes , R. ( 2018 ), “ Gen-Z expert panel the ‘little extraordinaires’ to consult for Royal Caribbean ”, Cruise Trade News, May, available at: www.cruisetradenews.com/gen-z-expert-panel-the-little-extraordinaires-to-consult-for-royal-caribbean/ (accessed 16 May 2018 ).
Beldona , S. , Nusair , K. and Demicco , F. ( 2009 ), “ Online travel purchase behavior of generational cohorts: a longitudinal study ”, Journal of Hospitality Marketing & Management , Vol. 18 No. 4 , pp. 406 - 20 .
Benckendorff , P. , Moscardo , G. and Pendergast , D. ( 2010 ), Tourism and Generation Y , CAB International , Cambridge, MA .
Bernardi , M. ( 2018 ), “ Millennials, sharing economy and tourism: the case of Seoul ”, Journal of Tourism Futures , Vol. 4 No. 1 , pp. 43 - 56 .
Bernini , C. and Cracolici , M.F. ( 2015 ), “ Demographic change, tourism expenditure and life cycle behaviour ”, Tourism Management , Vol. 47 , pp. 191 - 205 .
Charmaz , K. ( 2006 ), Constructing Grounded Theory: A Practical Guide Through Qualitative Analysis , Sage Publications , Thousand Oaks, CA .
Chen , N. and Šegota , T. ( 2015 ), “ Resident attitudes, place attachment and destination branding: a research framework ”, Tourism and Hospitality Management , Vol. 21 No. 2 , pp. 145 - 58 .
Chhetri , P. , Hossain , M.I. and Broom , A. ( 2014 ), “ Examining the generational differences in consumption patterns in South East Queensland ”, City, Culture and Society , Vol. 5 No. 4 , pp. 1 - 9 .
Collins , D. and Tisdell , C. ( 2002 ), “ Age-related lifecycles: purpose variations ”, Annals of Tourism Research , Vol. 29 No. 3 , pp. 801 - 18 .
Corbisiero , F. and Ruspini , E. ( 2018 ), “ Millennials and Generation Z: challenges and future perspectives for international tourism ”, Journal of Tourism Futures , Vol. 4 No. 1 , pp. 253 - 5 .
Cutler , Q.S. and Carmichael , B. ( 2010 ), “ The dimensions of the tourist experience ”, in Morgan , M. , Lugosi , P. and Ritchie , B.J.R. (Eds), The Tourism and Leisure Experience: Consumer and Managerial Perspectives , Channel View Publications , Tonawanda, NY , pp. 3 - 26 .
Dellaert , B.G.C. , Ettema , D.F. and Lindh , C. ( 1998 ), “ Multi-faceted tourist travel decisions: a constraint-based conceptual framework to describe tourists’ sequential choices of travel components ”, Tourism Management , Vol. 19 No. 4 , pp. 313 - 20 .
Demeter , T. and Brătucu , G. ( 2014 ), “ Typologies of youth tourism ”, Bulletin of the Transilvania University of Braşov Series V: Economic Sciences @BULLET , Vol. 7 No. 56 , pp. 115 - 22 .
Donnison , S. ( 2007 ), “ Unpacking the millennials: a cautionary tale for teacher education ”, Australian Journal of Teacher Education , Vol. 32 No. 3 , p. 1 .
Duerden , M.D. , Ward , P.J. and Freeman , P.A. ( 2015 ), “ Conceptualizing structured experiences ”, Journal of Leisure Research Copyright , Vol. 47 No. 5 , pp. 601 - 20 .
Dwyer , L. , Edwards , D. , Mistilis , N. , Roman , C. and Scott , N. ( 2009 ), “ Destination and enterprise management for a tourism future ”, Tourism Management , Vol. 30 No. 1 , pp. 63 - 74 .
Echtner , C.M. and Jamal , T.B. ( 1997 ), “ The disciplinary dilemma of tourism studies ”, Annals of Tourism Research , Vol. 24 No. 4 , pp. 868 - 83 .
Echtner , C.M. and Ritchie , J.R.B. ( 1993 ), “ The measurement of destination image: an empirical assessment ”, Journal of Travel Research , Vol. 31 No. 4 , pp. 3 - 13 .
Eisner , S.P. ( 2005 ), “ Managing Generation Y ”, SAM Advanced Management Journal , Vol. 70 No. 4 , pp. 4 - 15 .
Expedia ( 2017 ), “ Connecting the digital dots: the motivations and mindset of European travellers ”, available at: https://info.advertising.expedia.com/hubfs/Content_Docs/Premium_Content/pdf/Research_MultiGen_Travel_Trends_European_Travellers-2017-09.pdf?t=1527792003705 (accessed 5 June 2018 ).
Gardiner , S. , Grace , D. and King , C. ( 2014 ), “ The generation effect: the future of domestic tourism in Australia ”, Journal of Travel Research , Vol. 53 No. 6 , pp. 705 - 20 .
Goulding , C. ( 1998 ), “ Grounded theory: the missing methodology on the interpretivist agenda ”, Qualitative Market Research: An International Journal European Journal of Marketing , Vol. 14 No. 4 , pp. 50 - 7 .
Grail Research ( 2011 ), “ Consumers of tomorrow: insights and observations about Generation Z ”, available at: www.grailresearch.com/pdf/ContenPodsPdf/Consumers_of_Tomorrow_Insights_and_Observations_About_Generation_Z.pdf (accessed 8 March 2018 ).
Grimm , B. , Lohmann , K. , Heinsohn , K. , Richter , C. and Metzler , D. ( 2009 ), “ The impact of demographic change on tourism and conclusions for tourism policy at a glance ”, available at: http://observgo.uquebec.ca/observgo/fichiers/73044_PSEC-15.pdf (accessed 11 May 2018 ).
Haddouche , H. and Salomone , C. ( 2018 ), “ Generation Z and the tourist experience: tourist stories and use of social networks ”, Journal of Tourism Futures , Vol. 4 No. 1 , pp. 69 - 79 .
Hägerstrand , T. ( 1970 ), “ What about people in regional science? ”, Papers of the Regional Science Association , Vol. 24 No. 1 , pp. 7 - 21 .
Hertz , N. ( 2016 ), “ Think Millennials have it tough? For ‘Generation K’, life is even harsher ”, The Guardian , 19 March, available at: www.theguardian.com/world/2016/mar/19/think-millennials-have-it-tough-for-generation-k-life-is-even-harsher (accessed 8 May 2018 ).
Holbrook , M.B. and Schindler , R.M. ( 1989 ), “ Some exploratory findings on the development of musical tastes ”, Journal of Consumer Research , Vol. 16 No. 1 , pp. 119 - 24 .
Hollinshead , K. ( 2004 ), “ A primer in ontological craft: the creative capture of people and places through qualitative research ”, in Phillimore , J. and Goodson , L. (Eds), Qualitative Research in Tourism: Ontologies, Epistemologies and Methodologies , Routledge , London , pp. 63 - 82 .
Hookway , N. ( 2008 ), “ Entering the blogosphere: some strategies for using blogs in social research ”, Qualitative Research , Vol. 8 No. 1 , pp. 91 - 113 .
Huh , C. and Park , S.H. ( 2010 ), “ Changes in patterns of trip planning horizon: a cohort analytical approach ”, Journal of Hospitality Marketing & Management , Vol. 19 No. 3 , pp. 260 - 79 .
Jennings , G. ( 2010 ), “ Research processes for evaluating quality experiences: reflections from the ‘experience field(s)’ ”, in Morgan , M. , Lugosi , P. and Ritchie , B.J.R. (Eds), The Tourism and Leisure Experience: Consumer and Managerial Perspectives , Channel View Publications , Bristol , pp. 81 - 98 .
Jensen , Ø. , Østergaard , P. and Lindberg , F. ( 2015 ), “ How can consumer research contribute to increased understanding of tourist experiences? A conceptual review ”, Scandinavian Journal of Hospitality and Tourism , Vol. 15 No. S1 , pp. 9 - 27 .
Ketchum ( 2015 ), “ Engaging Gen Z ”, available at: www.ketchum.com/engaging-gen-z (accessed 8 May 2018 ).
King , J. ( 2002 ), “ Destination marketing organisations – connecting the experience rather than promoting the place ”, Journal of Vacation Marketing , Vol. 8 No. 2 , pp. 105 - 8 .
Larsen , S. ( 2007 ), “ Aspects of a psychology of the tourist experience ”, Scandinavian Journal of Hospitality and Tourism , Vol. 7 No. 1 , pp. 7 - 18 .
Lee , T. and Crompton , J. ( 1992 ), “ Measuring novelty seeking in tourism ”, Annals of Tourism Research , Vol. 19 No. 4 , pp. 732 - 51 .
Li , X. , Li , X. (Robert) and Hudson , S. ( 2013 ), “ The application of generational theory to tourism consumer behavior: an American perspective ”, Tourism Management , Vol. 37 , pp. 147 - 64 .
Luo , X. , Huang , S. (Sam) and Brown , G. ( 2015 ), “ Backpacking in China: a netnographic analysis of donkey friends’ travel behaviour ”, Journal of China Tourism Research , Vol. 11 No. 1 , pp. 67 - 84 .
MacCannell , D. ( 1973 ), “ Staged authenticity: arrangements of social space in tourist settings ”, American Journal of Sociology , Vol. 79 No. 3 , pp. 589 - 603 .
Morgan , M. ( 2010 ), “ The experience economy 10 years on: where next for experience management ”, in Morgan , M. , Lugosi , P. and Ritchie , B.J.R. (Eds), The Tourism and Leisure Experience: Consumer and Managerial Perspectives , Channel View Publications , Bristol , pp. 218 - 30 .
Morgan , M. , Lugosi , P. and Ritchie , B.J.R. ( 2010 ), The Tourism and Leisure Experience , Channel View Publications , Bristol .
Moscardo , G. , Murphy , L. and Benckendorff , P. ( 2010 ), “ Generation Y and travel futures ”, in Yeoman , I. , Hsu , C. , Smith , C. and Watson , S. (Eds), Tourism and Demography , Goodfellow Publishers , Oxford , pp. 87 - 100 .
O’Dell , T. ( 2007 ), “ Tourist experiences and academic junctures ”, Scandinavian Journal of Hospitality and Tourism , Vol. 7 No. 1 , pp. 34 - 45 .
Oh , H. , Fiore , A.M. and Jeoung , M. ( 2007 ), “ Measuring experience economy concepts: tourism applications ”, Journal of Travel Research , Vol. 46 No. 2 , pp. 119 - 32 .
Oppermann , M. ( 1995 ), “ Family life cycle and cohort effects: a study of travel patterns of German residents ”, Journal of Travel & Tourism Marketing , Vol. 4 No. 1 , pp. 23 - 44 .
Pennington-Gray , L. , Kerstetter , D.L. and Warnick , R. ( 2003 ), “ Forecasting travel patterns using Palmore’s cohort analysis ”, in Song , H. and Wong , K.K.F. (Eds), Tourism Forecasting and Marketing , Taylor & Francis , New York, NY , pp. 127 - 45 .
Phillimore , J. and Goodson , L. ( 2004 ), “ Progress in qualitative research in tourism: epistemology, ontology and methodology ”, in Phillimore , J. and Goodson , L. (Eds), Qualitative Research in Tourism: Ontologies, Epistemologies and Methodologies , Routledge , London , pp. 3 - 29 .
Przybylski , A.K. , Murayama , K. , DeHaan , C.R. and Gladwell , V. ( 2013 ), “ Motivational, emotional, and behavioral correlates of fear of missing out ”, Computers in Human Behavior , Vol. 29 No. 4 , pp. 1841 - 8 .
Quan , S. and Wang , N. ( 2004 ), “ Towards a structural model of the tourist experience: an illustration from food experiences in tourism ”, Tourism Management , Vol. 25 No. 3 , pp. 297 - 305 .
Read , A. and Truelove , C. ( 2018 ), “ The incoming tide of Generation Z ”, AMA Quarterly , Vol. 4 No. 10 , pp. 43 - 6 .
Rentz , J.O. , Reynolds , F.D. and Stout , R.G. ( 1983 ), “ Analyzing changing consumption patterns with cohort analysis ”, Journal of Marketing Research , Vol. 20 No. 1 , pp. 12 - 20 .
Richards , G. ( 2015 ), “ The new global nomads: youth travel in a globalizing world ”, Tourism Recreation Research , Vol. 40 No. 3 , pp. 340 - 52 .
Schewe , C.D. and Meredith , G. ( 2004 ), “ Segmenting global markets by generational cohorts: determining motivations by age ”, Journal of Consumer Behaviour , Vol. 4 No. 1 , pp. 51 - 63 .
Schewe , C.D. and Noble , S.M. ( 2000 ), “ Market segmentation by cohorts: the value and validity of cohorts in America and abroad ”, Journal of Marketing Management , Vol. 16 Nos 1-3 , pp. 129 - 42 .
Schmitt , B.H. ( 1999 ), Experiential Marketing : How to Get Customers to Sense, Feel, Think, Act, and Relate to your Company and Brands , Free Press , New York, NY .
Schuman , H. and Scott , J. ( 1989 ), “ Generations and collective memories ”, American Sociology Review , Vol. 54 No. 3 , pp. 359 - 81 .
Seemiller , C. and Grace , M. ( 2016 ), Generation Z goes to College , John Wiley & Sons , San Francisco, CA .
Skinner , H. , Sarpong , D. and White , G.R.T. ( 2018 ), “ Meeting the needs of the Millennials and Generation Z: gamification in tourism through geocaching ”, Journal of Tourism Futures , Vol. 4 No. 1 , pp. 93 - 104 .
Smiler , J. ( 2018 ), “ New Zealand tourism state of the industry 2017 ”, available at: https://tia.org.nz/assets/Uploads/State-of-the-Tourism-Industry-2017-final.pdf (accessed 8 May 2018 ).
Smith , A. ( 2018 ), Generation Z is the most Regretful of all Ages about Missed Travel Opportunities , Lonely Planet , 15 May, available at: www.lonelyplanet.com/news/2018/05/14/generation-z-missed-travel-opportunities/ (accessed 8 June 2018 ).
Southan , J. ( 2017 ), “ From boomers to Gen Z: travel trends across the generations ”, Globetrender Magazine, 19 May, available at: http://globetrendermagazine.com/2017/05/19/travel-trends-across-generations/ (accessed 8 June 2018 ).
Southgate , D. ( 2017 ), “ The emergence of Generation Z and its impact in advertising: long-term implications for media planning and creative development ”, Journal of Advertising Research , Vol. 57 No. 2 , pp. 227 - 35 .
Sparks and Honey ( 2014 ), “ Meet Generation Z: forget everything you learned about Millenials ”, available at: https://emp-help-images.s3.amazonaws.com/summitpresentations/generationZ.pdf (accessed 8 June 2018 ).
Stamboulis , Y. and Skayannis , P. ( 2003 ), “ Innovation strategies and technology for experience-based tourism ”, Tourism Management , Vol. 24 No. 1 , pp. 35 - 43 .
Stănciulescu , G. , Molnar , E. and Bunghez , M. ( 2011 ), “ Tourism’s changing face: new age tourism versus old tourism ”, Annals of the University of Oradea , Economic Science Series , pp. 245 - 9 .
Statistics New Zealand ( 2018 ), “ International visitor arrivals to New Zealand: June 2018 | Stats NZ ”, available at: www.stats.govt.nz/information-releases/international-visitor-arrivals-to-new-zealand-june-2018 (accessed 8 June 2018 ).
Tulgan , B. ( 2013 ), “ Meet Generation Z: the second generation within the giant ‘Millennial’ cohort ”, Rainmaker Thinking, available at: http://rainmakerthinking.com/assets/uploads/2013/10/Gen-Z-Whitepaper.pdf (accessed 8 May 2018 ).
Uriely , N. ( 2005 ), “ The tourist experience: conceptual developments ”, Annals of Tourism Research , Vol. 32 No. 1 , pp. 199 - 216 .
Volos , S. ( 2009 ), “ Conceptualizing experience: a tourist based approach ”, Journal of Hospitality and Leisure Marketing , Vol. 18 Nos 2-3 , pp. 111 - 26 .
Vukic , M. , Kuzmanovic , M. and Stankovic , M.K. ( 2015 ), “ Understanding the heterogeneity of Generation Y’s preferences for travelling: a conjoint analysis approach ”, International Journal of Tourism Research , Vol. 17 No. 5 , pp. 482 - 91 .
Walls , A.R. ( 2013 ), “ A cross-sectional examination of hotel consumer experience and relative effects on consumer values ”, International Journal of Hospitality Management , Vol. 32 , pp. 179 - 92 .
Walters , T. ( 2016 ), “ Using thematic analysis in tourism research ”, Tourism Analysis , Vol. 21 No. 1 , pp. 107 - 16 .
Wearing , S.L. and Foley , C. ( 2017 ), “ Understanding the tourist experience of cities ”, Annals of Tourism Research , Vol. 65 , pp. 97 - 107 .
Wilson , J. , Fisher , D. and Moore , K. ( 2008 ), “ Van tour and ‘doing a Contiki’: grand ‘backpacker’ tours of Europe ”, in Hannam , K. and Ateljevic , I. (Eds), Backpacker Tourism: Concepts and Profiles , Channel View Publications , Clevedon , pp. 113 - 27 .
Yeoman , I. , Schänzel , H. and Smith , K. ( 2013 ), “ A sclerosis of demography ”, Journal of Vacation Marketing , Vol. 19 No. 2 , pp. 91 - 103 .
Corresponding author
About the authors.
Victor Mueke Robinson is based at the School of Hospitality and Tourism, Auckland University of Technology, Auckland, New Zealand.
Heike A. Schänzel is based at the School of Hospitality and Tourism, Auckland University of Technology, Auckland, New Zealand.
Related articles
We’re listening — tell us what you think, something didn’t work….
Report bugs here
All feedback is valuable
Please share your general feedback
Join us on our journey
Platform update page.
Visit emeraldpublishing.com/platformupdate to discover the latest news and updates
Questions & More Information
Answers to the most commonly asked questions here
- Home »
- notebook »
- aircraft operations »
- terminal »
- traffic pattern operations
Traffic Pattern Operations
Introduction:.
- Traffic Pattern procedures develop the ability to stay safely and efficiently arrive at an uncontrolled airport, or after arrival, utilize the traffic pattern
- The traffic pattern is comprised of several components which standardized flow of aircraft, at a specific altitude within the terminal area
- This standard flow allows for predictability in an otherwise extremely dangerous environment
- The traffic pattern is the ultimate goal which began with the rectangular course with many hazards
Traffic Pattern Components:

- The traffic pattern is divided into legs which form a rectangle
- Legs define a phase of flight associated with takeoff, landing, or closed pattern touch and go operations
- Diagrams are intended only to illustrate terminology used in identifying various components of a traffic pattern. It should not be used as a reference or guide on how to enter a traffic pattern
- Pilots are encouraged to use the standard traffic pattern. However, those pilots who choose to execute a straight-in approach, maneuvering for and execution of the approach should not disrupt the flow of arriving and departing traffic. Likewise, pilots operating in the traffic pattern should be alert at all times for aircraft executing straight-in approaches
- *RP indicates special conditions exist and refers pilots to the Chart Supplement U.S
- Right traffic patterns are not shown at airports with full-time control towers
Upwind Leg:
- A flight path parallel to the landing runway in the landing direction
- Still, expect many will still use two used interchangeably
Crosswind Leg:
- A flight path at right angles to the landing runway off its takeoff end
- The direction of the crosswind leg (left or right turn) is dictated by the airport publications or tower
- It is recommended the turn from upwind to crosswind be at 700 ft AGL (~300 ft below traffic pattern altitude), unless local procedures or ATC dicated otherwise
Downwind Leg:
- A flight path parallel to the landing runway in the opposite direction of landing
- While it is the longest leg, it requires the most vigilance for traffic entering and departing
- A flight path at right angles to the landing runway off its approach end and extending from the downwind leg to the intersection of the extended runway centerline
Final Approach:
- A flight path in the direction of landing along the extended runway centerline from the base leg to the runway
- Before touching down, check for waive-off lights if present, or light signals from tower
- The flight path which begins after takeoff and continues straight ahead along the extended runway centerline
- The departure climb continues until reaching a point at least 1/2 mile beyond the departure end of the runway and within 300 feet of the traffic pattern altitude
- May exit 45° off in the direction of the pattern turns as well
Traffic Pattern Altitude:
- Military turbojet aircraft may extend the pattern up to 2,500' AGL
- Propeller-driven aircraft enter the traffic pattern at 1,000 feet above ground level (AGL)
- Large and turbine-powered aircraft enter the traffic pattern at an altitude of not less than 1,500 feet AGL or 500 feet above the established pattern altitude
- Helicopters operating in the traffic pattern may fly a pattern similar to the fixed-wing aircraft pattern, but at a lower altitude (500 AGL) and closer to the runway. This pattern may be on the opposite side of the runway from fixed-wing traffic when airspeed requires or for practice power-off landings (autorotation) and if local policy permits. Landings not to the runway must avoid the flow of fixed wing traffic
- A pilot may vary the size of the traffic pattern depending on the aircraft's performance characteristics. Pilots of en route aircraft should be constantly alert for aircraft in traffic patterns and avoid these areas whenever possible
- Circle the airport to the left if operating an airplane; or
- Avoid the flow of fixed-wing aircraft, if operating a helicopter
- RP* indicates special conditions exist and refers pilots to the Chart Supplement U.S.
- Standard break is at 1,100' AGL
- Standard Naval pattern is at 800' AGL
- Standard carrier break is at 800' AGL
- Standard carrier pattern is at 600' AGL
- Unless otherwise required by the applicable distance from clouds ( FAR 91.155 ) or operations, pilots should maintain traffic pattern altitude
- Traffic patterns are left turns by standard, unless ATC or the Chart Supplement U.S. states otherwise, as shown in Meadows Field below, under RWY 30R and 12R with the text "Rgt tfc"
- Wind conditions affect all airplanes in varying degrees. Figure 4-3-4 is an example of a chart used to determine the headwind, crosswind, and tailwind components based on wind direction and velocity relative to the runway. Pilots should refer to similar information provided by the aircraft manufacturer when determining these wind components
Keys to Traffic Pattern Operations:
- Enter pattern in level flight, abeam midpoint of the runway, at pattern altitude (1,000' AGL is recommended pattern altitude unless established otherwise...)
- Try not to enter the pattern on base/final even if that is the quickest as it does not afford you a look at the runway until you're on final
- Maintain pattern altitude until abeam approach end of the landing runway on downwind leg
- Complete turn to final at least 1/4 mile from the runway
- Continue straight ahead until beyond departure end of runway
- If remaining in the traffic pattern, commence turn to crosswind leg beyond the departure end of the runway within 300' of pattern altitude
- Maintain situational awareness to anyone entering the traffic pattern on a 45° angle as they may be flying directly toward or paralleling the departure track
- Do not overshoot final or continue on a track, which will penetrate the final approach of the parallel runway
- Do not continue on a track, which will penetrate the departure path of a parallel runway
- Maintaining this predictable track makes traffic predictable and positions aircraft in the best position to quickly land in the event of an emergency
- Distance from the airport can be referenced by landmarks or using runway lengths for perspective

Towered Airports:
- Initial callup should be made about 15 miles from the airport
- Unless there is a good reason to leave the tower frequency before exiting the Class B, Class C, and Class D surface areas, it is a good operating practice to remain on the tower frequency for the purpose of receiving traffic information
- It is not necessary to request permission to leave the tower frequency once outside of Class B, Class C, and Class D surface areas, as it reduces frequency congestion
- When operating at uncontrolled fields, keep to normal towered procedures to remain predictable
- The controlled airspace over these airports will normally begin at 700' or 1,200' AGL (see Class Echo Airspace ) and can be determined from the visual aeronautical charts
- Pilots are expected to use good operating practices and communicate with the control tower, same as above
- Thus, if not otherwise authorized or directed by the tower, pilots of fixed-wing aircraft approaching to land must circle the airport to the left
- Pilots approaching to land in a helicopter must avoid the flow of fixed-wing traffic
- In all instances, an appropriate clearance must be received from the tower before landing
- Many towers will have radar display which are intended to enhance the effectiveness and efficiency of the local control, or tower, position
- They are not intended to provide radar services or benefits to pilots except as they may accrue through a more efficient tower operation
Determining an Aircraft's Exact Location:
- Accomplished by radar identifying the VFR aircraft through any of the techniques available to a radar position, such as having the aircraft squawk ident
- Once identified, the aircraft's position and spatial relationship to other aircraft can be quickly determined, and standard instructions regarding VFR operation in Class B, Class C, and Class D surface areas will be issued
- Once initial radar identification of a VFR aircraft has been established and the appropriate instructions have been issued, radar monitoring may be discontinued; the reason being that the local controller's primary means of surveillance in VFR conditions is visually scanning the airport and local area
Provide Radar Traffic Advisories:
- Radar traffic advisories may be provided to the extent that the local controller is able to monitor the radar display
- Local control has primary control responsibilities to the aircraft operating on the runways, which will normally supersede radar monitoring duties
Provide Direction or Suggested Heading:
- The local controller may provide pilots flying VFR with generalized instructions which will facilitate operations; e.g., " Proceed southwest-bound, enter a right downwind runway three zero ," or provide a suggested heading to establish radar identification or as an advisory aid to navigation; " Suggested heading two two zero, for radar identification "
- In both cases, the instructions are advisory aids to the pilot flying VFR and are not radar vectors which gives pilots complete discretion regarding acceptance of the suggestions as they have sole responsibility for seeing and avoiding other aircraft
Provide Information and Instructions:
- In an example of this situation, the local controller would use the radar to advise a pilot on an extended downwind when to turn base leg
- NOTE: The above tower radar applications are intended to augment the standard functions of the local control position. There is no controller requirement to maintain constant radar identification. In fact, such a requirement could compromise the local controller's ability to visually scan the airport and local area to meet FAA responsibilities to the aircraft operating on the runways and within the Class B, Class C, and Class D surface areas. Normally, pilots will not be advised of being in radar contact since that continued status cannot be guaranteed and since the purpose of the radar identification is not to establish a link for the provision of radar services
- The various radar uses are strictly a function of FAA operational need. The facilities may be indistinguishable to pilots since they are all referred to as tower and no publication lists the degree of radar use
- Therefore, when in communication with a tower controller who may have radar available, do not assume that constant radar monitoring and complete ATC radar services are being provided
Non-towered Airports:
- All radio-equipped aircraft transmit/receive on a common frequency identified for the purpose of airport advisories; and
- Pilots use the correct airport name, as identified in appropriate aeronautical publications, to reduce the risk of confusion when communicating their position, intentions, and/or exchanging traffic information
- By communicating with an FSS; (FSS airport advisories are available only in Alaska
- A UNICOM operator, or;
- By making a self-announce broadcast
- Many airports are now providing completely automated weather, radio check capability and airport advisory information on an automated UNICOM system. These systems offer a variety of features, typically selectable by microphone clicks, on the UNICOM frequency. Availability of the automated UNICOM will be published in the Chart Supplement U.S. and approach charts
Airport Advisory/Information Services Provided by a FSS:

- Local Airport Advisory (LAA) is available only in Alaska and provided at airports that have a FSS physically located on the airport, which does not have a control tower or where the tower is operated on a - basis. The CTAF for LAA airports is disseminated in the appropriate aeronautical publications
- Remote Airport Information Service (RAIS) is provided in support of special events at nontowered airports by request from the airport authority
- Vero Beach radio, Centurion Six Niner Delta Delta is ten miles south, two thousand, landing Vero Beach. I have the automated weather, request airport advisory
- Vero Beach radio, Centurion Six Niner Delta Delta, ready to taxi to runway 22, VFR, departing to the southwest. I have the automated weather, request airport advisory
- All aircraft in the vicinity of an airport may not be in communication with the FSS
Information Provided by Aeronautical Advisory Stations (UNICOM):

- UNICOM is a non-government air/ground radio communication station which may provide airport information at public use airports where there is no tower or FSS
- If the UNICOM frequency is designated as the CTAF, it will be identified in appropriate aeronautical publications [ Figure 2 ]
UNICOM Communications Procedures
- Select the correct UNICOM frequency
- State the identification of the UNICOM station you are calling in each transmission
- Speak slowly and distinctly
- Report approximately 10 miles from the airport, reporting altitude, and state your aircraft type, aircraft identification, location relative to the airport, state whether landing or overflight, and request wind information and runway in use
- Report on downwind, base, and final approach
- Report leaving the runway
- FREDERICK UNICOM CESSNA EIGHT ZERO ONE TANGO FOXTROT 10 MILES SOUTHEAST DESCENDING THROUGH (altitude) LANDING FREDERICK, REQUEST WIND AND RUNWAY INFORMATION FREDERICK
- FREDERICK TRAFFIC CESSNA EIGHT ZERO ONE TANGO FOXTROT ENTERING DOWNWIND/BASE/ FINAL (as appropriate) FOR RUNWAY ONE NINER (full stop/touch-and-go) FREDERICK
- FREDERICK TRAFFIC CESSNA EIGHT ZERO ONE TANGO FOXTROT CLEAR OF RUNWAY ONE NINER FREDERICK
- FREDERICK UNICOM CESSNA EIGHT ZERO ONE TANGO FOXTROT (location on airport) TAXIING TO RUNWAY ONE NINER, REQUEST WIND AND TRAFFIC INFORMATION FREDERICK
- FREDERICK TRAFFIC CESSNA EIGHT ZERO ONE TANGO FOXTROT DEPARTING RUNWAY ONE NINER. "REMAINING IN THE PATTERN" OR "DEPARTING THE PATTERN TO THE (direction) (as appropriate)" FREDERICK
Self-Announce Position and/or Intentions:
- Self-announce is a procedure whereby pilots broadcast their position or intended flight activity or ground operation on the designated CTAF. This procedure is used primarily at airports which do not have an FSS on the airport. The self-announce procedure should also be used if a pilot is unable to communicate with the FSS on the designated CTAF. Pilots stating, "Traffic in the area, please advise" is not a recognized Self-Announce Position and/or Intention phrase and should not be used under any condition
- If an airport has a tower and it is temporarily closed, or operated on a part-time basis and there is no FSS on the airport or the FSS is closed, use the CTAF to self-announce your position or intentions
- Where there is no tower, FSS, or UNICOM station on the airport, use MULTICOM frequency 122.9 for self-announce procedures. Such airports will be identified in appropriate aeronautical information publications
Straight-in Landings:
- The FAA discourages VFR straight-in approaches to landings due to the increased risk of a mid-air collision. However, if a pilot chooses to execute a straight-in approach for landing without entering the airport traffic pattern, the pilot should self-announce their position on the designated CTAF approximately 8 to 10 miles from the airport and coordinate their straight-in approach and landing with other airport traffic. Pilots executing a straight-in approach (IFR or VFR) do not have priority over other aircraft in the traffic pattern, and must comply with the provisions of 14 CFR 91.113 (g), Right-of-way rules
Traffic Pattern Operations:
- All traffic within a 10-mile radius of a non-towered airport or a part-time-towered airport when the control tower is not operating, should monitor and communicate on the designated CTAF when entering the traffic pattern. Pilots operating in the traffic pattern or on a straight-in approach must be alert at all times to other aircraft in the pattern, or conducting straight-in approaches, and communicate their position to avoid a possible traffic conflict. In the airport traffic pattern and while on straight-in approaches to a runway, effective communication and a pilot's responsibility to see-and-avoid are essential mitigations to avoid a possible midair collision. In addition, following established traffic pattern procedures eliminates excessive maneuvering at low altitudes, reducing the risk of loss of aircraft control
- Reference FAA Advisory Circular (AC) 90-66, Non-Towered Airport Flight Operations
Practice Approaches:
- Pilots conducting practice instrument approaches should be particularly alert for other aircraft that may be departing in the opposite direction
- Departing the final approach fix, inbound (nonprecision approach) or departing the outer marker or fix used in lieu of the outer marker, inbound (precision approach);
- Established on the final approach segment or immediately upon being released by ATC;
- Upon completion or termination of the approach; and
- Upon executing the missed approach procedure
- Departing aircraft should always be alert for arrival aircraft coming from the opposite direction
- " Strawn traffic, Apache Two Two Five Zulu, [position] , [altitude] , [descending] or entering downwind/base/final (as appropriate) runway one seven full stop, touch-and-go, Strawn "
- " Strawn traffic, Apache Two Two Five Zulu clear of runway one seven Strawn "
- " Strawn traffic, Queen Air Seven One Five Five Bravo [location on airport] taxiing to runway two six Strawn "
- " Strawn traffic, Queen Air Seven One Five Five Bravo departing runway two six. Departing the pattern to the [direction] , climbing to [altitude] Strawn "
- Strawn traffic, Cessna Two One Four Three Quebec (position from airport) inbound descending through (altitude) practice (name of approach) approach runway three five Strawn
- Strawn traffic, Cessna Two One Four Three Quebec practice (type) approach completed or terminated runway three five Strawn
Communicating on a Common Frequency:

- FSS frequencies are available only in Alaska
- The CTAF frequency for a particular airport or area is contained in the Chart Supplement U.S., Alaska Supplement, Alaska Terminal Publication, Instrument Approach Procedure Charts, and Instrument Departure Procedure (DP) Charts
- Also, the CTAF frequency can be obtained by contacting any FSS
- Use of the appropriate CTAF, combined with a visual alertness and application of the following recommended good operating practices, will enhance safety of flight into and out of all uncontrolled airports
Recommended Traffic Advisory Practices:
- Pilots of inbound traffic should monitor and communicate as appropriate on the designated CTAF from 10 miles to landing. Pilots of departing aircraft should monitor/communicate on the appropriate frequency from start-up, during taxi, and until 10 miles from the airport unless the CFRs or local procedures require otherwise
- Pilots of aircraft conducting other than arriving or departing operations at altitudes normally used by arriving and departing aircraft should monitor/communicate on the appropriate frequency while within 10 miles of the airport unless required to do otherwise by the CFRs or local procedures. Such operations include parachute jumping/dropping, en route, practicing maneuvers, etc.
- In Alaska, pilots of aircraft conducting other than arriving or departing operations in designated CTAF areas should monitor/communicate on the appropriate frequency while within the designated area, unless required to do otherwise by CFRs or local procedures. Such operations include parachute jumping/dropping , en route, practicing maneuvers, etc.
Unavailability of Information from FSS or UNICOM:
- Should LAA by an FSS or Aeronautical Advisory Station UNICOM be unavailable, wind and weather information may be obtainable from nearby controlled airports via Automatic Terminal Information Service (ATIS) or Automated Weather Observing System (AWOS) frequency
Traffic Pattern Arrival:
- Complete the descent checklist
- At least 10 NM from the airport, attempt to determine the active runway
- Over fly the airport at 500-1,000' above traffic pattern altitude to observe traffic, wind direction indications, etc. to determine a runway to use
- At least 2 NM from the runway, enter the traffic pattern at traffic pattern altitude on a 45° entry to the downwind, maintaining a none-half mile distance from the runway on the downwind leg
- Complete the appropriate approach and landing procedure
- Maintain pattern altitude until abeam approach end of the landing runway on the downwind leg
Traffic Pattern Responsibilities:
Pilot responsibilities:.
- Acknowledges receipt of traffic advisories
- Informs controller if traffic in sight
- Advises ATC if a vector to avoid traffic is desired
- Does not expect to receive radar traffic advisories on all traffic. Some aircraft may not appear on the radar display. Be aware that the controller may be occupied with higher priority duties and unable to issue traffic information for a variety of reasons
- Advises controller if service is not desired
Controller Responsibilities:
- Issues radar traffic to the maximum extent consistent with higher priority duties except in Class A airspace
- Provides vectors to assist aircraft to avoid observed traffic when requested by the pilot
- Issues traffic information to aircraft in the Class B, C, and D surface areas for sequencing purposes
- Controllers are required to issue to each aircraft operating on intersecting or non-intersecting converging runways where projected flight paths will cross
Visual Indicators at Airports Without an Operating Control Tower:
- At those airports without an operating control tower, a segmented circle visual indicator system, if installed, (see AIM, Paragraph 4-1-9, Traffic Advisory Practices at Airports Without Operating Control Towers) is designed to provide traffic pattern information
Segmented Circle:

- Located in a position affording maximum visibility to pilots in the air and on the ground and providing a centralized location for other elements of the system [ Figure 7 ]
Wind Direction Indicators:

- A wind cone, wind sock, or wind tee installed near the operational runway to indicate wind direction. The large end of the wind cone/wind sock points into the wind as does the large end (cross bar) of the wind tee. In lieu of a tetrahedron and where a wind sock or wind cone is collocated with a wind tee, the wind tee may be manually aligned with the runway in use to indicate landing direction. These signaling devices may be located in the center of the segmented circle and may be lighted for night use. Pilots are cautioned against using a tetrahedron to indicate wind direction [ Figure 8 ]
- In the case of conflicting wind socks, consider their placement, obstacles that may cause interference, and which may have proximity to the runway
Landing Direction Indicator:
- A tetrahedron is installed when conditions at the airport warrant its use. It may be used to indicate the direction of landings and takeoffs. A tetrahedron may be located at the center of a segmented circle and may be lighted for night operations. The small end of the tetrahedron points in the direction of landing. Pilots are cautioned against using a tetrahedron for any purpose other than as an indicator of landing direction. Further, pilots should use extreme caution when making runway selection by use of a tetrahedron in very light or calm wind conditions as the tetrahedron may not be aligned with the designated calm-wind runway. At airports with control towers, the tetrahedron should only be referenced when the control tower is not in operation. Tower instructions supersede tetrahedron indications
Landing Strip Indicators:
- Installed in pairs as shown in the segmented circle diagram and used to show the alignment of landing strips
Traffic Pattern Indicators:
- Arranged in pairs in conjunction with landing strip indicators and used to indicate the direction of turns when there is a variation from the normal left traffic pattern. (If there is no segmented circle installed at the airport, traffic pattern indicators may be installed on or near the end of the runway)
- Preparatory to landing at an airport without a control tower, or when the control tower is not in operation, pilots should concern themselves with the indicator for the approach end of the runway to be used. When approaching for landing, all turns must be made to the left unless a traffic pattern indicator indicates that turns should be made to the right. If the pilot will mentally enlarge the indicator for the runway to be used, the base and final approach legs of the traffic pattern to be flown immediately become apparent. Similar treatment of the indicator at the departure end of the runway will clearly indicate the direction of turn after takeoff
- When two or more aircraft are approaching an airport for the purpose of landing, the pilot of the aircraft at the lower altitude has the right-of-way over the pilot of the aircraft at the higher altitude. However, the pilot operating at the lower altitude should not take advantage of another aircraft, which is on final approach to land, by cutting in front of, or overtaking that aircraft
Unexpected Maneuvers in the Airport Traffic Pattern:
- There have been several incidents in the vicinity of controlled airports that were caused primarily by aircraft executing unexpected maneuvers
- Controllers establish the sequence of arriving and departing aircraft by requiring them to adjust flight as necessary to achieve proper spacing
- These adjustments can only be based on observed traffic, accurate pilot reports, and anticipated aircraft maneuvers
- Pilots are expected to cooperate so as to preclude disrupting traffic flows or creating conflicting patterns
- The pilot-in-command of an aircraft is directly responsible for and is the final authority as to the operation of the aircraft
- On occasion it may be necessary for pilots to maneuver their aircraft to maintain spacing with the traffic they have been sequenced to follow
- The controller can anticipate minor maneuvering such as shallow "S" turns
- The controller cannot, however, anticipate a major maneuver such as a 360° turn
- If a pilot makes a 360° turn after obtaining a landing sequence, the result is usually a gap in the landing interval and, more importantly, it causes a chain reaction which may result in a conflict with following traffic and an interruption of the sequence established by the tower or approach controller
- Should a pilot decide to make maneuvering turns to maintain spacing behind a preceding aircraft, the pilot should always advise the controller if at all possible
- Except when requested by the controller or in emergency situations, a 360° turn should never be executed in the traffic pattern or when receiving radar service without first advising the controller
Private Pilot - Traffic Patterns Airman Certification Standards:
- To determine that the applicant exhibits satisfactory knowledge, risk management, and skills associated with traffic patterns
- References: 14 CFR part 91; FAA-H-8083-2, FAA-H-8083-25; AIM
- Traffic Pattern Lesson Plan
Traffic Patterns Knowledge:
Pa.iii.b.k1:, pa.iii.b.k2:, pa.iii.b.k3:, pa.iii.b.k4:, traffic patterns risk management:, pa.iii.b.r1:, pa.iii.b.r2:, pa.iii.b.r3:, traffic patterns skills:, pa.iii.b.s1:, pa.iii.b.s2:, pa.iii.b.s3:, pa.iii.b.s4:, pa.iii.b.s5:, pa.iii.b.s6:, conclusion:.
- The name says it all as the "pattern" is a predictable flow of traffic in a congested area
- Pilots of en route aircraft should be constantly on the alert for other aircraft in traffic patterns and avoid these areas whenever possible
- Increased traffic congestion, aircraft in climb and descent attitudes, and pilot preoccupation with the cockpit duties are some factors that increase the accident potential in the terminal area
- The situation is then further compounded when the weather is marginal
- Pilots must be particularly alert when operating in the vicinity of an airport
- Remember that it is not required to have a radio (and therefore make radio calls) prior to takeoff or landing at an uncontrolled airfield
- Always observe right-of-way rules
- Instances where an aircraft fails to (or even attempts) to takeoff and land on the wrong runway or taxiway generates a "wrong surface event" reporting
- Additional resources are available through tools such as the FAA's Runway Safety Simulator
- Tailwinds, and headwinds will effect an aircraft differently depending on the pattern direction and the specific leg of the pattern, lending to over and undershoots
- Traffic pattern not regulatory, making the PIC, not tower, responsible for cloud separation in pattern
- When crossing over the traffic pattern, account for piston traffic at 1000' AGL and also turbine aircraft at 1500' AGL
- Pilots should review the impacts of the impossible turn as part of traffic pattern operations
- Note that helicopters will often fly opposite patterns (left vs. right) as they are required by regulation to avoid the flow of fixed-wing traffic
- Still looking for something? Continue searching:
References:
- Advisory Circular (90-66) Non-Towered Airport Flight Operations
- Air Facts Journal - Where Is The Upwind Leg?
- Federal Aviation Administration - Pilot/Controller Glossary
- Advisory Circular (90-66) Recommended Standards Traffic Patterns for Aeronautical Operations at Airports without Operating Control Towers
- Aeronautical Information Manual (3-5-4) Parachute Jump Aircraft Operations
- Aeronautical Information Manual (4-1-8) Approach Control Service for VFR Arriving Aircraft
- Aeronautical Information Manual (4-1-9) Traffic Advisory Practices at Airports Without Operating Control Towers
- Aeronautical Information Manual (4-3-1) General
- Aeronautical Information Manual (4-3-2) Airports with an Operating Control Tower
- Aeronautical Information Manual (4-3-3) Traffic Pattern
- Aeronautical Information Manual (4-3-5) Unexpected Maneuvers in the Airport Traffic Pattern
- Aeronautical Information Manual (5-5-10) Traffic Advisories (Traffic Information)
- AOPA - Safety Quiz: Towered Airport Operations
- AOPA - Operations at Airports
- Federal Aviation Regulations (91.155) Basic VFR weather minimums
- Pilot Workshop - Traffic Pattern Rules
How travel demand modeling gets a boost from on-demand traffic data analytics
What is travel demand modeling.
Travel demand models use current travel behavior to predict future travel patterns from a sample of travel behavior data. As you might expect, models are critical tools for planners and engineers who use them to forecast the transportation needs of the communities they serve. They also help transportation professionals assess the pros and cons of different options for meeting those needs.
Is Travel Demand Modeling the same thing as transportation modeling?
Travel demand models are a subset of transportation models that specifically focus on — you guessed it — travel demand. They are commonly developed within a region or, more broadly, across an entire state. The regional “demand” for trip-making, informed by land use and economic conditions, and the “supply” of the transportation network determine when, where, and how trips are made within a region. These existing travel conditions can be extrapolated to various future scenarios to predict the impacts of transportation policy and infrastructure improvements.
But other types of transportation models also use mobility data to predict future travel patterns based on current inputs. The scale and complexity of these models can vary significantly, depending on the data inputs available and the level of detail required from the model forecasts. Outputs from these models can inform decisions ranging from traffic signal timing at an intersection to congestion management policies on a corridor to multi-billion dollar highway or transit infrastructure investments.
Transportation models are a critical tool utilized by planners, engineers, and decision-makers to understand the performance of a transportation network today so that the impacts of future changes in demographics, land use, policy decisions, and infrastructure improvements can be forecasted for different future scenarios. For example, a microsimulation model may use existing travel behaviors to predict how localized roadway changes (such as work zones or detours) will impact weaving, congestion, speeding, and other traffic patterns.
Other transportation modeling use cases include:

Getting the right data for travel demand models
Travel demand models — and transportation models in general— are only as accurate as their input data. Without an accurate understanding of real-world conditions today, planners and engineers cannot predict future demand.
Traditional data collection methods like physical sensors and surveys help gather information about existing conditions, but they’re also expensive and time-consuming to implement . This means these methods must be targeted at high-priority locations and may cover only a brief time period, resulting in low sample sizes that limit the precision of travel demand models.
On-demand transportation analytics — or “big data” analytics — address these limitations by using data collected from Connected Devices and the Internet of Things (IoT) to generate larger and more granular datasets that cover any road or time period. When used alongside traditional data collection methods, they help fill data gaps and enhance the efficacy of travel demand models .
In this guide, we’ll explore how travel demand models are built and calibrated and how transportation analytics help modelers get more actionable insights from these models.
WEBINAR: Build effective travel demand models with data that reflects changing mobility
Creating travel demand models
There are many ways to build a model, but no matter what, building accurate travel demand models requires detailed information about:
- Where groups of people go
- The ways their travel behavior changes during specific conditions
Traditionally, travel demand models use a four-step process to analyze regional transportation planning:
- Trip generation (the number of trips to be made)
- Trip distribution (where those trips go)
- Mode choice (how the trips will be divided among the available modes of travel)
- Trip assignment (predicting the route trips will take)
The results obtained through this four-step process vary widely, since they depend on the quality of the assumptions and data used, as well as the particular model’s sophistication. Micro models , or “microsimulations,” for small areas usually give users an estimate of highway volumes for individual roadways or intersections, where as “macro” and “meso” models look at entire counties, regions, and even state and multi-state geographies.
In the following example, traffic engineers with WSP USA used Big Data to build and calibrate a microsimulation to understand post-COVID travel demand on I-75 in Phoenix, looking specifically at weaving during peak hours and traffic interchange with a nearby highway.
No matter their size, the most sophisticated models incorporate and analyze highly granular data, such as commercial truck activity, HOV lane usage, tolling behavior, and more. Route choice between the same two locations, for example, can vary dramatically depending on time of day and other factors that influence drivers.
To illustrate, let’s say that our friend Sarah needs to drive from her home in Pittsburgh’s east end to the downtown business district. Most of the time, she finds Penn Avenue to be the fastest and most enjoyable route, but she also knows it is foolish to take that route during rush hour, a sports game, a major concert, or a visit from the President.
Ultimately, accurate travel demand models require quality input data. Outdated or incomplete data results in imprecise models, and your predictions could fail to account for the decisions that drivers like Sarah make almost subconsciously.
Using Big Data for origin-destination matrices
One of the most important data inputs for any model is an origin-destination (“O-D”) matrix—data that tells you where people are coming from (origin) and where they are going (destination) after visiting or passing through a specific location. In the past, planners utilized surveys, a set of “gravity” assumptions, and/or license plate studies to create O-D matrices, which are all costly and typically have small sample sizes.
Transportation experts can now use on-demand traffic data to quickly create precise, accurate and comprehensive O-D matrices , using algorithmic techniques that analyze trillions of data points and organize them by location and time stamp.
When transportation experts have analytics that incorporate this many data points, they can create traditional O-D matrices that represent a far greater percentage of the population and a longer timespan than could be captured through surveys or license plate studies. Planners can also capture short trips more accurately, like a quick run into the grocery store while on the commute home. Those types of short trips tend to get undercounted or completely overlooked in a typical travel survey.
In a nutshell, trips and series of activities are created by:
- Identifying the pings that occur when Connected Vehicles and IoT devices begin moving (the origins);
- Following the series of pings that occur as these vehicles or devices move (the route); and
- Identifying the final pings when vehicles or devices come to rest (the destinations).
It’s important, however, to recognize that these data points are messy at the outset. No single person could manage trillions of data points using Microsoft Excel! That means sophisticated processing techniques are critical to making these data sets manageable and effective for planning transportation projects.
Using on-demand analytics for these matrices helps deliver the fine resolution needed for accurate travel demand modeling. But that’s only the beginning. Trip data (such as the time stamps that identify home and work locations) can be combined with contextual data sets, such as parcel boundaries and aggregate demographic information from the Census. Now, your traditional O-D matrices can be analyzed in terms of trip purpose.
Inferring trip purpose
Trip purpose is also a key input for transportation modelers to consider. With Big Data, you can infer why groups of people travel from one location to another by analyzing aggregated behavior over a longer period. Big Data can help you estimate the portion of trips in a study that are:
- Home-Based Work: Travel between home and work in either direction
- Home-Based Other: Travel to and from the home, to anywhere other than work
- Non-Home Based: All travel not to or from home
For example, StreetLight InSight ® — that’s StreetLight Data’s interactive, online platform that aggregates and simplifies those trillions of data points — can provide the trip purposes for the purposes listed above for any O-D matrix in just a few minutes.
Planners can benefit from our Home-Work Trip Purpose Metrics because they no longer need to get this information from models or surveys, which are expensive to conduct and typically have low response rates. With comprehensive analytics derived from Big Data, planners can now gather spatially precise trip purpose information using real-world data. For example, when creating a traditional, four-step, Travel Demand Model, the Home-Work Trip Purpose Metric will be a huge asset.
Data requirements for dynamic traffic assignment
Another great modeling technique where one can use Big Data is Dynamic Traffic Assignment (DTA). DTA is better at modeling user response to issues such as peak spreading, freight analysis, and congestion at fine resolutions. But DTA is a meticulous modeling technique, so it requires detailed, rigorous data to be done right. The old approach requires collection from at least 6 different sources, and many of them are very cumbersome and expensive. It also requires a huge effort to integrate, calibrate, and check that data integration. The result is not only expensive and time consuming, but also has a lot of assumptions. It’s simply clunky and messy.
Working with Big Data, you can attack DTA with a direct, data-driven approach. Using fine-tuned origin-destination studies based on Big Data, modelers can uncover precise analytics such as how left-hand turns are affected by time of day and type of trip . Route choice can vary dramatically by time of day, so understanding the ways that behavior changes during specific conditions is critical to building accurate models.
This detailed modeling technique is particularly effective for modeling user response to issues such as peak spreading, freight analysis and congestion, in fine resolution. To be effective, however, DTA modeling requires detailed, rigorous data. When you use location data from mobile devices, you can get the information you need to create a DTA quickly and easily.
Stay ahead of fast-changing mobility trends with effective travel demand models
Big Data integration with other modeling tools
Beyond Big Data being a great source of information on its own, it can also be easily integrated into other modeling and simulation tools . CSV files of our Metrics can be downloaded directly from StreetLight InSight®, and then users can input that information into their preferred modeling tools . We have also developed easy-to-use transportation APIs , including the StreetLight InSight® API that can be used to integrate our analytics into many mapping and modeling tools.
Real-world case studies
Hundreds of transportation agencies are benefiting from using Big Data in travel demand models. It’s helping them understand travel behavior more comprehensively, precisely, and accurately. If your goals are to collect high-quality data cost-effectively, there is no better way to understand group travel patterns.
For example, when the City of Edmonton, Canada was unable to run its typically active annual traffic count program due to COVID, access to on-demand traffic data helped fill the gap and zero in on pandemic-driven shifts in travel behaviors, calibrating their model to these recent changes and allowing for more actionable insights to guide infrastructure projects and temporary traffic measures.

Similarly, in the video below, you’ll see how an AEC firm used on-demand analytics to update the Butte County Association of Governments (BCAG) travel demand model, using O-D analyses and Zone Activity analyses to understand interregional travel, paying special attention to key tourist and special event destinations.
Beyond travel demand modeling
As we’ve discussed, Big Data is an essential tool for understanding the ways behavior changes during specific conditions, and building accurate travel demand models. But there are a number of other applications that are transforming transportation.
Here are seven other ways to harness the power of Big Data in your planning and projects:
- Build climate-forward infrastructure and decarbonize transportation
- Diagnose and mitigate traffic congestion
- Improve mobility on high-priority corridors
- Win federal grant funding for infrastructure projects
- Eliminate traffic fatalities and make streets safer
- Build equity-first transportation systems
Claim Your Free Consultation
Schedule your no-strings consultation to explore how digital analytics can help future-proof mobility in your region.
General Inquiries:
Contact streetlight, partnership inquiries:, [email protected], join the conversation, subscribe to insights & research.
Please provide your contact information so we can send the latest insights and research from StreetLight to your inbox; you can unsubscribe at any time.
- About StreetLight
- Website Privacy Notice
GETTING STARTED
- Why StreetLight
- Read Customer Stories
- Schedule a Demo
- StreetLight InSight® LOGIN
- StreetLight Training Portal
- Help Center
- Community Forum
- Customer Care
Copyright © 2011 - 2023, StreetLight Data, Inc. 4 Embarcadero Center Suite 3800 San Francisco, CA 94105. All rights reserved. Website Privacy Notice | Open Source
- How It Works
- Cost Savings
- 3rd Party Validations
- Testimonials
- AADT Traffic Counts
- Origin-Destination
- Turning Movement Counts
- Advanced Traffic Counts
- More Metrics…
- Personal Vehicles
- Bicycle & Pedestrian
- Bus & Rail
- Commercial Truck
- Delegate the work to us
- Get Data Driven Insights
- Developer Resources
- Transportation Planning
- Traffic Engineering & Operations
- Electric Vehicles (EVs)
- New Mobility Deployment
- Ride Hailing & Delivery
- AVs & UAM
- Financial Services
- Retail & Real Estate
- Climate Solutions
Congestion Management
Corridor studies, transportation modeling, roadway volumes, intersection studies.
- Grant Solutions
Safety Studies
- Social Equity
- Data Privacy
- Partnerships
- University Research
- Case Studies
- Research Reports
- White Papers
- Support & Training
Save time without relying on outdated equipment and get instant granular counts for any intersection at any time on any day.
Modes included:
Metrics included:
Total, Inbound, and Outbound Intersection Traffic Volumes, AM/PM Peak Hours, Peak Hour Factor
All plans include:
24/7 access to StreetLight InSight® & 100% coverage of Traffic Analysis Zones
Business Consulting & Services
Enhance value to clients with location intelligence and mobility insights informed by granular, validated transportation data..
Real Estate Site Selection, Portfolio Analysis, Due Diligence
Key metrics:
Vehicle, Truck, Pedestrian, Bicycle, and Transit Travel Patterns
Private Transportation
Model demand for your mobility service – airline, evtol, train, micro-mobility, and more – to plan routes and hubs that capture your target customers..
Travel Demand Modeling, Hub Site Selection, Route Planning
Origin-Destination, Travel Patterns for many modes, Demographics and Trip Purpose
Electric Vehicles, Energy & Utilities
Future-proof your electric vehicle infrastructure and investments with data-driven insights..
Electric Vehicle Infrastructure Site Selection, Grid Planning
Traffic Volumes, Trip Length, Travel Time, Dwell Time, EV Travel Patterns, Demographics
Technology, Data & Analytics
Uplevel your location intelligence solutions by partnering with streetlight to incorporate validated mobility metrics into your platform, models, or services., hospitality &tourism, analyze seasonal visitation to your region or property to forecast future tourism and manage traffic impacts..
Visitation, Cut-Through Analysis, Congestion Management
Traffic Counts, Origin-Destination, Top Routes for Travelers, Vehicle Speed
Position your projects for success with turnkey access to defensible and validated traffic counts for all roadways.
Average Annual Daily Traffic (AADT) and more
Active Transportation
Get the reliable data you need to justify your active transportation decisions and build infrastructure that reflects the reality of today..
Volume/Traffic Counts, Origin-Destination, Select Link, Speed, Demographics, Travel Time, and more
Develop, calibrate, and validate your travel demand models’ granular analytics to ensure that your models properly forecast travel patterns.
Volume/Traffic Counts, Origin-Destination, Select Link, Demographics, Trip Purpose, and more
Truck Studies
Measure up-to-date truck activity across all road types to identify congestion bottlenecks and evaluate the economic impact..
Volume, Travel Time, Trip Length, Origin-Destination, Routing, Vehicle Classification, and more
Diagnose traffic patterns for all hours of the day to develop data-informed strategies that mitigate traffic congestion.
Volume, Vehicle Miles Traveled (VMT), Vehicle Hours of Delay (VHD), Planning Index, Buffer Time Index, Travel Time, Speed, and more
Traffic Calming & Management
Easily fill data gaps, address residents’ top concerns, and justify infrastructure initiatives with insights into local and residential roads..
Volume, VMT/VKT, Speed, VHD, Congestion, Travel Time, Trip Length, Speed and Travel Time Percentiles, Demographics, and more
Visitation Studies
Effectively manage operations by accessing on-demand visitation metrics that show when, how, and from where people travel to key sites..
Volume, Trip Origins, Travel Time, Trip Length, Trip Speed, Traveler Demographics, Home and Work locations
Passenger Rail Studies
Evaluate network ridership for any time of day or day of week to help prioritize projects and advocate for bus and rail improvements..
Ridership, Travel Time, Origin-Destination Pairs, Rider Demographics
Retail & Restaurant
Choose the best locations for your business with mobility analytics that pinpoint customer demand to drive sales.
Key use cases:
Site Selection, Trade Area Analysis, Electric Vehicle Charger Site Selection
Traffic Counts, Trip Purpose, Demographics, Top Routes
Automotive Aftermarket & Fueling
Understand demand for your automotive product or service with validated nationwide vehicle travel patterns..
Supply Chain and Inventory Management, Market Research & Demand Forecasting
VMT / VKT, Personal and Commercial Vehicle Roadway Volumes, Fleet Characteristics
Leverage powerful multimodal insights to zero in on opportunities to keep your community safe and equitable.
Volume, VMT/VKT, Speed, VHD, Congestion, Travel Time, Demographics, Trip Purpose, Speed and Travel Time Percentiles, and more
Run multiple analyses for the same corridor in a few clicks to ensure that you are solving problems with a macro- and micro-level lens.
Volume, VMT/VKT, Speed, VHD, Congestion, Travel Time, and more
Analyze traffic patterns on popular routes near toll roads to evaluate the impact of toll changes on congestion, accessibility, and safety.
Origin-Destination, Top Routes between locations, Trip Speed, Travel Time, Trip Length, Traveler Demographics
Trip chaining patterns of tourists: a real-world case study
- Published: 14 September 2023
Cite this article

- Cong Qi 1 ,
- Jonas De Vos 2 ,
- Tao Tao 3 ,
- Linxuan Shi 4 &
- Xiucheng Guo 1
392 Accesses
3 Altmetric
Explore all metrics
Insights into tourist travel behaviours are crucial for easing traffic congestions and creating a sustainable tourism industry. However, a significant portion of the literature analysed tourist travel behaviour by predefined tourist trip chains which result in the loss of more representative classification. Using tourist travel survey data from Nanjing, China, this paper presents an innovative methodology that combines the tourist trip chain identification and the trip chain discrete choice model to comprehensively analyse the travel behaviour of tourists. The discretized trip chains of tourists are clustered using the ordering points to identify the clustering structure (OPTICS) clustering algorithm to identify typical tourist trip chains, which will then be considered as the dependent variable in the nested logit model to estimate the significant explanatory variables. The clustering results show that there are two main categories, namely single and multiple attraction trip chains, and seven subcategories, which were named according to the characteristics of trip chains. The clustering result is analysed and three main trip chain patterns are derived. Departure city, travel cost, travel time, and travel mode show significant influence on the choice between single and multiple attraction trip chains. The urban attraction trip chain is more favoured by tourists with children, and the typical trip chain shows stronger dependence on travel intention. Visiting Lishui for the first time only affects the choice of the multiple suburban attraction trip chain. These findings are valuable for optimising tourist public transport infrastructure, promoting travel by public transport and better tourism management.
This is a preview of subscription content, log in via an institution to check access.
Access this article
Price includes VAT (Russian Federation)
Instant access to the full article PDF.
Rent this article via DeepDyve
Institutional subscriptions
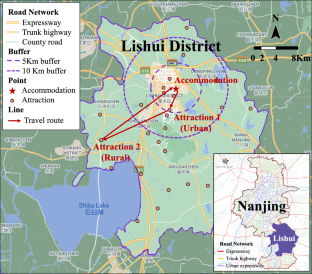
Trip chaining propensity and tour mode choice of out-of-home workers: evidence from a mid-sized Canadian city

A tour-based analysis of travel mode choice accounting for regional transit service

Role of the built environment on trip-chaining behavior: an investigation of workers and non-workers in Halifax, Nova Scotia
Afshardoost, M., Eshaghi, M.S.: Destination image and tourist behavioural intentions: a meta-analysis. Tour. Manag. 81 , 104154 (2020). https://doi.org/10.1016/j.tourman
Article Google Scholar
Ankerst, M., Breunig, M.M., Kriegel, H.-P., et al.: OPTICS: ordering points to identify the clustering structure. ACM SIGMOD Conf. 28 (2), 49–60 (1999). https://doi.org/10.1145/304182.304187
Balac, M., Horl, S., Schmid, B.: Discrete choice modeling with anonymized data. Transportation (2022). https://doi.org/10.1007/s11116-022-10337-1
Bautista-Hernández, D.A.: Individual, household, and urban form determinants of trip chaining of non-work travel in México City. J. Transp. Geogr. 98 , 103227 (2022). https://doi.org/10.1016/j.jtrangeo.2021.103227
Chen, X., Wan, X., Li, Q., et al.: Trip chain based travel mode shares driven framework using cellular signaling data and web based mapping service data. Transp. Res. Rec. 2673 (3), 51–64 (2019). https://doi.org/10.1177/0361198119834006
Chen, Y., Dai, Y., Liu, A., et al.: Can the COVID-19 risk perception affect tourists’ responsible behavior intention: an application of the structural equation model. J. Sustain. Tour. (2021). https://doi.org/10.1080/09669582.2021.1977938
Daisy, N.S., Millward, H., Liu, L.: Trip chaining and tour mode choice of non-workers grouped by daily activity patterns. J. Transp. Geogr. 69 , 150–162 (2018). https://doi.org/10.1016/j.jtrangeo.2018.04.016
Daisy, N.S., Liu, L., Millward, H.: Trip chaining propensity and tour mode choice of out-of-home workers: evidence from a mid-sized Canadian city. Transportation 47 (2), 763–792 (2020). https://doi.org/10.1007/s11116-018-9915-2
Duan, Z., Wang, C., Zhang, H.M., et al.: Using longitudinal mobile phone data to understand the stability of individual travel patterns. Transp. Res. Rec. 2643 (1), 166–177 (2017). https://doi.org/10.3141/2643-18
Feng, X., Sun, H., Wu, J., et al.: Trip chain based usage patterns analysis of the round trip carsharing system: a case study in Beijing. Transp. Res. Part A Policy Pract. 140 , 190–203 (2020). https://doi.org/10.1016/j.tra.2020.08.017
Gao, G., Sun, H., Wu, J.: Activity based trip chaining behavior analysis in the network under the parking fee scheme. Transportation 46 (3), 647–669 (2019). https://doi.org/10.1007/s11116-017-9809-8
García, J., Juaneda, C., Raya, J.M., et al.: A study of traveller decision making determinants: prioritizing destination or travel mode? Tour. Econ. 21 (6), 1149–1167 (2015). https://doi.org/10.5367/te.2015.0517
Gross, S., Grimm, B.: Sustainable mode of transport choices at the destination public transport at German destinations. Tour. Rev. 73 (3), 401–420 (2018). https://doi.org/10.1108/tr-11-2017-0177
Gutiérrez, A., Miravet, D.: The determinants of tourist use of public transport at the destination. Sustainability 8 (9), 908 (2016). https://doi.org/10.3390/su8090908
Hahsler, M., Piekenbrock, M., Doran, D.: Dbscan: fast density based clustering with R. J. Stat. Softw. 91 (1), 1–30 (2019). https://doi.org/10.18637/jss.v091.i01
Halat, H., Zockaie, A., Mahmassani, H.S., et al.: Dynamic network equilibrium for daily activity-trip chains of heterogeneous travelers: application to large-scale networks. Transportation 43 (6), 1041–1059 (2016). https://doi.org/10.1007/s11116-016-9724-4
Hedau, A.L., Sanghai, S.S.: Development of trip generation model using activity based approach. Int. J. Civil Struct. Environ. Infrastruct. Eng. Res. Dev. 4 (3), 61–77 (2014)
Google Scholar
Hermawati, P., Adisasmita, S.A., Ramli, M.I., et al.: Choices models of trip chain and transportation mode for international tourists in tourism destination island. Int. J. Geomate (2019). https://doi.org/10.21660/2019.55.88460
Karl, M.: Risk and uncertainty in travel decision making: tourist and destination perspective. J. Travel Res. 57 (1), 129–146 (2018). https://doi.org/10.1177/0047287516678337
Khan, M., Machemehl, R.B.: Analyzing tour chaining patterns of urban commercial vehicles. Transp. Res. Part A Policy Pract. 102 , 84–97 (2017). https://doi.org/10.1016/j.tra.2016.08.014
Kieu, L.M., Bhaskar, A., Chung, E.: Passenger segmentation using smart card data. IEEE Trans. Intell. Transp. Syst. 16 (3), 1537–1548 (2015). https://doi.org/10.1109/tits.2014.2368998
Kim, H.-R., Yi, C., Jang, Y.: Relationships among overseas travel, domestic travel, and day trips for latent tourists using longitudinal data. Tour. Manage. 72 , 159–169 (2019). https://doi.org/10.1016/j.tourman.2018.11.018
Kim, S., Lee, S., Ko, E., et al.: Changes in car and bus usage amid the COVID-19 pandemic: relationship with land use and land price. J. Transp. Geogr. (2021). https://doi.org/10.1016/j.jtrangeo.2021.103168
Krizek, K.J.: Neighborhood services, trip purpose, and tour based travel. Transportation 30 (4), 387–410 (2003). https://doi.org/10.1023/a:1024768007730
Lew, A.A., McKercher, B.: Modeling tourist movements: a local destination analysis. Ann. Tour. Res. 33 (2), 403–423 (2006). https://doi.org/10.1016/j.annals.2005.12.002
Li, L., Cao, M., Yin, J., et al.: Observing the characteristics of multi activity trip chain and its influencing mechanism. KSCE J. Civ. Eng. 24 (11), 3447–3460 (2020). https://doi.org/10.1007/s12205-020-1927-8
Lue, C.C., Crompton, J.L., Fesenmaier, D.R.: Conceptualization of multi-destination pleasure trips. Ann. Tour. Res. 20 (2), 289–301 (1993). https://doi.org/10.1016/0160-7383(93)90056-9
Ma, X., Wu, Y.J., Wang, Y., et al.: Mining smart card data for transit riders’ travel patterns. Transp. Res. Part C Emerg. Technol. 36 , 1–12 (2013). https://doi.org/10.1016/j.trc.2013.07.010
Ma, X., Wang, Y., McCormack, E., et al.: Understanding freight trip chaining behavior using a spatial data mining approach with GPS data. Transp. Res. Rec. 2596 , 44–54 (2016). https://doi.org/10.3141/2596-06
Mariante, G.L., Ma, T.-Y., Van Acker, V.: Modeling discretionary activity location choice using detour factors and sampling of alternatives for mixed logit models. J. Transp. Geogr. 72 , 151–165 (2018). https://doi.org/10.1016/j.jtrangeo.2018.09.003
Miao, L., Im, J., Fu, X., et al.: Proximal and distal post-COVID travel behavior. Ann. Tour. Res. 88 , 103159 (2021). https://doi.org/10.1016/j.annals.2021.103159
Nanni, M., Pedreschi, D.: Time-focused clustering of trajectories of moving objects. J. Intell. Inform. Syst. 27 (3), 267–289 (2006). https://doi.org/10.1007/s10844-006-9953-7
Oppermann, M.: A model of travel itineraries. J. Travel Res. 33 (4), 57–61 (1995). https://doi.org/10.1177/004728759503300409
Pop, R.-A., Saplacan, Z., Dabija, D.-C., et al.: The impact of social media influencers on travel decisions: the role of trust in consumer decision journey. Curr. Issues Tour. (2021). https://doi.org/10.1080/13683500.2021.1895729
Qi, C., Zhu, Z., Guo, X., et al.: Examining interrelationships between tourist travel mode and trip chain choices using the nested logit model. Sustainability. 12 (18), 7535 (2020). https://doi.org/10.3390/su12187535
Scheiner, J., Holz-Rau, C.: Women’s complex daily lives: a gendered look at trip chaining and activity pattern entropy in Germany. Transportation 44 (1), 117–138 (2017). https://doi.org/10.1007/s11116-015-9627-9
Schneider, F., Ton, D., Zomer, L.-B., et al.: Trip chain complexity: a comparison among latent classes of daily mobility patterns. Transportation 48 (2), 953–975 (2021). https://doi.org/10.1007/s11116-020-10084-1
Shiftan, Y.: Practical approach to model trip chaining. Transp. Res. Rec. 1645 , 17–23 (1998). https://doi.org/10.3141/1645-03
Talwar, S., Srivastava, S., Sakashita, M., et al.: Personality and travel intentions during and after the COVID-19 pandemic: an artificial neural network (ANN) approach. J. Bus. Res. (2021). https://doi.org/10.1016/j.jbusres.2021.12.002
Tang, X., Wang, D., Sun, Y., et al.: Choice behavior of tourism destination and travel mode: a case study of local residents in Hangzhou, China. J. Transp. Geogr. 89 , 102895 (2020). https://doi.org/10.1016/j.jtrangeo.2020.102895
Tanjeeb, A., Hyland, M.: Exploring the role of ride hailing in trip chains. Transportation 50 , 959–1002 (2022). https://doi.org/10.1007/s11116-022-10269-w
Vu, H.Q., Li, G., Law, R., Ye, B.H.: Exploring the travel behaviors of inbound tourists to Hong Kong using geotagged photos. Tour. Manage. 46 , 222–232 (2015). https://doi.org/10.1016/j.tourman.2014.07.003
Wong, I.A., Fong, L.H.N., Law, R.: A longitudinal multilevel model of tourist outbound travel behavior and the dual cycle model. J. Travel Res. 55 (7), 957–970 (2016). https://doi.org/10.1177/0047287515601239
Wong, I.A., Law, R., Zhao, X.: Time variant pleasure travel motivations and behaviors. J. Travel Res. 57 (4), 437–452 (2018). https://doi.org/10.1177/0047287517705226
Wu, L., Zhang, J., Fujiwara, A.: Dynamic analysis of Japanese tourists’ three stage choices: tourism participation, destination choice, and travel mode choice. Transp. Res. Rec. 2322 , 91–101 (2012). https://doi.org/10.3141/2322-10
Xiang, Z., Magnini, V.P., Fesenmaier, D.R.: Information technology and consumer behavior in travel and tourism: insights from travel planning using the internet. J. Retail. Consum. Serv. 22 (1), 244–249 (2015). https://doi.org/10.1016/j.jretconser.2014.08.005
Yang, Y., Fik, T.J., Zhang, J.: Modeling sequential tourist flows: where is the next destination? Ann. Tour. Res. 43 , 297–320 (2013). https://doi.org/10.1016/j.annals.2013.07.005
Yang, L., Shen, Q., Li, Z.: Comparing travel mode and trip chain choices between holidays and weekdays. Transp. Res. Part A Policy Pract. 91 , 273–285 (2016). https://doi.org/10.1016/j.tra.2016.07.001
Download references
This research was funded by Postgraduate Research&Practice Innovation Program of Jiangsu Province, Grant Number KYCX23_0303.
Author information
Authors and affiliations.
School of Transportation, Southeast University, No.2 Dongnandaxue Road, Nanjing, 211189, China
Cong Qi & Xiucheng Guo
Bartlett School of Planning, University College London, 14 Upper Woburn Place, London, WC1H 0NN, UK
Jonas De Vos
Department of Civil and Environmental Engineering, Carnegie Mellon University, Pittsburgh, PA, 55454, USA
Department of Civil and Environmental Engineering, The George Washington University, Washington, DC, 20052, USA
Linxuan Shi
You can also search for this author in PubMed Google Scholar
Contributions
CQ: conceptualization, investigation, formal analysis, methodology, writing—original draft, resources, software. JDV: project administration, supervision, writing—review and editing. TT: validation, writing—review and editing. XG: formal analysis, funding acquisition. LS: data curation, visualization.
Corresponding author
Correspondence to Xiucheng Guo .
Ethics declarations
Conflict of interest.
Conflict of interest on behalf of all authors, the corresponding author states that there is no conflict of interest.
Additional information
Publisher's note.
Springer Nature remains neutral with regard to jurisdictional claims in published maps and institutional affiliations.
Rights and permissions
Springer Nature or its licensor (e.g. a society or other partner) holds exclusive rights to this article under a publishing agreement with the author(s) or other rightsholder(s); author self-archiving of the accepted manuscript version of this article is solely governed by the terms of such publishing agreement and applicable law.
Reprints and permissions
About this article
Qi, C., De Vos, J., Tao, T. et al. Trip chaining patterns of tourists: a real-world case study. Transportation (2023). https://doi.org/10.1007/s11116-023-10418-9
Download citation
Accepted : 15 August 2023
Published : 14 September 2023
DOI : https://doi.org/10.1007/s11116-023-10418-9
Share this article
Anyone you share the following link with will be able to read this content:
Sorry, a shareable link is not currently available for this article.
Provided by the Springer Nature SharedIt content-sharing initiative
- Travel behaviour
- OPTICS cluster
- Nested logit model
- Find a journal
- Publish with us
- Track your research
What Is Road Pattern ? Types Of Road Pattern & Advantages
What is road pattern.
Road pattern is a particular style of development of road networks, connecting various places. Different types of road patterns are considered during the process of town planning. After selecting the suitable road pattern the development of the road network is started.
The main objective of road patterns is to make conveyance easy for the public and to interconnect the roads and various places in the city, town, or village.
Every city and country follows a specific pattern of the road network to connect the roads and the places around it. The selection of the road patterns for a specific city is done based on the layout of the city.
The main principle of the road pattern is to decrease the distance between two destinations and to reduce the time to reach from one place to another. Road patterns are responsible for the traffic management of a region.
Powered By BEdigitech
Types Of Road Pattern
Given below are different types of road patterns:
- Rectangular or Block Pattern.
- Radial Pattern
- Hexagonal Pattern
- Minimum travel Pattern
Let us learn about each of the given road patterns, in detail below:
1. Rectangular Or Block Pattern:
In a rectangular or block pattern, the whole area is divided into rectangular or block-shaped plots. The roads and streets in block patterns intersect at 90° (right angle). The roads in the Centre part of the grid are usually wider and their branch roads are relatively narrow in width.
The rectangular or block pattern of the road is normally considered as unsafe as the vehicles meet in the opposite direction at the intersections. The chances of accidents are higher in rectangular or block patterns.
The rectangular or block pattern gives a decent view when observed from a height. The geometry of the rectangular pattern is relatively easy to understand.

Advantages Of Rectangular Or Block Pattern:
- It is relatively easier to construct and maintain.
- The rectangular plots can be divided into smaller parts for the construction of buildings .
- It looks aesthetically pleasing.
Disadvantages Of Rectangular Or Block Pattern:
- From a safety point of view, these roads are not considered safe.
2. Radial Pattern
The radial pattern of the road network is the circular type of pattern.
Depending on its layout, the radial pattern is further divided into three types. They are as follows:
- Radial or star and block pattern.
- Radial or star and circular pattern.
- Radial or star and grid pattern.
a. Radial Or Star And Block Pattern:
This type of road pattern is basically the combination of radial and block patterns. A network of roads radiates from the center in the outwards direction with a block pattern.
The space between the networks of roads can be utilized for the construction and development of the area, town, or city.

Advantages:
- It is safer compared to a rectangular pattern.
- Less obstacles.
Disadvantages:
- This type of road pattern is effective when two-lane ramp traffic does not have to merge at the downstream end of the ramp.
b. Radial Or Star and Circular Pattern:
It is a combination of radial and circular patterns. The main roads in this network spread out from a central point and are connected with concentric circular roads, radiating in outwards directions.

- This pattern is safer than the above-listed patterns as the vehicles travel in the same direction.
- Better traffic management due to the presence of roundabouts.
- Its design is complex and it is quite challenging to provide a good and required curve .
- Driving ability is affected due to its circular shape.
c. Radial Or Star And Grid Pattern:
It is a network of roads consisting of a combination of radial and grid patterns. A radial network of roads spreads out from the center to the outwards directions. Then the radial streets are connected using a grid pattern.

- Reduction of cut-through traffic.
- Efficient use of land.
- Construction cost is higher.
3. Hexagonal Pattern
A hexagonal pattern is a network of roads that forms a hexagonal shape, similar to a circular road pattern. At every corner of the hexagon, three roads meet the built-up area . Boundary by the sides of hexagon is further divided into plots of suitable sizes.

- The distance and the travel time are reduced.
- Congestion of traffic is minimized.
- Traffic signs, lighting, and road markings should be properly and adequately provided. To minimize the risk of accidents.
4. Minimum Travel Pattern
A minimum travel pattern is also known as a linear pattern. In a linear pattern, the road network is spread out in a linear direction (one direction) due to the presence of some natural features such as the sea or ocean on one side of the city.

Types Of Roads – Classification Of Roads
Types Of Alignments In Road
Types Of Camber Used In Road
What is wbm (water macadam road).
If you like this article, please share it with your friends & also like our Facebook Page and join our Telegram Channel .
Share this:

Leave a Comment Cancel reply
CivilJungle
What Is Road Pattern | Different Types of Road Patterns | Grid Pattern Definition | Radial Pattern | Rectangular or Block Pattern | Minimum Travel Pattern
12th August 2023

Introduction of Road Pattern
Important Point

However, recent development in cities does not give importance to the study of the road patterns, sometimes referred to as road pattern in highway engineering , that give rise to numerous roads that are not interconnected, housing schemes, and commercial developments built far away from where roads are very distant from the centre of the town.
The increasing distance between the residential and commercial hub of the city increases the dependency upon cars for the daily travel chores each household member makes frequently .
The roadway patterns also increase the response time the emergency response vehicles take to reach a certain place.
There are different types of road pattern used in highways, when the road is constructed in a pattern like rectangular pattern, radial pattern, hexagonal pattern, etc. for proper management of traffic it is called a road pattern.
The roadway patterns also increase the response time, the emergency response vehicles take more time to reach a certain place.
Also, Read: Fish Ladder | What Is Fish Ladder | Types of Fish Ladder | Fish Ladders in Dams
What Is Road Pattern?

Different Types of Road Patterns

Rectangular or Block Pattern
Radial or star & block pattern.
- Radial or Star & Circular Pattern
- Radial or Star & Grid Pattern
- Hexagonal Pattern
Minimum Travel Pattern
- Grid Pattern
1. Rectangular or Block Pattern

In this street patterns type, the whole area is divided into rectangular blocks of plots, with streets intersecting at right angles. This is often referred to as the what is grid pattern.
The main road, which is a part of the chandigarh road pattern , passes through the centre of the area should be sufficiently wide, and other branch roads may be comparatively narrow.
The main road is provided with a direct approach to outside the city . This pattern has been adopted in the city roads of Chandigarh.
Pros of Rectangular or Block Pattern
- The rectangular plots may be further divided into small rectangular blocks for the construction of buildings placed back to back, having roads on their front .
- This pattern has been adopted for the city roads.
- The construction and maintenance of roads of this pattern are comparatively easier .
Cons of Rectangular or Block Pattern
- This pattern is not very much convenient because at the intersections they are perpendicular , thus the vehicles face each other resulting in accidents .
Also, Read: What Is Rock Cycle | Types of Rocks | Processes in the Rock Cycle | What Are the Steps of the Rock Cycle | Uses of Rocks in the Construction
2. Radial Road Pattern

In this what is a radial street pattern , the network of roads is in the form of circles, often referred to as radial road meaning , emanating from the centre of the area.
The paradigm of a radial pattern can be found at the Federal B Area of Karachi .
This pattern may be further classified into three types depending on its layout .
2a. Radial or Star & Block Pattern

This type of network is a combination of radial and block pattern of roads .
The entire area is divided into a radial network of roads radiating from the centre outwardly with block pattern network of roads in between the radial main streets.
Pros of Radial or Star & Block Pattern
- Less risky compared to a rectangular pattern .
- It reduces the level of congestion at a primary bottleneck location.
- If one radial road is blocked then another can be used as an alternative.
Cons of Radial or Star & Block Pattern
- Lack of safety appurtenances like rail transitions , crash attenuators and post support bases.
- It is only effective when two-lane ramp traffic does not have to merge at the downstream end of the ramp .
Also, Read: What Is a Low E Glass | Types of Low E Glass | Advantages & Disadvantages of Low E Glass
2b. Radial or Star & Circular Pattern
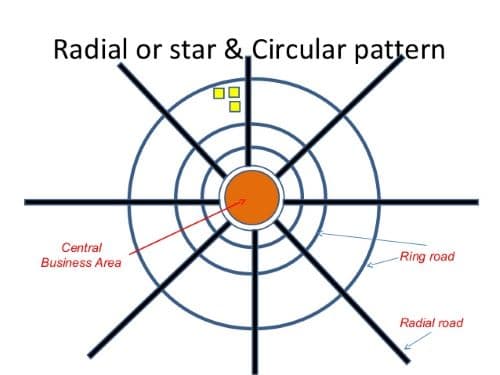
This type of network is a combination of radial and circular pattern of roads.
Here main roads radiate from a central point and are connected with concentric circle roads (ring roads) radiating outwardly.
Pros of Radial or Star & Circular Pattern
- It is safe as compared to the above patterns because vehicles travel in the same direction .
- Roundabouts present in this pattern improves the efficiency of traffic flow . This also reduces fuel consumptions and emissions of the vehicle.
- Reduces the possibility of rear-end crashes.
Cons of Radial or Star & Circular Pattern
- Providing good curve is quite challenging.
- It affects the driving ability (mainly old drivers face this problem due to a decrease in vision).
- It is necessary for the proper provision of the traffic signal, road markings and lighting to alert the drivers.
- Splitter islands should be extended far enough to provide crosswalk and describe the roundabout.
Also, Read: What Is Pedestal | Functions of Pedestal | Methods of Construction: Pedestals | Advantages and Disadvantages of Pedestal
2c. Radial or Star & Grid Pattern

This type of network, sometimes known as the star and grid road pattern , is a combination of radial and grid street pattern of roads.
A radial network of road radiates from the centre outwardly. Then the main radial streets are interconnected by providing a grid pattern.
Pros of Radial or Star & Grid Pattern
- It increases the efficiency of land usage and unit density .
- It improves the traffic flow in both directions utilizing Savannah’s cellular structure .
- It provides high safety to vehicular traffic with a high proportion of 3-way intersections.
- It reduces the cut-through traffic.
Cons of Radial or Star & Grid Pattern
- Splitter islands should be extended far enough.
- High construction cost for extra road markings and signals.
Also, Read: What Is Coarse Aggregate | Requirements of Good Coarse Aggregates | Uses of Coarse Aggregates | Classification of the Aggregates
3. Hexagonal Road Pattern

In this pattern, a network of roads grows in such a manner that they form hexagons.
Three roads meet the built-up area boundary by the sides of the hexagons at every corner which can be further divided in suitable sizes.
Pros of Hexagonal Road Pattern
- Three roads meet the built-up area boundary by the sides of the hexagons .
Cons of Hexagonal Road Pattern
- Traffic signs, pavement markings, and lighting should be adequate so that drivers are aware that they should reduce their travel speed.
Also, Read: What Is Hydraulic Cement | Hydraulic Cement Uses | How to Apply Hydraulic Cement | Advantages & Disadvantages of Hydraulic Cement
4. Minimum Travel Pattern

In this pattern that is also known as a “minimum travel pattern” , the road pattern grows linearly in one direction possible (straight roads), also known as the minimum travel road pattern , only due to the presence of some adjacent natural forces like sea or ocean on one side of the city. These are short roads.
Pros of Minimum Travel Pattern
- These types of potentially serious crashes essentiall0y are eliminated.
Cons of Minimum Travel Pattern
- Intersections can be especially challenging for older drivers.
Also, Read: What Is Pneumatic Structures | Types of Pneumatic Structures | Advantages & Disadvantages of Pneumatic Structures | Uses of the Pneumatic Structures
5. Grid Pattern

A grid street pattern , or simply a grid, is a network of intersecting parallel lines, whether real or imaginary. In the in the grid system the intersection of road at which angle is typically 90 degrees.
In this pattern, streets intersect at right angles and form a pattern of squares when viewed from above. The grid can also refer to a physical network of sorts, not necessarily made of straight or parallel lines.
The grid plan, grid street plan, or gridiron plan is a type of city plan in which streets run at right angles to each other, forming a grid.
The infrastructure cost for regular grid patterns is generally higher than for patterns with discontinuous streets.
Costs for streets depend largely on four variables : street width, street length, block width and pavement width.
Two inherent characteristics of the grid plan, frequent intersections and orthogonal geometry facilitate pedestrian The geometry helps with orientation and its frequent intersections with the choice and directness of route to desired destinations.
Pros of Grid Pattern
- Grids are good for pedestrians because there are many different ways to travel from A to B .
- Grids are good for retail stores and restaurants because they offer a lot of corner lots.
- Navigating a grid is fairly straightforward.
Cons of Grid Pattern
- Grids are bad for drivers and bicyclists because they have a lot of intersections and therefore many potential conflict points.
- Grids can encourage people to use residential streets as shortcuts.
- Grids are a poor fit for cities with a lot of hills because they lead to unnecessarily steep streets.
- An inconsistent or incomplete grid can easily result in traffic chaos.
Also, Read: What Is Softening Point | Ring-Ball Test for Softening Point of Bitumen | List of Proposed to Determine the Softening Point
History of Grid Pattern Road

The grid plan dates from antiquity and originated in multiple cultures; some of the earliest planned cities were built using grid plans.
By 2600 BC, Mohenjo-Daro and Harappa, major cities of the Indus Valley Civilization, were built with blocks divided by a grid of straight streets, running north-south and east-west.
Each block was subdivided by small lanes. The cities and monasteries of Sirkap, Taxila and Thimi (in the IndusInd Kathmandu Valleys), dating from the 1st millennium BC to the 11th century AD, also had grid-based designs.
A workers’ village (2570–2500 BC) at Giza, Egypt, housed a rotating labour force and was laid out in blocks of long galleries separated by streets in a formal grid.
Many pyramid-cult cities used a common orientation: a north-south axis from the royal palace and an east-west axis from the temple, meeting at a central plaza where King and God merged and crossed.
Hammurabiking of the Babylonian Empire in the 18th century BC ordered the rebuilding of Babylon: constructing and restoring temples, city walls , public buildings, and irrigation canals .
The streets of Babylon were wide and straight, intersected approximately at right angles, and were paved with bricks and bitumen .
The tradition of grid plans is continuous in China from the 15th century BC onward in the traditional urban planning of various ancient Chinese states.
Guidelines put into written form in the Kaogongji during the Spring and Autumn period (770-476 BC) stated: “a capital city should be square on plan.
Three gates on each side of the perimeter lead into the nine main streets that crisscross the city and define its grid-pattern.
And for its layout the city should have the Royal Court situated in the south, the Marketplace in the north, the Imperial Ancestral Temple in the east and the Altar to the Gods of Land and Grain in the west.”
Teotihuacan, near modern-day Mexico City, is the largest ancient grid-plan site in the Americas. The city’s grid covered 21 square kilometres (8 square miles).
Perhaps the most well-known grid system is that spread through the colonies of the Roman Empire.
The archetypal Roman Grid was introduced to Italy first by the Greeks, with such information transferred by way of trade and conquest.
Also, Read: WBM Road | Material Required for Construction of WBM Road | Construction Procedure of WBM Road | Advantages & Disadvantages of WBM Road
Road Pattern
There are different types of patterns used in highways, when the road is constructed in a pattern types like rectangular pattern, radial pattern, hexagonal pattern, etc. for proper management of traffic it is called a road pattern. Roadways are very essential in the development of the settlements in a city.
When the road is constructed in patterns like rectangular, radial, hexagonal, etc for the proper management of traffic and also to interconnect the branch roads with main roads then it is called road pattern .
The rectangular / block / grid pattern is a plan where the streets and roads are in the form of grids or blocks running perpendicularly into each other thus forming a grid or block . Usually the main road is wide which passes through the centre of the area and other roads connecting to it are narrow.
Also, Read: Cantilever Bridge | Cantilever Bridge Advantages and Disadvantages | Cantilever Bridge Facts
It is a combination of star and block pattern . The entire area is divided into a radial network of roads radiating from the centre outwardly with block pattern network of roads in between the radial main streets.
Radial or Star and Circular Pattern
In this system, the main radial roads radiating from a central business area are connected together with concentric roads. In these areas, boundary by adjacent radial roads and corresponding circular roads, the built-up area is planned with a curved block system.
Radial or Star and Grid Pattern
The radial and grid pattern is a combination of radial and grid patterns through which the radial network of roads originates externally from the centre. The main radial roads are interconnected by offering a grid pattern between the principal roads.
Hexagonal Road Pattern
In this pattern , the entire area is provided with a network of roads formatting hexagonal figures. At each corner of the hexagon , three roads meet the built-up area boundary by the sides of the hexagons is further divided in suitable sizes.
Also, Read: What Is a Brick Bat Coba | Procedure of Brick Bat Coba Waterproofing | Advantages & Disadvantage of Brick Bat Coba Waterproofing
In this road pattern , the city is contented by sector centre, suburban centre and neighbourhood centre by the road which required minimum to connect the city centre.
Grid Pattern Definition
A grid is a network of intersecting parallel lines, whether real or imaginary. Most American streets are laid out in a grid pattern , meaning the streets intersect at right angles and form a pattern of squares when viewed from above.
Aurbach traces the origins of grid streets back to the Indus Valley: “By 2600 BC, Mohenjo-Daro in the Indus Valley (present-day Pakistan) was built with blocks divided by a grid of straight streets, laid out in perfect right angles, running north-south and east-west. Each block was subdivided by small lanes.
Like this post? Share it with your friends!
Suggested Read –
- tar bitumen
- What Is Plaster
- Types of Tunnels
- Road Horizontal
- What Are Columns
- What is Waffle Slab
- What Is Plumbing Joint
- Build Up Area Definition
- Types of Residential Housing
- What Is Mortar in Construction
- Calculator for Cutting Length of Stirrups
- What Is Canal | Classification of Canals

About Matthew L. Deloney
Hey, I am Matthew L. Deloney . The Man Behind CivilJungle. I started this site to spread knowledge about Civil Engineering. I am a Degree Holder in Civil Engineering.
You can find him on Facebook , Twitter, Tumblr, Instagram and Google News .
Leave a Reply Cancel reply
Your email address will not be published. Required fields are marked *
Save my name, email, and website in this browser for the next time I comment.
MIND BEHIND CIVILJUNGLE
Hey, I am Matthew L. Deloney . The Man Behind CivilJungle. I started this site to spread knowledge about Civil/Mechanical/Electrical Engineering. I am a Degree Holder in Civil Engineering.
You can find him on Facebook , Twitter, Tumblr, Instagram , LinkedIn and Google News .
At CivilJungle , we clarify civil engineering and publish all the happenings & news of civil engineering.
Get Traffic & Exposure. We help brands optimize their online presence & performance.
MORE DETAIL
CONNECT WITH US

Join the Home of Civil Engineers →
National Geographic content straight to your inbox—sign up for our popular newsletters here

- PHOTO CONTEST
25 spectacular patterns in nature—and where to see them
Explore designs in nature with these submissions to the 2019 National Geographic Travel Photo Contest.
When you travel, what do you see? This gallery of submissions to the 2019 National Geographic Travel Photo Contest reveals natural patterns and designs that captured the eyes—and lenses—of photographers from around the world. From bold landscapes to intimate wildlife portraits, explore visions of our world and ask yourself if you see the pattern of your own life in nature.
For Hungry Minds
Related topics.
- TRAVEL PHOTOGRAPHY
- PHOTOGRAPHY
You May Also Like

How to capture your travels with a drone

How I got the shot: Jonathan Gregson on witnessing Uganda's wallowing hippos

The 9 best digital cameras for travelers, according to National Geographic

A photo journey into the remote communities of eastern Bhutan

The art of iceberg chasing in Newfoundland
- Paid Content
- Environment
- Photography
- Perpetual Planet
History & Culture
- History & Culture
- History Magazine
- Mind, Body, Wonder
- Terms of Use
- Privacy Policy
- Your US State Privacy Rights
- Children's Online Privacy Policy
- Interest-Based Ads
- About Nielsen Measurement
- Do Not Sell or Share My Personal Information
- Nat Geo Home
- Attend a Live Event
- Book a Trip
- Inspire Your Kids
- Shop Nat Geo
- Visit the D.C. Museum
- Learn About Our Impact
- Support Our Mission
- Advertise With Us
- Customer Service
- Renew Subscription
- Manage Your Subscription
- Work at Nat Geo
- Sign Up for Our Newsletters
- Contribute to Protect the Planet
Copyright © 1996-2015 National Geographic Society Copyright © 2015-2024 National Geographic Partners, LLC. All rights reserved
- Differences
- Niche Topics
- Tools & Equip.

The main principle of road patterns is to reduce the time and distance the vehicle takes to reach the destination. It also focuses on the interconnection of branch roads.
It increases the response time of average and emergency vehicles, like ambulances, fire engines, etc., to reach the destination.
Road Pattern also plays a vital role in traffic management, but most countries neglect it. 6 types of road patterns are primarily used.
2. What are the types of Road Patterns?
1. rectangular or block pattern.
a. In this pattern, the whole area is divided into rectangular blocks.
b. Streets or branch roads intersect with each other at the right angle.
c. The main roads always pass through the center and should be wide enough.
d. Branch roads may be narrow as compared to main roads.
e. The main roads should be provided with a direct approach outside the city.

~ The rectangular blocks can be further fractioned into small rectangles that may be used to construct buildings placed back to back, with roads on their front.
~ It is widely adopted on city roads.
~ Construction and Maintenance is quite easy.
~ It is not convenient because roads are perpendicular to each other. This increases the rate of accidents due to poor visibility at a perpendicular junction.
2. Radial or Star and Block Pattern
a. It combines star and block patterns.
b. The entire area is divided into a radial network of roads radiating outward from the center with a block pattern network of roads between the radial main streets.

~ Less risky as compared to the rectangular pattern.
~ It reduces the level of congestion at the primary bottleneck location.
~ If one radial road is blocked, another can be used as an alternative.
~ Lack of safety appurtenances like rail transitions, crash attenuators, and post-support bases.
~ It is only effective when two-lane ramp traffic does not have to merge at the downstream end of the ramp.
3. Radial or Star and Circular Pattern
a. It is the pattern in which the main roads(radial roads) radiate from the central point and are connected with concentric roads(ring roads) radiating outwardly.

~ It is safe as compared to the above patterns because vehicles travel in the same direction.
~ Roundabouts present in this pattern improve the efficiency of traffic flow. This also reduces fuel consumption and emissions of the vehicle.
~ Using a circular pattern in place of traffic signals reduces the possibility of rear-end crashes.
~ Providing a good curve while implementing this pattern is quite challenging.
~ It affects the driving ability. Mainly, old drivers face this problem due to declines(decreases) in vision, hearing, and cognitive functions .
~ There is the necessary, proper provision of the traffic signal, road markings, and lighting to alert the drivers that they are approaching a roundabout.
~ Splitter Islands should be extended far enough to provide pedestrian refuge (crosswalk) and to delineate(describe ) the roundabout.
4. Radial or Star and Grid Pattern
a. This pattern is formed by combining Star and Grid Pattern.
b. As in others, a radial road network radiates outwardly from the center. Then, the main radial streets are interconnected by providing a grid pattern.

~ It increases the efficiency of land usage and unit density.
~ It improves the traffic flow in both directions by utilizing Savannah’s cellular structure.
~ It provides high safety to vehicular traffic with a high proportion of 3-way intersections.
~ It reduces the cut-through traffic.
~ Splitter islands should be extended far enough.
~ High construction cost because of the need for extra traffic signals, road marking and lighting.
5. Hexagonal Pattern
a. In this, the entire area is divided into hexagonal patterns.
b. Three roads meet the built-up area boundary by the sides of the hexagons at every corner of the hexagon, which can be further divided into suitable sizes.

6. Minimum Travel Pattern
The city center is connected with suburban and neighboring centers with the shortest roads. To make the road short, the road alignment is made straight.
Read More: Prismatic Compass
Soot to mm Conversion Calculator
Camber in road pavement | 4 types of camber | construction of camber | advantages & disadvantages of camber, bhk house plan with a sample plan image, 50+ essential home repair tools, construction accident law firm: 15+ most asked questions, road safety barriers: where to use, construction injury law firm, what are traffic delineator posts : importances & 5+ types of delineator post.
- Privacy & Terms
©Dream Civil International 2019-2023
Thank you for visiting nature.com. You are using a browser version with limited support for CSS. To obtain the best experience, we recommend you use a more up to date browser (or turn off compatibility mode in Internet Explorer). In the meantime, to ensure continued support, we are displaying the site without styles and JavaScript.
- View all journals
- My Account Login
- Explore content
- About the journal
- Publish with us
- Sign up for alerts
- Open access
- Published: 17 May 2024
Understanding attractions’ connection patterns based on intra-destination tourist mobility: A network motif approach
- Ding Ding 1 , 2 ,
- Yunhao Zheng 1 , 2 ,
- Yi Zhang 1 , 2 &
- Yu Liu ORCID: orcid.org/0000-0002-0016-2902 1 , 2
Humanities and Social Sciences Communications volume 11 , Article number: 636 ( 2024 ) Cite this article
1 Altmetric
Metrics details
- Business and management
- Complex networks
- Science, technology and society
Tourist movement patterns among attractions are complex and variable, and understanding such patterns can help manage tourist destinations more effectively. However, previous studies on tourist movement utilising complex networks have not explored the network motif approach comprehensively. Therefore, we adopted a network motif approach using social media data to extract and analyse motifs in a city network. This study analyses the attractions corresponding to the nodes in each motif, revealing the connection patterns between these attractions. We also discuss motifs between attractions with different types and titles. Popular attractions play a significant role in a local network while other attractions serve distinct functions within the network. This study’s findings enhance the significance of network motifs in examining tourist movement and deepen the understanding of recurring movement patterns between attractions. Moreover, they assist managers in developing policy tools for intelligent tourism destination marketing and planning that cater to tourists’ needs.
Participatory action research

Spending at least 120 minutes a week in nature is associated with good health and wellbeing

A cross-verified database of notable people, 3500BC-2018AD
Introduction.
Tourism has emerged as a leading economic activity worldwide, surpassing certain traditional industries and serving as a pivotal catalyst for international and regional economic growth. Specifically, urban tourism constitutes the cornerstone of contemporary tourism and has reached an advanced stage of competitive growth (Cárdenas-García et al., 2024 ; W. Su et al., 2003 ). Tourism has generated business prospects for numerous companies within renowned tourist cities such as Paris, New York, and Tokyo, simultaneously creating many employment opportunities for the urban population and infusing consistent economic vibrancy into such destinations (Hassan, 2000 ). Contemporary tourists’ movements in cities are no longer bound by rigid schedules or fixed itineraries, and their temporal and spatial flexibility is highlighted by their mobility patterns. John Urry’s ‘new mobility paradigm’ focuses on such changing nature of mobility (Korstanje, 2018 ; Merriman, 2012 ; Tzanelli, 2021 ; Urry ( 2008 )).
The rapid development of information and communication technologies has led to the widespread popularisation of mobile terminal devices equipped with positioning technology. The large amount of user location data collected by these devices has significantly enhanced our understanding of tourist mobility over the past two decades (Chen et al., 2022 ; Chuang, 2023 ; Jiang & Phoong, 2023 ; Leng et al., 2021 ; Nguyen & Nguyen, 2023 ; Park et al., 2023 ; Xu et al., 2024 ). By leveraging these datasets, diverse research methods and theories have been used to investigate tourist mobility, including geographic information systems (Lau & McKercher, 2006 ), time geography (Grinberger et al., 2014 ; Xiao-Ting & Bi-Hu, 2012 ), and Markov chains (Vu et al., 2015 ; Xia et al., 2009 ). Tourism researchers have attempted to understand the essence of tourist mobility because it plays a key role in attraction marketing, event planning, and the management and design of attractions in cities. Understanding tourist mobility with a city as a single destination can help managers make refined decisions compared to tourist movement on a larger scale, such as movement between destinations. Notably, a prevalent trend involves the aggregation of individual-level mobility data into networks, which serve as a basis for analysing the topological structure of attraction systems (Vu et al., 2015 ).
Tourist mobility data correspond to a network structure in which tourist attractions are nodes and the spatial movement between two attractions represents bonds (Kang et al., 2018 ). Consequently, network analysis is a data mining technique that has been widely used to extract the connection patterns established between attractions as tourists move through a geographical space (García-Palomares et al., 2015 ; Han et al., 2018 ; Leung et al., 2012 ; Mou et al., 2020a ; Peng et al., 2016 ; Xu et al., 2022 ; Zeng, 2018 ). Understanding the network characteristics of tourist attractions has practical implications for the competitiveness, management, and planning of tourist attractions (Stienmetz & Fesenmaier, 2015 ).
Nevertheless, most current literature employing social network analysis relies on descriptive measurements to analyse tourist mobility patterns. However, this approach hampers the assessment of the reliability and validity of the identified patterns (Park & Zhong, 2022 ). This study emphasises the concept of network motifs. These motifs are characterised as recurring and statistically significant subgraphs within a larger graph. As a crucial research task in complex network theory (Ahmed et al., 2017 ), motifs reveal functional properties based on the structural traits of network systems. Examining motifs in tourism networks enhances the understanding of how destinations are connected, how tourists move between destinations and how tourism policies affect network structure and dynamics. Moreover, in comparison with the travel motifs applied in previous studies (Park & Zhong, 2022 ; Yang et al., 2017 ), network motifs provide greater insight into individual tourist mobility at the aggregation level. Consequently, motifs can be useful in identifying the most influential or central destinations in tourism networks.
In summary, this study answers the following three questions: (1) What types of motifs do attractions constitute? (2) How are motifs linked to specific attractions? (3) How do motifs relate to attraction attributes? As the first study to use network motifs to examine tourist movement in a group manner, we select Suzhou City as the case study area and adopt social media data to extract tourists’ movements, which makes it easy to connect the nodes of the network with specific attractions. This paper proceeds as follows: The Literature Review section, as its name implies, presents a review of relevant studies on tourist mobility and network motifs. The Methodology section presents the dataset used in this study and the motif discovery method that we used to analyse it. The Results section presents an analysis of the results of motif discovery. In the Discussion section, we discuss this study’s results and implications for tourism. The Conclusion section presents the conclusions of the study.
Literature review
Research on network motifs.
Network motifs are defined as patterns of interconnections occurring in complex networks at numbers that are significantly higher than those occurring in randomised networks (Milo et al., 2002 ). Motifs can characterise the dynamic and functional behaviour of a network, therefore enabling the classification of networks based on statistical analysis (Roy et al., 2023 ). Network motifs have practical implications for social relationships, protein complexes, and information infrastructures (Yu et al., 2020 ). Current methods for discovering network topics can be divided into two categories: network-centric and motif-centric approaches. Network-centric methods enumerate all subgraphs in a network, such as Mfinder (Kashtan et al., 2002 ), FanMod (Wernicke & Rasche, 2006 ), Kavosh (Kashani et al., 2009 ) and G-tries (Ribeiro & Silva, 2010 ). Conversely, approaches such as Grochow (Grochow & Kellis, 2007 ) and MODA (Omidi et al., 2009 ) are motif-centric. Based on subgraph symmetry, motif-centric methods search for a single query graph and then map frequencies rather than enumerate them.
Regarding the application of complex network science in the field of tourism, previous studies examine tourist flow networks from the perspective of inter-destination (Liu et al., 2017 ; Peng et al., 2016 ; Shih, 2006 ; Wang et al., 2020 ) and intra-destination (Gao et al., 2022 ; Hwang et al., 2006 ; Leung et al., 2012 ; Mou et al., 2020 ; Zeng, 2018 ; Zheng et al., 2021 ). Summarising these previous studies, two common types of metrics can be identified: network- and node-based metrics. Network-based indicators include density, efficiency, diameter, average shortest path, average clustering coefficient, and centralisation. Node-based metrics include degree (out and in), degree centrality (out and in), closeness centrality, and betweenness centrality. Furthermore, network structure analysis methods, such as structural holes and core-periphery analyses, have also been employed.
Although motif discovery is a crucial research area in network science, its application to tourism has been relatively limited. Several studies have been at the forefront of applying network motifs to the study of human mobility (Cao et al., 2019 ; Schneider et al., 2013 ; R. Su et al., 2020 ). In contrast to concentrating solely on subgraphs within mobility networks, researchers have introduced the concept of travel motifs, therefore expanding motifs from topological spaces to include temporal and semantic dimensions (Yang et al., 2017 ). To the best of our knowledge, this tourism network motif was first mentioned in a global tourism network study (Lozano & Gutiérrez, 2018 ). Several network motifs including transitive feedforward loops and different one and two mutual-dyads subgraphs, have been identified. Furthermore, a study conducted in South Korea introduced a network motif algorithm to examine the interconnections of travel patterns between places within the context of tourism (Park & Zhong, 2022 ), and disregarded only the spatial behaviour of local tourists. Moreover, because cell towers collect mobile sensor data, it is challenging to accurately determine the precise locations of mobile users and the tourist attractions corresponding to those specific locations. Therefore, this study employs social media data and links each tourist’s spatial behaviour to a corresponding attraction, therefore revealing the connection patterns among attractions.
Tourist mobility and network analysis
Tourist mobility encompasses tourists’ flow, movement, dispersal, and travel patterns across space and time (Hardy et al., 2020 ; Shoval et al., 2020 ). The analysis of spatial movement is a significant aspect of tourist mobility (Oppermann, 1995 ). Understanding how tourists move through time and space has important implications for infrastructure and transportation development, product development, destination planning, and planning of new attractions, as well as the management of the social, environmental, and cultural impacts of tourism (Lew & McKercher, 2006 ). The verifiability and reliability of tourist mobility studies can be improved through quantitative analysis; however, the results of quantitative analyses are highly dependent on the scales on which their studies are used (Jin et al., 2018 ; Zhang et al., 2023 ).
Some intra-destination mobility studies have conducted analyses at the individual level. For instance, Fennell ( 1996 ) examined tourist movements on the Shetland Islands using measures of space, time, perception, region, and core-periphery. Lew and McKercher ( 2006 ) used an inductive approach based on urban transportation to identify explanatory factors that influence tourist mobility within a destination. Early research favoured abstract methods based on fundamental tourist proposals. There is a general approach for modelling tourist mobility that is easy to reproduce, namely, the Markov model. Xia et al. ( 2009 ) used Markov chains to model tourist mobility as a stochastic process and calculated the probabilities of tourists’ movement patterns on an island. As a more practical and useful approach, using semi-Markov models is effective in deriving the probabilities of both tourist movement and the attractiveness of specific attractions (Xia et al., 2011 ). Furthermore, time geography is a conceptual framework used to describe and understand tourist mobility. Integrating time geography with geographic information systems tools, Grinberger et al. ( 2014 ) clustered tourists based on the time-space allocation measures of their behaviour to reveal tourists’ choices and the strategies they implemented within the constraints of time and space.
There is an increasing trend involving the aggregation of individual-level mobility data into networks as the basis for analysing the topological structure of attraction systems (Smallwood et al., 2011 ). Mobility patterns can be viewed as a network and are therefore subject to network analysis (Shih, 2006 ). Based on a core-periphery analysis of attraction networks, Zach and Gretzel ( 2011 ) analysed the structure of attraction networks and provided a strong and practical basis for technology design and tourism marketing. Leung et al. ( 2012 ) applied social network and content analyses to examine the most visited tourist attractions and main tourism movement patterns in Beijing during three distinct periods. Additionally, network methods are often used in conjunction with other analytical methods. For example, Liu et al. ( 2017 ) applied a quadratic assignment procedure to an attraction network to test the relationship between proximity and the attraction network determined by tourists’ free-choice movements. Another example is Mou et al. ( 2020a ), who integrated social network analysis with traditional quantitative methods to develop a novel research framework. Indicators such as the Annual Gini Index and Pearson correlation coefficient can also be helpful when analysing tourists’ spatiotemporal behaviour (Zheng et al., 2021 ).
Motif discovery algorithms are commonly applied to gene regulation networks, electronic circuits, and neurones (Yu et al., 2020 ). However, studies using motif discovery methods to examine study tourist mobility are limited. It is worth mentioning that there are studies that examine travel motifs (which are extended from topological spaces to temporal and semantic spaces) to ascertain tourist mobility patterns (Yang et al., 2017 ). In fact, the variation in travel mobility patterns depends not only on tourists’ different lengths of stay and the topological structures of travel mobility but also on the relative proportions of each travel mobility type (Park & Zhong, 2022 ). However, travel motifs can only reflect the movement patterns of individual tourists rather than the movement patterns at the aggregated-individual level, let alone serve as the basis for analysing the topological structure of an attraction network (Jin et al., 2018 ). To the best of our knowledge, no previous study has used network motifs to examine tourist mobility at the individual-aggregation level. Only Lozano and Gutiérrez ( 2018 ) applied the network motif analysis tool offered by UCINET 6.0 to analyse the top three global tourism flows. Therefore, this study argues that the use of network motif analysis not only fills a research gap regarding tourist mobility at the aggregation level but also provides theoretical support for planning and the design of tourist attraction networks.
Methodology
We selected Suzhou, China (Fig. 1a ) as the study area. Suzhou is located in eastern China, west of Shanghai, and has a population of five million residents. With its plentiful tourism resources, Suzhou received more than 100 million domestic visitors annually before the COVID-19 pandemic. Suzhou is well-known for its cultural and historical heritage. The most popular attractions in Suzhou are its classical gardens, which were included in the World Heritage List of the previous century. Suzhou’s ancient city attractions cover an area of 14 km 2 . In addition to these historical attractions, Suzhou has a natural landscape with lush mountains and gleaming lakes.

a The location of attractions in Suzhou b The geo-tagged microblogs in Suzhou.
Data collection and preprocessing
Social media data were primarily collected from location-based mobile phone applications. Sina Weibo, the Chinese equivalent of Twitter, is the most popular social media platform in China, with over 500 million active registered users who post 300 million microblogs daily (Kim et al., 2017 ). We used the application programming interface provided by Sina Weibo to crawl posts made in Suzhou from 12 April, 2012 to 31 October, 2016. The posts we crawled from the application programming interface contained various data about the users, including post identification (ID), user ID, post text, pictures, location information (longitude and latitude), and post time, as shown in Fig. 1b . Based on the user ID, we were also able to acquire users’ profile information while remaining compliant with user privacy regulations. User profile information includes registration location, gender, age, number of posts and fans, and ‘follows.’
However, only a portion of users were involved in tourism activities. We assumed that these tourists were not locals and that they had to return to their cities of residence after their trip. Referring to the double-filtration approach proposed by Su et al. ( 2020 ), we first filtered out local users based on the locations registered in their Weibo user profiles. In this study, the time difference between a user’s first and last post is defined as their length of stay. Referring to previous studies (Girardin et al., 2008 ; García-Palomares et al., 2015 ), we filtered out users who stayed longer than one month.
The purpose of tourism activities can be entertainment or relaxation; however, they can also be a part of official or business visits. Although official/business visits may also involve tourism activities, only visitors travelling to Suzhou of their own accord were considered tourists in our study. Therefore, during data preprocessing, we defined only users who posted microblogs within the tourist attractions shown in the Suzhou Tourism Bureau’s official list ( http://tjj.suzhou.gov.cn/ ) as tourists. Specifically, we used the coordinates recorded in the geo-tagged microblogs to determine whether a user had visited one of the attractions on the official list. After filtering out individuals based on the criteria described above, 234,049 Weibo microblogs were obtained from 54,712 tourists. Sorting these microblogs by time gave us the of tourists’ trajectories within the city. As a result, we could map these trajectories to the directional connections between attractions to establish, a network of attractions (Fig. 2 ).

Framework of the network motif analysis.
Extracting attractions’ connection patterns using network motif analysis
Just as attractions are represented in networks as nodes and flows as edges, tourist mobility patterns can also be transformed into complex networks (Schneider et al., 2013 ). Therefore, we discovered all recurrent mobility patterns related to the motifs appearing in the tourist flow network. To accomplish this, we introduced a new algorithm (Kavosh) designed to find k-size network motifs with less memory and CPU time than those required for other algorithms. The Kavosh algorithm is based on counting all k-size subgraphs of a given graph (directed or undirected). As shown in Fig. 2 , the Kavosh algorithm consists of three steps: enumeration, random network generation, and motif identification. First, the algorithm enumerates all possible mobility patterns related to the subgraphs in the original network. The Kavosh algorithm groups the isomorphic subgraphs using the NAUTY algorithm. This optimisation enhances the overall process efficiency and minimises pattern redundancy. As not all patterns bear significance, the algorithm generates a large number of random networks and compares the frequency of occurrence of these patterns in all random networks. Lastly, the significance of each pattern in the input network is calculated for motif identification. Here, some statistical measures that generate probable motifs in the original network are introduced.
This is the simplest method for estimating the significance of a motif. For a given network, we assume that G p is a representative of an isomorphism class involved in that class. Frequency is defined as the number of occurrences of G p in the input network.
This measure reflects how randomly the class occurred in the input network. For the assumed motif G p , this measure is defined as:
This measure indicates the number of random networks in which a motif, G p , occurs more often than in the input network, divided by the total number of random networks. Therefore, the P -value ranges from 0 to 1. The smaller the P -value, the more significant the motif.
Therefore, the motifs found in the input network are available, including some related statistical measures. As mentioned in the previous step, three different measures are used in this algorithm. There are no exact thresholds for these measures to distinguish motifs; the more restricted the thresholds, the more precise the motif. According to previous experimental results (Milo et al., 2002 ), the following conditions can be used to describe a network motif:
Using 1000 randomised networks, the P -value is < 0.01.
The frequency is larger than four.
Using 1000 randomised networks, the Z-score is > 1.
According to the above conditions, aiming to be as precise as possible, the patterns with significant measures are those that describe the network motifs.
Extracted motifs of the tourist attraction network
The Sina Weibo data analysed in this study encompassed 104 attractions within Suzhou City (Fig. 1a ). According to the processing method described in the previous section, the data from Sina Weibo constituted a total of 2171 edges of the tourism network. When searching for k-motifs, the frequency of (k-1) motifs in the original network should be the same as that in the randomised network (Yu et al., 2020 ). In this study, motifs with more than four nodes did not meet the requirements for extraction; therefore, we extracted motifs with three and four nodes. We determined that a motif appeared in the network based on the criteria mentioned in the previous section. Consequently, we extracted three motifs for three-node motifs and six motifs for four-node motifs, as shown in Figs. 3 and 4 .

Topological types of tourism network motifs.

Frequency and Z-score of tourism network motifs.
Under each motif in Fig. 3 is the proportion of that motif within the network, while the ID of that motif is in the top-right corner of each cell. Each node in the graph also contains a corresponding label, as shown by the IDs of motifs 1 and 4. The node labels of the other motifs are similar. Therefore, we did not label them all to ensure the figure remained concise. Referring to the classification of motifs in previous studies (Costa et al., 2007 ; Yang et al., 2017 ), we divided motifs into four base classes: chain, mutual dyad, double-linked mutual dyad, and fully connected triad. The chain-class motif refers to tourists visiting three attractions sequentially without returning. Similarly, a double-linked mutual dyad motif means that tourists flow in both directions between two pairs of attractions. The fully connected triad motif refers to a pair of three attractions with any two pairs flowing in both directions.
Among them, the mutual dyad, double-linked mutual dyad, and fully connected triad have uplinked and downlinked variants in their main categories. For example, if node A of the mutual dyad sends tourists to another attraction, we use the term ‘uplinked’ to describe this motif, whereas if node A receives tourists from another attraction, we describe the motif as ‘downlinked’. By analogy, these naming rules can be extended to double-linked mutual dyads and fully connected triads. The centrally linked mutual dyad and fully connected triad with a mutual dyad are two more specific variants. The centrally linked mutual dyad is based on a core attraction surrounded by three nodes with mutual circulation; however, none of the three attractions are connected to each other. A fully connected triad with a mutual dyad constitutes one fully connected triad in which one node forms another mutual dyad.
Among the abovementioned nine motifs, those with IDs 1, 2, and 3 are three-node motifs, accounting for 37.61% of the total number of network subgraphs. This indicates that the flow of tourists between any three attractions in the tourism network is dominated by chaining. This suggests that there is an order for most connections among the three attractions’ patterns. The remaining six motifs of the four nodes accounted for 29.67%, with three motifs (those with IDs 4, 5, and 6) forming around the centre point in the lower left corner. The centrally linked motif corresponds to a movement pattern referred to as a ‘basecamp’ in previous studies (Lau & McKercher, 2006 ; Lue et al., 1993 ; Oppermann, 1995 ), in which tourists establish one attraction as their basecamp and leave to visit other places, only to return later. In the downlinked variant, this base camp appeared as a gateway attraction for visiting attractions B and C. The motifs with IDs 7, 8, and 9 were mainly structured as a fully connected triple attraction, which comprised three closely linked attractions where tourists can move freely. In addition to this triple attraction, we also identified a relationship between one attraction and one of three attractions, exhibiting relationships of receiving, conveying, and circulating with each other. Therefore, regarding the connection patterns of the four attractions, the function of the key attractions in it is both specific and vital.
Motif interpretation: Specific attractions
In this study, all calculated motifs were the local mobility patterns of tourists that occurred at high frequencies in the original tourist network. The following analysis was performed for the distribution of attractions on each node of the extracted motifs. We selected the node with the highest degree for each motif and counted the attractions appearing in that node for all subgraphs in the tourist network. The top three attractions with the highest frequency on the highest-degree node were selected according to their frequency, as shown in Table 1 . In the table, the highest-degree nodes are shown in orange.
Table 1 shows that the attractions Guanqian Street, Jinji Lake, and Pingjiang Road are the most highly placed nodes in the subgraph, indicating that these three attractions are in a relatively central position in the whole network. In other words, the network is organised around these three attractions, forming the vast majority of the local tourist movement patterns. Additionally, attractions such as Zhouzhuang and Hanshan Temple also play a key role in the local network. Zhouzhuang appears in the nodes of the motif as an attraction en route to other attractions, acting as a gateway. Generally, in motif patterns 3 and 9, tourists do not return after visiting Zhouzhuang but continue to visit attractions interconnected with Zhouzhuang, which is attributable to the long distance between Zhouzhuang and the urban area of Suzhou. The opposite is true for Hanshan Temple, whose corresponding motif patterns (2, 4, and 7) tend to be the attractions that tourists visited before they went to B through other attractions, implying that tourists all converged at that attraction before visiting other attractions. We further determined the top three attractions in node B: Tongli National Wetland Park, China Flower Botanical Garden, and Dabaidang Ecological Park. The common characteristic of these three attractions is that they all have multiple varieties of flowers with ornamental value and rich vegetation coverage, making them good places for hiking during spring.
Motif interpretation: Types and titles of attractions
In addition to exploring the nodes with the highest degree of motifs, this study examines the types and titles of attractions on each node. According to the classification proposed by another study in Suzhou (Xue & Zhang, 2020 ), attractions can be classified into natural, cultural, and commercial, according to their landscape type; they may also be classified as 5A, 4A and others according to their title (A tourist attraction with a ‘5A’ score implies that it has the most beautiful scenery, the best service and perfect facilities). Fig. 5 shows the distribution of attraction types on the nodes, Fig. 6 shows the distribution of attraction titles on the nodes, while the node labels in the lower right corner of each figure are used to refer to the relative positions of the nodes on each motif. We refer to these node labels in the subsequent paragraphs.

The attraction type of motif nodes.

The attraction title of motif nodes.
Figures 5 and 6 show that the types of attractions on each node differ; however, the differences in the types of node attractions between each motif in each major category are relatively insignificant. This indicates that each major category of attraction connection pattern summarises a common class of tourists’ local movement patterns, while the attributes of each attraction in this movement pattern are fixed.
Types of attractions
In Fig. 5 , the distribution of the attraction types of the nodes differs insignificantly in the type of attraction for the chain-type motif. Regarding the mutual dyad type, the types of node A are still relatively balanced, whereas the types dominated by nodes B and C are different and exactly opposite. Specifically, node B of motif 2 is dominated by natural-type attractions, whereas node C has more than 50% cultural attractions. Conversely, motif 3 shows the opposite pattern. The double-linked mutual dyad exhibited more obvious characteristics. First, we observe that the proportions of nodes C and D attraction types of the three motifs are identical, with the main differences appearing in nodes A and B. Second, for IDs 4 and 5, node A’s commercial attractions exhibit a significantly high proportion, which highlights their role in aggregating tourists in the local network. In contrast, for motif 6, node A primarily serves as a transit node from B to C and D, while its proportion of commercial attractions is not notably high. Lastly, in the fully connected triad, the proportion of interconnected nodes in the three motifs remains consistent. Nodes C and D are dominated by cultural attractions, whereas node A, acting as a communication hub for other attractions, exhibits a more balanced distribution of types.
Titles of attractions
In Fig. 6 , the percentages of 5A and 4A attractions on nodes without attraction titles are significantly lower than those on nodes with famous attraction titles. Specifically, considering the percentage of attraction titles on each node, the difference in the percentage of B and C node levels for the chain-type motif is insignificant. Moreover, they are dominated by unpopular attractions. However, the percentage of A as a transit node for famous attractions is significantly higher than that of B and C. The situation of node A in the mutual Dyad type is similar to that of the chain type, with a higher percentage of famous attractions, whereas the situation is different for nodes B and C. Nodes B and C have the opposite ratio: when node B has a higher proportion of famous attractions, node C is dominated by non-famous attractions, and vice versa. Regarding the double-linked mutual dyad type, the proportion of famous attractions in node A is significantly higher than that in the other nodes. However, there is no significant difference in the percentage of attraction titles in the other nodes, regardless of whether it is a bidirectional flow with node A, and all of them are dominated by non-famous attractions. When there is a fully connected triad in the motif, the proportion of the three nodes that are fully connected as attractions with titles is very high, indicating that the flow of tourists between the 5A and 4A attractions is considerable. In contrast, most of the B nodes that are only connected to A nodes comprise non-famous attractions, indicating that attractions without good titles cannot establish a better connection with 5A and 4A.
We applied network motif analytics as a novel approach for exploring the local structure of tourist networks, based on social media data. The overall structural features of the network emerged from the local relational features. To comprehend the principles of tourist network formation, it is essential to consider not only the overall network perspective but also local network connections. The results showed that attractions play an important role in local networks and that this role is related to the type and level of attractions. Therefore, enhancing the future development of tourism in Suzhou hinges on strategically guiding attractions to fulfill their appropriate service functions within the destination city.
Tourist mobility patterns
This study employs the theory of motifs, which originated from complex network science, as an innovative approach to investigating tourist mobility patterns. Originally used in the field of biology, the network motif algorithm for complex networks was applied in this study to examine the relationships between overabundant tourism mobility patterns and the corresponding attractions. Unlike previous methods for mining travel motifs, the analysis results of motif analysis in the network cannot directly extract tourists’ travel itineraries in the city. The motif-based analysis method focuses more on the movement patterns of groups of tourists between several strongly associated attractions. Based on this characteristic, network motif analysis is more suitable for observing local phenomena.
For tourist movement in urban tourist destinations, a large directed graph can be constructed for tourist movement between attrations according to the concept of network science theory. By applying the motif extraction method to this graph, we can find that it is these simple repeating topologies that make up the overall network (Fig. 7 ). In this study, four classes and nine motifs effectively summarised the diverse mobility patterns. This implies that despite the diversity of their travel history, humans follow simple reproducible patterns (González et al., ( 2008 )). Understanding tourist mobility patterns enhances the comprehension of city destination systems and provides vital insights into city destination planning and development (Ashworth & Page, 2011 ).

Motifs in attraction network.
Connection patterns between attractions
This study examines a tourist network’s connection patterns to identify attractions with distinct roles, including core, transit, and gateway attractions. Tourist attractions within destinations vary in significance, while the hierarchical structure of urban destination systems differs based on their appeal to tourists (Golledge, 1978 ). From a product-marketing standpoint, these findings help marketers understand the function of attractions in tourists’ travel itineraries and establish a foundation for the development of targeted tourism products. For example, for the core attractions, overall tourism planning should be carried out around them; for the identified transit attractions, more transportation routes should be planned for these attractions; for the gateway attractions, the hotel reception services and tourist guide services around these attractions should be enhanced. Nevertheless, the results underscore that the crucial nodes within the nine motifs are almost always composed of a few of the most renowned attractions. From a risk management perspective, an excessively concentrated destination may cause ‘overtourism’ (Peeters et al., 2018 ).
Implications for tourism management
Understanding tourists’ movement is essential for tourism managers to plan and implement effective sustainability strategies (Shi et al., 2017 ). The tourist network examined in this study reflects the movement of tourists among attractions, provides a novel approach to analyse tourist movement patterns within destinations and accurately depicts tourists’ digital footprint within destinations (Fan et al., 2024 ). The results show that although tourists’ detailed movement patterns among destinations are highly complex, local attractions’ connections in the network can be grouped into several patterns. This suggests that although tourists differ in preferences, there are also commonalities in their overall spatial behaviours, which helps enrich the group user profile of visiting tourists. Therefore, destinations can develop attractions and alternative attractions based on the analysis of tourist movement patterns by capturing popular travel routes (Vu et al., 2015 ).
Conclusions
As cities become centres of economic activity, new forms of urban tourism are becoming popular, while an increasing number of tourists are choosing cities as destinations to pursue novel, diverse, and personalised travel experiences (Füller & Michel, 2014 ). This study employs motif analysis in complex network science to elucidate tourist mobility patterns and depict the interconnections between attraction systems in Suzhou, China. We innovatively used actual attractions as network nodes and focused on attraction connection patterns to provide practical implications for destination management. The main conclusions are summarised as follows:
Referring to the motif discovery method known as Kavosh, we extracted nine motifs from a tourist network in Suzhou. These nine motifs can be categorised into four main classes: chain, mutual dyad, double-linked mutual dyad, and fully connected triad.
Specific attractions represented by nodes in the motifs are explored comprehensively. Suzhou’s network is organised around three attractions, namely, Guanqian Street, Jinji Lake and Pingjiang Road, which form most of the local attractions’ connection patterns. Attractions such as the Zhouzhuang and the Hanshan Temple perform specific functions in the network.
The types and proportions of attractions were investigated by visualising local tourist mobility patterns in the network. The results showed that nodes with a higher degree of motifs were generally well-known attractions with titles such as 5A or 4A and were dominated by cultural and commercial attractions.
These results provide a new analytical methodological framework for examining connection patterns in local attraction systems, as well as a basis for the management of attractions within urban tourism destinations.
Despite the theoretical insights and practical applications of this study, there are some limitations that must be acknowledged. For example, social media data are prone to various biases—e.g. the popularity of specific platforms among users—while the amount of data may vary by country, year and population. The bias associated with highly engaged users can result in the overrepresentation of such populations (Encalada-Abarca et al., 2023 ). Additionally, the data used in this study mainly reflect tourists’ spatial behaviour within a city. Because tourists’ spatial behaviour patterns within different destinations differ, it is necessary to use tourism networks within multiple destinations to establish comparisons in subsequent studies, which could help generalise this study’s findings. Future work could further explore the mechanisms of attraction selection by the mobility motifs, such as the fact that tourists are looking to maximise satisfaction when planning their itineraries.
Data availability
The datasets generated during and/or analysed during the current study are available from the corresponding author on reasonable request.
Ahmed NK, Neville J, Rossi RA, Duffield NG, Willke TL (2017) Graphlet decomposition: Framework, algorithms, and applications. Knowl Inf Syst 50(3):689–722. https://doi.org/10.1007/s10115-016-0965-5
Article Google Scholar
Ashworth G, Page SJ (2011) Urban tourism research: Recent progress and current paradoxes. Tour Manag 32(1):1–15. https://doi.org/10.1016/j.tourman.2010.02.002
Cao J, Li Q, Tu W, Wang F (2019) Characterizing preferred motif choices and distance impacts. PLOS ONE 14(4):e0215242. https://doi.org/10.1371/journal.pone.0215242
Article CAS PubMed PubMed Central Google Scholar
Cárdenas-García PJ, Brida JG, Segarra V (2024) Modeling the link between tourism and economic development: evidence from homogeneous panels of countries. Humanit Soc Sci Commun 11(1):1–12. https://doi.org/10.1057/s41599-024-02826-8
Chen J, Becken S, Stantic B (2022) Harnessing social media to understand tourist travel patterns in muti-destinations. Ann Tour Res Empir Insights 3(2):100079. https://doi.org/10.1016/j.annale.2022.100079
Chuang CM (2023) The conceptualization of smart tourism service platforms on tourist value co-creation behaviours: an integrative perspective of smart tourism services. Humanit Soc Sci Commun 10(1):367. https://doi.org/10.1057/s41599-023-01867-9
Costa Lda F, Rodrigues FA, Travieso G, Villas Boas PR (2007) Characterization of complex networks: A survey of measurements. Adv Phys 56(1):167–242. https://doi.org/10.1080/00018730601170527
Article ADS Google Scholar
Encalada-Abarca L, Ferreira CC, Rocha J (2023) Revisiting city tourism in the longer run: An exploratory analysis based on LBSN data. Curr Issues Tourism:1–16. https://doi.org/10.1080/13683500.2023.2182669
Fan C, Yang Y, Mostafavi A (2024) Neural embeddings of urban big data reveal spatial structures in cities. Humanit Soc Sci Commun 11(1):1–15. https://doi.org/10.1057/s41599-024-02917-6
Fennell DA (1996) A tourist space-time budget in the Shetland Islands. Ann Tour Res 23(4):811–829. https://doi.org/10.1016/0160-7383(96)00008-4
Füller H, Michel B (2014) Stop Being a Tourist!” new dynamics of urban tourism in Berlin-Kreuzberg. Int J Urban Reg Res 38(4):1304–1318. https://doi.org/10.1111/1468-2427.12124
Gao J, Peng P, Lu F, Claramunt C (2022) A multi-scale comparison of tourism attraction networks across China. Tour Manag 90:104489. https://doi.org/10.1016/j.tourman.2022.104489
García-Palomares JC, Gutiérrez J, Mínguez C (2015) Identification of tourist hot spots based on social networks: A comparative analysis of European metropolises using photo-sharing services and GIS. Appl Geogr 63:408–417. https://doi.org/10.1016/j.apgeog.2015.08.002
Girardin F, Calabrese F, Dal Fiore FD, Ratti C, Blat J (2008) Digital footprinting: Uncovering tourists with user-generated content. IEEE Pervas Comput 7(4):36–43. https://doi.org/10.1109/MPRV.2008.71
Golledge RG (1978) Representing, interpreting, and using cognized environments. Pap Reg Sci Assoc 41(1):168–204. https://doi.org/10.1007/BF01936415
Golledge RG (1997) Spatial behavior: A geographic perspective. Guilford Press, New York
Google Scholar
González MC, Hidalgo CA, Barabási AL (2008) Understanding individual human mobility patterns. Nature 453(7196):779–782. https://doi.org/10.1038/nature06958
Article ADS CAS PubMed Google Scholar
Grinberger AY, Shoval N, McKercher B (2014) Typologies of tourists’ time–space consumption: A new approach using GPS data and GIS tools. Tour Geogr 16(1):105–123. https://doi.org/10.1080/14616688.2013.869249
Grochow JA, Kellis M (2007) Network motif discovery using subgraph enumeration and symmetry-breaking. In: Speed T, Huang H (eds), Research in computational molecular biology. Springer, Berlin, p 92–106. https://doi.org/10.1007/978-3-540-71681-5_7
Han H, Kim S, Otoo FE (2018) Spatial movement patterns among intra-destinations using social network analysis. Asia Pac J Tour Res 23(8):806–822. https://doi.org/10.1080/10941665.2018.1493519
Hardy A, Birenboim A, Wells M (2020) Using geoinformatics to assess tourist dispersal at the state level. Ann Tour Res 82:102903. https://doi.org/10.1016/j.annals.2020.102903
Hassan SS (2000) Determinants of market competitiveness in an environmentally sustainable tourism industry. J Travel Res 38(3):239–245. https://doi.org/10.1177/004728750003800305
Hwang Y-H, Gretzel U, Fesenmaier DR (2006) Multicity trip patterns. Ann Tour Res 33(4):1057–1078. https://doi.org/10.1016/j.annals.2006.04.004
Jiang C, Phoong SW (2023) A ten-year review analysis of the impact of digitization on tourism development (2012–2022). Humanit Soc Sci Commun. 10:665. https://doi.org/10.1057/s41599-023-02150-7
Jin C, Cheng J, Xu J (2018) Using user-generated content to explore the temporal heterogeneity in tourist mobility. J Travel Res 57(6):779–791. https://doi.org/10.1177/0047287517714906
Kang S, Lee G, Kim J, Park D (2018) Identifying the spatial structure of the tourist attraction system in South Korea using GIS and network analysis: An application of anchor-point theory. J Destin Mark Manag 9:358–370. https://doi.org/10.1016/j.jdmm.2018.04.001
Kashani ZRM, Ahrabian H, Elahi E, Nowzari-Dalini A, Ansari ES, Asadi S, Mohammadi S, Schreiber F, Masoudi-Nejad A (2009) Kavosh: A new algorithm for finding network motifs. BMC Bioinforma 10(1):1–12
Kashtan N, Itzkovitz S, Milo R, Alon U (2002). Mfinder tool guide: Technical report
Kim S-E, Lee KY, Shin SI, Yang S-B (2017) Effects of tourism information quality in social media on destination image formation: The case of Sina Weibo. Inf Manag 54(6):687–702. https://doi.org/10.1016/j.im.2017.02.009
Korstanje ME (2018) The theory of mobilities: a critical analysis. In: The Mobilities Paradox. Edward Elgar Publishing, Cheltenham, UK, p 10-37. https://doi.org/10.4337/9781788113311.00005
Lau G, McKercher B (2006) Understanding tourist movement patterns in a destination: A GIS approach. Tour Hosp Res 7(1):39–49. https://doi.org/10.1057/palgrave.thr.6050027
Leng Y, Babwany NA, Pentland A (2021) Unraveling the association between socioeconomic diversity and consumer price index in a tourism country. Humanit Soc Sci Commun 8:157. https://doi.org/10.1057/s41599-021-00822-w
Leung XY, Wang F, Wu B, Bai B, Stahura KA, Xie Z (2012) A social network analysis of overseas tourist movement patterns in Beijing: The impact of the Olympic Games. Int J Tour Res 14(5):469–484. https://doi.org/10.1002/jtr.876
Lew A, McKercher B (2006) Modeling tourist movements. Ann Tour Res 33(2):403–423. https://doi.org/10.1016/j.annals.2005.12.002
Liu B, Huang S, Fu H, Fu H, Fu H (2017) An application of network analysis on tourist attractions: The case of Xinjiang, China. Tour Manag 58:132–141. https://doi.org/10.1016/j.tourman.2016.10.009
Lozano S, Gutiérrez E (2018) A complex network analysis of global tourism flows. Int J Tour Res 20(5):588–604. https://doi.org/10.1002/jtr.2208
Lue C-C, Crompton JL, Fesenmaier DR (1993) Conceptualization of multi-destination pleasure trips. Ann Tour Res 20(2):289–301. https://doi.org/10.1016/0160-7383(93)90056-9
Merriman P (2012) Mobility, space and culture. Routledge, New York. https://doi.org/10.4337/9781800881426
Milo R, Shen-Orr S, Itzkovitz S, Kashtan N, Chklovskii D, Alon U (2002) Network motifs: Simple building blocks of complex networks. Science 298(5594):824–827. https://doi.org/10.1126/science.298.5594.824
Mou N, Zheng Y, Makkonen T, Yang T, Tang J, Song Y (2020) Tourists’ digital footprint: The spatial patterns of tourist flows in Qingdao, China. Tour Manag 81:104151. https://doi.org/10.1016/j.tourman.2020.104151
Nguyen HTT, Nguyen TX (2023) Understanding customer experience with Vietnamese hotels by analyzing online reviews. Humanit Soc Sci Commun 10:618. https://doi.org/10.1057/s41599-023-02098-8
Omidi S, Schreiber F, Masoudi-Nejad A (2009) MODA: An efficient algorithm for network motif discovery in biological networks. Genes Genet Syst 84(5):385–395. https://doi.org/10.1266/ggs.84.385
Article PubMed Google Scholar
Oppermann M (1995) A model of travel itineraries. J Travel Res 33(4):57–61. https://doi.org/10.1177/004728759503300409
Park S, Zhong RR (2022) Pattern recognition of travel mobility in a city destination: Application of network motif analytics. J Travel Res 61(5):1201–1216. https://doi.org/10.1177/00472875211024739
Park S, Zu J, Xu Y, Zhang F, Liu Y, Li J (2023) Analyzing travel mobility patterns in city destinations: Implications for destination design. Tour Manag 96:104718. https://doi.org/10.1016/j.tourman.2022.104718
Peeters P, Gössling S, Klijs J, Milano C, Novelli M, Dijkmans C, Eijgelaar E, Hartman S, Heslinga J, Isaac R, Mitas O (2018) Overtourism: Impact and possible policy responses. Res Trans Comm 23:19
Peng H, Zhang J, Liu Z, Lu L, Yang L (2016) Network analysis of tourist flows: A cross-provincial boundary perspective. Tour Geogr 18(5):561–586. https://doi.org/10.1080/14616688.2016.1221443
Ribeiro P, Silva F (2010) g-tries: An efficient data structure for discovering network motifs. In: Proceedings of the 2010 ACM symposium on applied computing, p 1559–1566. https://doi.org/10.1145/1774088.1774422
Roy S, Al Musawi AF, Ghosh P (2023) Inferring links in directed complex networks through feed forward loop motifs. Humanit Soc Sci Commun 10:358. https://doi.org/10.1057/s41599-023-01863-z
Schneider CM, Belik V, Couronné T, Smoreda Z, González MC (2013) Unravelling daily human mobility motifs. J R Soc Interface 10(84):20130246. https://doi.org/10.1098/rsif.2013.0246
Article PubMed PubMed Central Google Scholar
Shi B, Zhao J, Chen PJ (2017) Exploring urban tourism crowding in Shanghai via crowdsourcing geospatial data. Curr Issues Tour 20(11):1186–1209. https://doi.org/10.1080/13683500.2016.1224820
Shih H-Y (2006) Network characteristics of drive tourism destinations: An application of network analysis in tourism. Tour Manag 27(5):1029–1039. https://doi.org/10.1016/j.tourman.2005.08.002
Shoval N, Kahani A, De Cantis S, Ferrante M (2020) Impact of incentives on tourist activity in space-time. Ann Tour Res 80:102846. https://doi.org/10.1016/j.annals.2019.102846
Smallwood CB, Beckley LE, Moore SA (2011) An analysis of visitor movement patterns using travel networks in a large marine park, north-western Australia. Tourism Manag S0261517711001129. https://doi.org/10.1016/j.tourman.2011.06.001
Stienmetz JL, Fesenmaier DR (2015) Estimating value in Baltimore, Maryland: An attractions network analysis. Tour Manag 50:238–252. https://doi.org/10.1016/j.tourman.2015.01.031
Su R, McBride EC, Goulias KG (2020) Pattern recognition of daily activity patterns using human mobility motifs and sequence analysis. Transp Res C 120:102796. https://doi.org/10.1016/j.trc.2020.102796
Su W, Yang Y, Gu C (2003) A study on the evaluation of competitive power of urban tourism. Tour Trib 18(03):39–42
Su X, Spierings B, Dijst M, Tong Z (2020) Analysing trends in the spatio-temporal behaviour patterns of mainland Chinese tourists and residents in Hong Kong based on Weibo data. Curr Issues Tour 23(12):1542–1558. https://doi.org/10.1080/13683500.2019.1645096
Tzanelli R (2021) Frictions in cosmopolitan mobilities: the ethics and social practices of movement across cultures. Edward Elgar Publishing, Cheltenham, UK. https://doi.org/10.4337/9781800881426
Urry J (2008) Moving on the mobility turn. In: Tracing Mobilities. Routledge, New York, p 13-23. https://doi.org/10.4324/9781315550459
Vu HQ, Li G, Law R, Ye BH (2015) Exploring the travel behaviors of inbound tourists to Hong Kong using geotagged photos. Tour Manag 46:222–232. https://doi.org/10.1016/j.tourman.2014.07.003
Wang Z, Liu Q, Xu J, Fujiki Y (2020) Evolution characteristics of the spatial network structure of tourism efficiency in China: A province-level analysis. J Destin Mark Manag 18:100509. https://doi.org/10.1016/j.jdmm.2020.100509
Wernicke S, Rasche F (2006) FANMOD: A tool for fast network motif detection. Bioinformatics 22(9):1152–1153. https://doi.org/10.1093/bioinformatics/btl038
Article CAS PubMed Google Scholar
Xia JC, Zeephongsekul P, Arrowsmith C (2009) Modelling spatio-temporal movement of tourists using finite Markov chains. Math Comput Simul 79(5):1544–1553. https://doi.org/10.1016/j.matcom.2008.06.007
Article MathSciNet Google Scholar
Xia JC, Zeephongsekul P, Packer D (2011) Spatial and temporal modelling of tourist movements using Semi-Markov processes. Tour Manag 32(4):844–851. https://doi.org/10.1016/j.tourman.2010.07.009
Xiao-Ting H, Bi-Hu W (2012) Intra-attraction tourist spatial-temporal behaviour patterns. Tour Geogr 14(4):625–645. https://doi.org/10.1080/14616688.2012.647322
Xu T, Chen R, Chen W, Zheng L, Zhang Y (2022) Comparing the spatiotemporal behavior patterns of local, domestic and overseas tourists in Beijing based on multi-source social media big data. Asia Pac J Tour Res 27(7):692–711. https://doi.org/10.1080/10941665.2022.2119419
Xu J, Su, T, Cheng X, Chen H (2024) Exploring the destination network in the context of tourism mobility: a multi-scale analytical framework. Curr Issues Tour. https://doi.org/10.1080/13683500.2024.2334830
Xue L, Zhang Y (2020) The effect of distance on tourist behavior: A study based on social media data. Ann Tour Res 82:102916. https://doi.org/10.1016/j.annals.2020.102916
Yang L, Wu L, Liu Y, Kang C (2017) Quantifying tourist behavior patterns by travel motifs and geo-tagged photos from Flickr. ISPRS Int J Geo Inf 6(11):345. https://doi.org/10.3390/ijgi6110345
Yu S, Feng Y, Zhang D, Bedru HD, Xu B, Xia F (2020) Motif discovery in networks: A survey. Comput Sci Rev 37:100267. https://doi.org/10.1016/j.cosrev.2020.100267
Zach F, Gretzel U (2011) Tourist-activated networks: Implications for dynamic bundling and en route recommendations. Inf Technol Tour 13(3):229–238. https://doi.org/10.3727/109830512X13283928066959
Zeng B (2018) Pattern of Chinese tourist flows in Japan: A Social Network Analysis perspective. Tour Geogr 20(5):810–832. https://doi.org/10.1080/14616688.2018.1496470
Zhang Y, Guo X, Su Y, Koura H, Wang Na, Song W (2023) Changes in spatiotemporal pattern and network characteristics in population migration of China’s cities before and after COVID-19. Humanit Soc Sci Commun 10:673. https://doi.org/10.1057/s41599-023-02201-z
Article CAS Google Scholar
Zheng Y, Mou N, Zhang L, Makkonen T, Yang T (2021) Chinese tourists in Nordic countries: An analysis of spatio-temporal behavior using geo-located travel blog data. Comput Environ Urban Syst 85:101561. https://doi.org/10.1016/j.compenvurbsys.2020.101561
Download references
Acknowledgements
Special thanks to Prof. Yang Xu for his advice in writing and conceptualization. This study was supported by the National Natural Science Foundation of China under Grant [number 41830645] and Yunnan Provincial Science and Technology Project at Southwest United Graduate School [number 202302AO370012]. The first author - Ding would like to thank to his fiancée, Lanqi Liu, for her help in coding and figure drawing. And her encouragement during Ding’s hard time was key to the final publication of this paper.
Author information
Authors and affiliations.
Institute of Remote Sensing and Geographical Information Systems, School of Earth and Space Sciences, Peking University, Beijing, People’s Republic of China
Ding Ding, Yunhao Zheng, Yi Zhang & Yu Liu
Southwest United Graduate School, Kunming, People’s Republic of China
You can also search for this author in PubMed Google Scholar
Contributions
Ding Ding: Conceptualization of this study, Methodology, Formal analysis, Investigation, Visualization, Writing - Original Draft. Yunhao Zheng: Conceptualization, Methodology, Visualization, Writing - Reviewing and Editing. Yi Zhang: Conceptualization, Data Curation, Validation, Writing - Reviewing. Yu Liu: Resources, Writing - Reviewing, Project administration, Supervision, Funding acquisition.
Corresponding author
Correspondence to Yi Zhang .
Ethics declarations
Competing interests.
The authors declare no competing interests.
Ethical approval is not required as the study does not involve human participants.
Informed consent
This article does not contain any studies with human participants performed by any of the authors.
Additional information
Publisher’s note Springer Nature remains neutral with regard to jurisdictional claims in published maps and institutional affiliations.
Rights and permissions
Open Access This article is licensed under a Creative Commons Attribution 4.0 International License, which permits use, sharing, adaptation, distribution and reproduction in any medium or format, as long as you give appropriate credit to the original author(s) and the source, provide a link to the Creative Commons licence, and indicate if changes were made. The images or other third party material in this article are included in the article’s Creative Commons licence, unless indicated otherwise in a credit line to the material. If material is not included in the article’s Creative Commons licence and your intended use is not permitted by statutory regulation or exceeds the permitted use, you will need to obtain permission directly from the copyright holder. To view a copy of this licence, visit http://creativecommons.org/licenses/by/4.0/ .
Reprints and permissions
About this article
Cite this article.
Ding, D., Zheng, Y., Zhang, Y. et al. Understanding attractions’ connection patterns based on intra-destination tourist mobility: A network motif approach. Humanit Soc Sci Commun 11 , 636 (2024). https://doi.org/10.1057/s41599-024-03093-3
Download citation
Received : 19 October 2023
Accepted : 22 April 2024
Published : 17 May 2024
DOI : https://doi.org/10.1057/s41599-024-03093-3
Share this article
Anyone you share the following link with will be able to read this content:
Sorry, a shareable link is not currently available for this article.
Provided by the Springer Nature SharedIt content-sharing initiative
Quick links
- Explore articles by subject
- Guide to authors
- Editorial policies

Neurobiology-based Cognitive Biotypes Using Multi-scale Intrinsic Connectivity Networks in Psychotic Disorders
- Find this author on Google Scholar
- Find this author on PubMed
- Search for this author on this site
- ORCID record for Pablo Andrés-Camazón
- ORCID record for Covadonga Martínez Diaz-Caneja
- ORCID record for Vince D. Calhoun
- ORCID record for Armin Iraji
- For correspondence: [email protected]
- Info/History
- Supplementary material
- Preview PDF
Objective Understanding the neurobiology of cognitive dysfunction in psychotic disorders remains elusive, as does developing effective interventions. Limited knowledge about the biological heterogeneity of cognitive dysfunction hinders progress. This study aimed to identify subgroups of patients with psychosis with distinct patterns of functional brain alterations related to cognition (cognitive biotypes).
Methods B-SNIP consortium data (2,270 participants including participants with psychotic disorders, relatives, and controls) was analyzed. Researchers used reference-informed independent component analysis and the NeuroMark 100k multi-scale intrinsic connectivity networks (ICN) template to obtain subject-specific ICNs and whole-brain functional network connectivity (FNC). FNC features associated with cognitive performance were identified through multivariate joint analysis. K-means clustering identified subgroups of patients based on these features in a discovery set. Subgroups were further evaluated in a replication set and in relatives.
Results Two biotypes with different functional brain alteration patterns were identified. Biotype 1 exhibited brain-wide alterations, involving hypoconnectivity in cerebellar-subcortical and somatomotor-visual networks and worse cognitive performance. Biotype 2 exhibited hyperconnectivity in somatomotor-subcortical networks and hypoconnectivity in somatomotor-high cognitive processing networks, and better preserved cognitive performance. Demographic, clinical, cognitive, and FNC characteristics of biotypes were consistent in discovery and replication sets, and in relatives. 70.12% of relatives belonged to the same biotype as their affected family members.
Conclusions These findings suggest two distinctive psychosis-related cognitive biotypes with differing functional brain patterns shared with their relatives. Patient stratification based on these biotypes instead of traditional diagnosis may help to optimize future research and clinical trials addressing cognitive dysfunction in psychotic disorders.
Competing Interest Statement
PAC has received travel support from Neuraxpharm and ROVI. CDC has received honoraria or travel support from Angelini and Janssen. JC, RB, VC, and AI report no financial relationships with commercial interests.
Funding Statement
PAC has received grant support from Programa Intramural de Impulso a la I+D+i 2023 (Instituto de Investigacion Sanitaria Gregorio Maranon). CDC has received grant support from Instituto de Salud Carlos III, Spanish Ministry of Science and Innovation (PI20/00721, JR19/00024) and the European Commission (grant 101057182, project Youth-GEMs). VC has received grant support from the National Institutes of Health (R01MH123610). AI has received grant support from the National Institutes of Health (R01MH123610).
Author Declarations
I confirm all relevant ethical guidelines have been followed, and any necessary IRB and/or ethics committee approvals have been obtained.
The details of the IRB/oversight body that provided approval or exemption for the research described are given below:
The storage and management of the data and access procedures are overseen by the National Institute of Mental Health (NIMH) through the National Data Archive (NDA). The Institutional Review Board approved the project at each participating institution: Athens, GA (University of Georgia, B-SNIP2 only); Baltimore, MD (University of Maryland School of Medicine, B-SNIP1 only); Boston, MA (Harvard Medical School), Chicago IL (University of Illinois-Chicago for B-SNIP1 and University of Chicago for B-SNIP2); Dallas, TX (University of Texas Southwestern Medical Center), Detroit MI (Wayne State University, B-SNIP1 only); and Hartford, CT (Yale University School of Medicine).
I confirm that all necessary patient/participant consent has been obtained and the appropriate institutional forms have been archived, and that any patient/participant/sample identifiers included were not known to anyone (e.g., hospital staff, patients or participants themselves) outside the research group so cannot be used to identify individuals.
I understand that all clinical trials and any other prospective interventional studies must be registered with an ICMJE-approved registry, such as ClinicalTrials.gov. I confirm that any such study reported in the manuscript has been registered and the trial registration ID is provided (note: if posting a prospective study registered retrospectively, please provide a statement in the trial ID field explaining why the study was not registered in advance).
I have followed all appropriate research reporting guidelines, such as any relevant EQUATOR Network research reporting checklist(s) and other pertinent material, if applicable.
Data Availability
The storage and management of the data and access procedures are overseen by the National Institute of Mental Health (NIMH) through the National Data Archive (NDA).
https://nda.nih.gov/
View the discussion thread.
Supplementary Material
Thank you for your interest in spreading the word about medRxiv.
NOTE: Your email address is requested solely to identify you as the sender of this article.

Citation Manager Formats
- EndNote (tagged)
- EndNote 8 (xml)
- RefWorks Tagged
- Ref Manager
- Tweet Widget
- Facebook Like
- Google Plus One
Subject Area
- Psychiatry and Clinical Psychology
- Addiction Medicine (325)
- Allergy and Immunology (633)
- Anesthesia (168)
- Cardiovascular Medicine (2408)
- Dentistry and Oral Medicine (290)
- Dermatology (207)
- Emergency Medicine (382)
- Endocrinology (including Diabetes Mellitus and Metabolic Disease) (854)
- Epidemiology (11805)
- Forensic Medicine (10)
- Gastroenterology (705)
- Genetic and Genomic Medicine (3776)
- Geriatric Medicine (350)
- Health Economics (637)
- Health Informatics (2411)
- Health Policy (940)
- Health Systems and Quality Improvement (905)
- Hematology (343)
- HIV/AIDS (788)
- Infectious Diseases (except HIV/AIDS) (13350)
- Intensive Care and Critical Care Medicine (769)
- Medical Education (370)
- Medical Ethics (105)
- Nephrology (402)
- Neurology (3529)
- Nursing (199)
- Nutrition (529)
- Obstetrics and Gynecology (682)
- Occupational and Environmental Health (670)
- Oncology (1836)
- Ophthalmology (540)
- Orthopedics (222)
- Otolaryngology (287)
- Pain Medicine (234)
- Palliative Medicine (67)
- Pathology (448)
- Pediatrics (1040)
- Pharmacology and Therapeutics (426)
- Primary Care Research (424)
- Psychiatry and Clinical Psychology (3199)
- Public and Global Health (6190)
- Radiology and Imaging (1294)
- Rehabilitation Medicine and Physical Therapy (751)
- Respiratory Medicine (832)
- Rheumatology (380)
- Sexual and Reproductive Health (375)
- Sports Medicine (324)
- Surgery (407)
- Toxicology (50)
- Transplantation (173)
- Urology (147)
COMMENTS
Hexagonal pattern. Minimum travel pattern. Grid pattern. Linear pattern. 1. Rectangular or Block Pattern. In this type of road pattern, the complete area is divided into a rectangle or block-shaped plots to create a rectangle or block pattern. Streets and roads in block patterns intersect at a 90° (right angle).
Researchers from the MIT Senseable City Lab have uncovered a new travel pattern in human mobility that remains consistent across four continents, reports Beck Ferreira for Motherboard.. "The notion that distance and frequency of visitation are related is in accordance with intuition," the researchers explain.
Thus, the main contribution of this study is the opportunity to adapt the destination to tourists by identifying consumer-based destinations boundaries and the factors that influence the specific travel patterns within the destinations. Ultimately, these travel patterns determine the size and shape of destinations from a social construction ...
Understanding the travel patterns of individuals is a more complex task. Geographers and economists began to address the issue in the 1970s with the application of utility theory. In this case, travel decisions are discrete choices made on the basis of the utility of each alternative available. The utility of an alternative is a function of its ...
International tourist arrivals have grown steadily from 25 million in 1950 to a total of 1.186 billion arrivals in 2015. This growth is projected to continue and according to World Tourism Organization (UNWTO) forecasts, international tourist arrivals will increase to 1.8 billion by 2030. 1 In addition to this significant market growth, tourism ...
(See for example Passenger behavior in Shanghai) Data These ... One of the presented studies, conducted by Nobis et al., revealed that the gender difference in travel patterns is linked to employment status, household structure, child care, and maintenance tasks. They found that travel patterns of men and women are much similar when considering ...
While the reasons and/or patterns may be similar, contemporary factors can impact on a generation's experiences. The advances in technology (internet, social media and smartphones), for example, have fostered internet-based travel services, thus, altering traveller expectations, and resultant travel experiences. Conclusions and recommendations
Traffic Pattern Operations - Parallel Runways. The traffic pattern is divided into legs which form a rectangle. Legs define a phase of flight associated with takeoff, landing, or closed pattern touch and go operations. The following terminology for the various components of a traffic pattern has been adopted as standard for use by control ...
Travel demand models use current travel behavior to predict future travel patterns from a sample of travel behavior data. As you might expect, models are critical tools for planners and engineers who use them to forecast the transportation needs of the communities they serve. They also help transportation professionals assess the pros and cons ...
More than 80% of the tourists have an average travel time less than 1 h, while the total travel time mostly ranges from < 1 h to 2-3 h. 44.25% of the tourists stop at each attraction for 2-3 h on average, while the total activity time of 2-4 h and 4-6 h accounted for the most with 34.77% and 37.18% respectively.
In our dataset, people show irregular spatiotemporal travel patterns. For example, many of them commonly conduct non-Work activities (e.g., eating, drink) during work hours or work at multiple ...
Different people travel for different reasons and understanding the factors that affect travel can be helpful for managing or planning any tourist facility or event. With this course, you will learn how tourists choose their travel destinations. This can help your tourist business maximize its profits and performance. COURSE PUBLISHER -.
Travel patterns may not necessarily repeat periodically or may repeat over unconventional periods not aligned with the typical day or week. To some extent, periodicity is a special type of ... For example, using the 7-day Toronto Travel Activity Panel Survey, [12] modeled the frequency of 15 non-home/work activity categories for the 7 days of ...
Rectangular or Block Pattern. Radial Pattern. Hexagonal Pattern. Minimum travel Pattern. Let us learn about each of the given road patterns, in detail below: 1. Rectangular Or Block Pattern: In a rectangular or block pattern, the whole area is divided into rectangular or block-shaped plots.
of processing large-scale passive data such as cellular netw ork data. and smart card data for extracting travel patterns that are relev ant. for use in tra c planning applications. The focus of ...
repeating the travelling leg, may travel to a The organised mass tourists largely confine number of attractions or places within a their activities to their 'environmental bubble', region.This pattern can be seen as a combi- They have well-planned itineraries. Their itin nation of some or all patterns mentioned eraries, time-budget ...
The travel sequences were separated into pairs and a matrix to analyse the travel patterns as a network. For example, if five tourists visited destinations A, B, and C, the travel sequences will be transferred from A to B with a volume of five, and B to C also with a value of five. Following this data matrix, a travel network was generated.
Here main roads radiate from a central point and are connected with concentric circle roads (ring roads) radiating outwardly.. Pros of Radial or Star & Circular Pattern. It is safe as compared to the above patterns because vehicles travel in the same direction.; Roundabouts present in this pattern improves the efficiency of traffic flow.This also reduces fuel consumptions and emissions of the ...
This gallery of submissions to the 2019 National Geographic Travel Photo Contest reveals natural patterns and designs that captured the eyes—and lenses—of photographers from around the world ...
Rectangular or Block Pattern. a. In this pattern, the whole area is divided into rectangular blocks. b. Streets or branch roads intersect with each other at the right angle. c. The main roads always pass through the center and should be wide enough. d. Branch roads may be narrow as compared to main roads.
Examples of Travel pattern in a sentence. The site visit was intended to identify and understand the following: • Identifyo Important traffic generatorso Homogeneous sections of the expresswayo Alternative diversion routes available• Travel pattern of the study region• Existing and proposed Land use pattern along the proposed expressway alignment• Sensitive & special areas requiring ...
Tourist mobility encompasses tourists' flow, movement, dispersal, and travel patterns across space and time (Hardy et al., 2020; ... For example, for the core attractions, overall tourism ...
Define travel pattern change as abrupt, substantial, and persistent changes in the underlying pattern. ... For example, the travel behavior of user 1 in Fig. 3 a resembles that of a typical commuter, whose trips are concentrated in the morning and afternoon peak hours, mostly between two locations. Download : Download high-res image ...
6) Minimum Travel Pattern : In this road pattern, city is contented by sector center, suburban center and neighborhood center by the road which required minimum to connect the city center.
Objective: Understanding the neurobiology of cognitive dysfunction in psychotic disorders remains elusive, as does developing effective interventions. Limited knowledge about the biological heterogeneity of cognitive dysfunction hinders progress. This study aimed to identify subgroups of patients with psychosis with distinct patterns of functional brain alterations related to cognition ...