How to Edit Webpages on Safari Using Inspect Element
Here's how you can tinker with text and images on a website through Safari's nifty Inspect Element developer tool.
With its Inspect Element tool, Safari lets you tinker with the front-end code of any webpage. If you want to test what a page would look like with different text or images, you can do so by altering its code with Inspect Element.
This is a simple guide aimed at beginners to explain how you can begin experimenting with Inspect Element in Safari to edit a website's text and images with minimal coding knowledge.

What Is Inspect Element?
Inspect Element is a developer tool. It's available on Safari, though also on other web browsers like Chrome, Firefox, and Edge. With Inspect Element, you can peek behind the curtain of a website to reveal its front-end code, like the HTML and CSS. However, it doesn't grant you visibility of the back-end, like its databases.
Not only can you see this code, but you can tweak it too. This means that you can change the appearance of a website. You can replace an image, rephrase some text, use a different font, switch its color scheme, and more. However, these edits are local. They won't appear to anyone else except you; they disappear once you refresh or move away from the page.
Why Should You Use Inspect Element?
Inspect Element is a great tool if you're a budding web developer. You can literally see the code that powers your favorite website, tweaking it as you wish in a real-world environment. There are many fun insights you can gain from using Inspect Element .
For example, business owners can look at keywords included in a competitor's website, or designers can use Inspect Element to identify a font that they find attractive or to quickly test a different color scheme on their website .
For now, we're going to focus on editing the basics of a webpage using Inspect Element.
How to Access Inspect Element on Safari
You can open Inspect Element on Safari using the developer menu:
- Open Safari.
- Click Safari in the top menu bar.
- From the dropdown menu, select Preferences .
- Select the Advanced option.
- Check the box that says Show Develop menu in menu bar .
After selecting this option, you can right-click on a webpage and select Inspect Element . Alternatively, you can select Develop in the menu bar, and then Show Web Inspector .
How to Find Web Elements in Inspect Element
To begin editing an element, right-click what you wish to edit and click Inspect Element . This will open the developer window, with the relevant section highlighted. You might find that the particular element you wish to element (the image or the text, say) is hidden; to locate it, use the arrows on the left to expand the nested sections.
To help narrow your selection down, click the target icon from the Inspect Element toolbar. Now, as you navigate through the code, it highlights that section on the website. Or you can use your cursor to pinpoint a section on the site. This is handy for when you want to hone in on something particular in a crowded area of a webpage.
How to Edit a Website's Text Using Inspect Element
To make a piece of text editable after finding it in a site’s source code, double-click it. You can type new text directly into the code, or delete existing text. When editing is complete for a given string of text, hit Enter , and the text on the webpage will change.
It's really as simple as that! The only times this won't work are when the text is actually part of an image, like a logo.
How to Edit a Website's Images Using Inspect Element
While images appear visually to you on the front-end, in the website code they appear as links. You can right-click and image and choose Inspect Element to jump to where that image is in the code. Website images typically have JPG, GIF, or PNG file extensions, though not exclusively.
Double-click these image strings and you can edit them, or just save them to your system if desired. If you want to replace the image, switch it out for a replacement image URL. Or you can delete the code string entirely to remove the image from view.
Dig Into Websites Using Safari
Safari's Inspect Element tool lets you easily find and change the code corresponding to text and images, which is as easy as switching out a text or URL string. Once you're done editing a website with Inspect Element, simply refresh the page and everything will be back to normal.
How to Inspect Element on Safari for Mac
This is how you Inspect Element on Safari for macOS

When you know how to Inspect Element on Safari for Mac, you can delve into the HTML and CSS code of a web page, to see how it's really functioning behind the scenes or to make changes to how the site looks or functions (these are only temporary and the changes will be discarded after you close your browser).
If you're on a website you've built, you can use Inspect Element to debug issues with a page's front end.
Chrome and Firefox users will be used to simply right clicking on a page element and then selecting Inspect Element. However, with Safari the Inspect Element feature is not enabled by default, so you may be scratching your head about where to find it, especially if you're unfamiliar with Apple's browser. To enable Inspect Element, you first have to switch on Safari's Developer Menu.
If you aren't sure how, fear not, as this guide will show you exactly how to Inspect Element on Safari. All you need to do is read on.
- In Safari, click Safari in the tool bar
- Click Settings and head to Advanced
- Check Show Develop menu in menu bar
- On a webpage, right click an element
- Click Inspect Element
Read on to see illustrated instructions for each step.
1. Open Safari's settings

With the browser open, click Safari in the top left, then click Settings .
2. Under Advanced, enable the Develop menu

Click the Advanced tab , then check Show Develop menu in the menu bar . You can now close the Settings window .
3. Right click and select Inspect Element

Right click a page element and select Inspect Element from the menu.
4. Inspect the page code

You can now inspect the page code in HTML and CSS. Have fun!
If you'd like to learn more ways to get the most out of your Mac, we have lots of helpful tutorials just like this one. Find out how to enable macOS beta updates , so you can see and test the new features coming to your Mac in upcoming OS releases. I
f your Mac is behaving a little sluggishly, learn how to clear the cache on Mac , as this may help speed things back up. If you're sick of screenshots sitting on your desktop and spoiling your clean background, discover how to change the screenshot save location on Mac . Messy desktop? Learn how to use desktop stacks on Mac .
Sign up to get the BEST of Tom’s Guide direct to your inbox.
Upgrade your life with a daily dose of the biggest tech news, lifestyle hacks and our curated analysis. Be the first to know about cutting-edge gadgets and the hottest deals.

Peter is Reviews Editor at Tom's Guide. As a writer, he covers topics including tech, photography, gaming, hardware, motoring and food & drink. Outside of work, he's an avid photographer, specialising in architectural and portrait photography. When he's not snapping away on his beloved Fujifilm camera, he can usually be found telling everyone about his greyhounds, riding his motorcycle, squeezing as many FPS as possible out of PC games, and perfecting his espresso shots.
Google has patched yet another Chrome zero-day bug — update your browser right now
Forget Chrome: Edge could soon become the most RAM-friendly browser
I walked 5,800 steps with the Polar Grit X2 Pro and G-Shock Move — here’s the winner
Most Popular
- 2 Forget the gym — you only need 1 pair of dumbbells and 7 moves to sculpt your back and biceps
- 3 Google Gemini Live vs ChatGPT-4o Voice — which AI assistant could win?
- 4 Google's AI smart glasses are the most exciting thing I saw at I/O — here's what you need to know
- 5 OnePlus Open 2: Second-gen OnePlus foldable not likely to launch this year
- 2 Google Gemini Live vs ChatGPT-4o Voice — which AI assistant could win?
- 3 Google's AI smart glasses are the most exciting thing I saw at I/O — here's what you need to know
- 4 OnePlus Open 2: Second-gen OnePlus foldable not likely to launch this year
- 5 Forget smart glasses — Meta exploring earphones with cameras and AI built in
How to use Safari Web Inspector on Mac, iPad, and iPhone
If you’re a web developer, then you likely already know about Safari’s Web Inspector. But if you’re just starting to use Safari for development or have just begun your Web Development career, this guide will show you the basics for getting started with the Safari Web Inspector on iOS and Mac.

What is the Safari Web Inspector?
For those not yet familiar with the tool, you can use the Safari Web Inspector for help with your web development. It allows you to review page elements, make changes, troubleshoot problems, and review page performance. Apple sums it up with:
Web Inspector is the primary web development tool in Safari. Web Inspector allows you to inspect, tweak, debug, and analyze the performance of your web content in a Safari tab.
Enable and open Safari Web Inspector
You can use the Safari Web Inspector for development on your iPhone, iPad, or Mac. Here’s how to enable and open it on iOS and macOS so you’re ready to use it when you need it.
If you’re going to use the Web Inspector frequently, whether for iOS or Mac, you might as well add the Develop tab to your menu bar so you can access it easily.
- Open Safari on your computer and click Safari > Settings or Preferences from the menu bar.
- Choose the Advanced tab.
- Check the box at the bottom for “ Show features for web developers ” or Show Develop menu in menu bar .

Now when you want to enable the Web Inspector, click Develop > Show Web Inspector from your menu bar.

If you prefer to forgo adding the Develop button to your menu bar, you can access the Web Inspector on Mac with a shortcut. Navigate to the page you want to inspect, right-click on it, and pick Inspect Element from the context menu.

Just keep in mind that if you plan to use Web Inspector for Safari on your iOS device, you’ll need the Develop button in the menu bar on your Mac.
For iPhone and iPad
To use the Web Inspector for iOS on your Mac, grab your USB cable and connect your iPhone or iPad to your computer. Then, follow these steps to enable the tool:
- Open the Settings app on your iPhone or iPad and tap Safari .
- Scroll to the bottom and tap Advanced .
- Enable the toggle for Web Inspector .

Next, make sure Safari is open on your iOS device and your Mac. After that, follow these steps:
1) Click Develop from the Safari menu bar on Mac, and you’ll see your iPhone or iPad listed here.

2) Mouse over the device, and you’ll then see the websites open in Safari on your mobile device.
3) Select the one you want, and the Web Inspector will pop open in a new window for you to use.

Note: If this is the first time you’re using your iPhone or iPad for this work, take your mouse cursor over that iPhone or iPad and click Use for Development . Next, tap Trust on your iPhone or iPad and enter the device passcode. Now, this iOS or iPadOS device is ready to be used for web inspection. If it still shows a correction error, simply unplug the USB cable and plug it in again.

Position the Safari Web Inspector
If you’re using the Web Inspector for iOS, it will remain in its own floating window.
If you’re using it for Safari on your Mac, you can change its position. By default, Web Inspector displays at the bottom of your Safari window. To detach it and place it in a separate window or dock it to the left or right side of Safari, select one of the buttons from the top left of the Inspector window.

Get to know the Web Inspector
The Safari Web Inspector has a handy toolbar and tabs with some options that you can adjust to fit your needs.
Web Inspector toolbar
- “X” to close the Inspector
- Positioning buttons
- Reload button
- Download web archive button
- Activity viewer (resource count, resource size, load time, logs, errors, warnings)
- Element selector button
Web Inspector tabs
You can use all tabs or just a few. You can right-click or hold Control and click the tabs and then check and uncheck those you want to see. Rearrange the tabs by holding and dragging them to their new positions. And all the way to the right of the tabs bar, you’ll see a Settings button. This lets you adjust settings for tabs, indents, source maps, zoom, and more.

- Elements : Current state of the page’s Document Object Model
- Network : Resources loaded by the current page
- Debugger : View the JavaScript execution, variables, and control flow
- Resources : Resources being used by the current page’s content
- Timelines : A view of what the page’s content is doing
- Storage : State that is available to the page’s content
- Canvas : Contexts created from CSS
- Console : Shows logged messages and lets you evaluate JavaScript code
For in-depth help on a specific tab, you can head to the Apple Developer Support site . Select Table of Contents > Get started in Safari Developer Tools > Web Inspector .

Good luck with your inspection!
Hopefully, this guide will help you as you start working with the Safari Web Inspector for your iPhone, iPad, or Mac web development.
If you currently use the Web Inspector and have tips and tricks you’d like to share with others who are just starting, please feel free to comment below!
Check out next: How to view the source code of a webpage in Safari
How to Use Inspect Element in Chrome, Safari, & Firefox
Published: June 20, 2023
In a way, the job of web developers and designers is to convince users that a website is one singular entity, more than just a series of HTML elements formatted to look nice. With the right tools, however, even non-developers can peel back the curtain on any website to see what’s really happening behind the scenes.

You might be familiar with the classic “view page source” trick, which displays the raw HTML of a page in the browser window. But, there’s a better way to do your detective work: The inspect element feature lets us view and even modify any website’s front-end, which can be quite useful when building a website or learning how websites work .
In this post, we’ll discuss what it means to “inspect” page elements, and how to do so on three common web browsers. If you’re in a pinch, jump ahead to what you’re looking for.
- How to Inspect Elements in Chrome
- How to Inspect Elements in Safari
- How to Inspect Elements in Firefox
What does ‘inspect element’ mean?
Inspect element is a feature of modern web browsers that enables anyone to view and edit a website’s source code, including its HTML, CSS, JavaScript, and media files. When the source code is modified with the inspect tool, the changes are shown live inside the browser window.
Inspect is a web professional’s scout team. Developers, designers, and marketers frequently use it to peek inside any website (including their own) to preview content and style changes, fix bugs, or learn how a particular website is built. For instance, if you find an intriguing interface on a competing website, inspect element lets you see the HTML and CSS that make it up.
You can also think of your browser’s inspect feature as a “sandbox” of sorts: Play around with a web page as much as you want by changing content, colors, fonts, layouts, etc. When finished, just refresh the page to revert everything to normal. Inspect doesn’t change the website itself — only how it appears in your browser — so feel free to experiment!

Free Guide: 25 HTML & CSS Coding Hacks
Tangible tips and coding templates from experts to help you code better and faster.
- Coding to Convention
- Being Browser-Friendly
- Minimizing Bugs
- Optimizing Performance
You're all set!
Click this link to access this resource at any time.
Inspect is also an incredibly valuable tool for those learning web development. Instead of viewing plain source code, use inspect element to interact with the page and see how each line of code maps to an element or style. By better understanding what constitutes the typical web page, you can communicate effectively with developers in the case of an error, or if you want to make a change.
Inspect may be a “developer tool,” but you don’t need to write any code or install any additional software to use it. You can do everything I’ve described right inside your browser — let’s learn how.
How to Inspect Elements
To inspect elements you have to right-click any part of a webpage and click Inspect > Inspect Element. Alternatively, you can press Command+Option+i on your Mac or F12 on your PC to do the same.
Every modern web browser has a native tool for inspecting elements. It can be accessed in any browser, but some browsers like Chrome and Safari have slight differences. Let’s discuss how to use the inspect tool in three desktop web browsers: Google Chrome, Apple’s Safari, and Mozilla Firefox.
How To Inspect Elements in Chrome
Chrome comes with a handy developer tool that allows you to inspect individual elements. This allows you to see the code behind a webpage, and even edit it on your own browser. (Note that the changes are only visible to you, not to anyone else across the web.)
Here's how to get started:
1. Launch Chrome and navigate to the page you want to inspect.
To use the element inspector in Google Chrome, first navigate to any web page. In these examples, I’ll be using HubSpot.com .
2. Open up the Inspect panel.
Once you arrive at your desired page, you have several ways to open Chrome's Inspect tool.
- Option 1 : Right-click any part of the page and choose Inspect . Right-clicking a specific page element will open that element in the inspector view.
- Option 2 : In the top menu bar, select View > Developer > Developer Tools .
- Option 3: Click the three-dot icon in the top right corner of the browser window. From there, choose More Tools > Developer Tools . Then, click the Inspect tab in the popup.
- Option 4 : Use the shortcut control-shift-C on Windows or command-option-C on macOS.
3. Change the location of the inspect panel.
To better view the code, you can change the position of the inspector window.
The Chrome Developer Tools panel will open at the bottom of the browser window, but sometimes it opens in a separate window altogether.
If you want to change the location of the panel, click the three-dots icon in the top right corner of the panel (next to the X icon), then choose your preferred dock position.
I’ll choose Dock to right — this makes it easier to view the rendered page and its source:

Along the top of the inspect panel, you’ll see tabs for Elements , Console , Sources , etc. These are all tools we can use to assess a page’s contents and performance. However, everything we need for inspecting is under the Elements tab.
4. Look at the source HTML code of the page.
The biggest area of the panel will contain the source HTML of the current page. Take some time to explore this region, and notice how hovering the cursor over the piece of code highlights the corresponding element on the page.
Blue indicates the contents of an element, green corresponds to padding , and areas in orange are margins .
5. Select a specific element to inspect.
Rather than trying to read through the code to find an element, we can also do the opposite — we can locate a piece of code by hovering over the page element itself. To do this, click the Element select icon in the top left corner of the panel:

Next, click a page element. You’ll see the source code revealed in the inspect panel.
6. Edit the element's text, if desired.
Besides viewing, we can use the inspect tool to alter the page contents. Let’s start by swapping out some text.
First, find some text content in the source code. Then, right-click the element and choose Edit Text — this opens an inline text input in which you can write whatever you want. When you deselect the text input, you’ll see the changes take effect:

Or, what about no text at all? Just select the element in the source code and delete it. The H1 will be gone from the page.

Don’t worry though — it will reappear when you refresh the page.
7. Hide and edit elements on the page.
You can also hide any element without deleting it by right-clicking the element in the source code and choosing Hide element .
You can even add new page elements — right-click on an element in the source code and choose Edit as HTML . You’ll see a text field where you can paste HTML. For example:

8. Edit the page's CSS code.
Moving down the Chrome inspect panel, we see the Styles tab. This shows us what CSS styling has been applied to the selected element. Click on lines of code to rewrite them, or activate/deactivate certain declarations by checking/unchecking the boxes next to them. Let’s do this for our <h1> element’s font-weight property:
9. View the page's mobile version.
Finally, let’s cover one more feature of Chrome’s inspect feature, mobile view. When building a site, designers need to consider how its pages appear on desktop, mobile, and tablet screens alike.
Fortunately, Chrome lets you preview the same web page in multiple screen resolutions. Start by clicking the Toggle device icon in the top left corner of the panel:

From here, set the screen resolution manually or choose a device preset from the menu, then see how the page layout responds. You can also rotate the screen and even preview performance at “mid-tier mobile” and “low-tier mobile” speeds.

How to Inspect Element on Mac
To inspect an element on Mac, open up Safari. Select Safari > Settings > Advanced, then toggle the option that reads Show Develop menu in menu bar. Then, access your desired webpage, right-click, and tap Inspect Element.
Let's look at how to inspect a page on Mac in more detail below, including tips and tricks. We'll be using Safari, but technically you can also inspect a page on macOS by using Chrome or Firefox.
How To Inspect Elements in Safari
Safari includes a tool, just like Google Chrome, that allows you to inspect a web page. Here's how to use it.
1. Enable Safari's developer tools.
To use Safari’s inspect tool, Web Inspector, we first need to enable Safari's developer tools. Here's how:
- On the top menu, select Safari > Preferences .
- Tap Advanced.
- Check the box next to Show Develop menu in menu bar .
- You’ll see a Develop option added to the menu above.
2. Go to your desired web page.
Next, go to the web page you'd like to inspect. For this example, I'll be using HubSpot.com again.
3. Open up Web Inspector.
There are three ways to open Web Inspector in Safari:
- Option 1 : Right-click any part of the page and choose Inspect Element . Right-clicking a specific page element will open that element in the inspector view.
- Option 2: Choose Develop > Show Web Inspector from the top menu bar.
- Option 3: Use the shortcut command-option-I .
Safari’s inspector opens at the bottom of the window by default.
To change this configuration, click the icon to dock the display on the right side or pop out in a separate window.
Both are located next to the X icon in the top left corner of the display.

4. Look at the source HTML and CSS code of the page.
Safari’s inspector panel has two columns. The first shows the source HTML, and the second shows the page CSS.
Use your cursor to explore the source HTML and see which lines of code correspond to each page region. Blue highlights the contents, green highlights the padding, and orange highlights the margins.
We can also inspect the page directly. Click the element selection icon at the top of the panel:

Now, when you click a page element, Web Inspector reveals the corresponding source code.
6. Edit, add, or delete page elements.
Like Chrome’s inspector, Safari lets us modify, add, and remove page elements. To edit the page, right-click an HTML element in the inspect panel, then choose an option from the Edit menu. Web Inspector will prompt you for new text input, then display your changes in real-time:

Or, add a new element to the page by right-clicking a line of code and choosing an option from the Add menu. In this example, I’ve added a new <h1> child element to an existing <div> :

If you want to delete a page element, simply select some code and delete it. Or, right-click and choose Toggle Visibility to hide an element without deleting it.
7. Activate or deactivate the page's CSS code.
To the right we have the Styles column, where we can change or activate/deactivate CSS declarations for any element, like so:
When testing content and style changes, you’ll want to see the effect on mobile screens as well as desktops. We cover that next.
Safari’s Responsive Design Mode allows you to preview a website across common devices.
To view the page in a mobile viewport, choose Develop > Enter Responsive Design Mode . In this mode, you can use the same inspector tools on pages formatted for Apple devices, or set the dimensions yourself:

How To Inspect Elements in Firefox
Firefox is another great option for inspecting a web page in either macOS, Windows, or Linux. Here's how to get started:
1. Open Firefox's inspect element tool.
To open the Firefox Inspector, you have several options:
- Option 1: Right-click any part of the page and choose Inspect Element . Right-clicking a specific page element will open that element in the inspector view.
- Option 2: Select Tools > Web Developer > Inspector from the top menu bar.
- Option 3: Use the shortcut control-shift-C in Windows or command-option-C in macOS.
Next, go to the web page you'd like to inspect. I'll be using HubSpot.com again.
3. Change the location of the inspector panel.
The Firefox inspector appears along the bottom of the window by default. To change its position, select the three-dots icon in the top right corner of the inspector, then choose an alternative display option.

4. Look at the HTML code of the page.
Firefox’s inspector panel is comparable in features to Chrome’s and Safari’s. The HTML source code indicates the corresponding page element with color codes — content is blue, padding is purple, and margins are yellow:
You can also find code by selecting elements on the page. To enter selection mode, click the cursor icon in the top left corner:

Click any page element to reveal its source code in the inspect panel.
6. Modify or delete page elements.
To modify or delete a page element, select its code in the inspector. Then, either double-click to change the text, or right-click and choose Edit as HTML or Create New Node to add code. Or simply delete the code and see the resulting changes on the page.

7. Toggle the page's CSS styles.
To toggle the CSS styling of an element, use the Filter Styles region at the bottom of the inspect panel. Uncheck the box next to a CSS declaration to deactivate it (or write in new code yourself):
Finally, Firefox’s tools also come with a mobile preview option. To use it, click the Responsive Design Mode icon in the top right corner of the panel:

Responsive Design Mode lets you choose from several preset screen resolutions or set your own, and you can also toggle connection speed and device pixel ratio:

Get a Closer Look With Inspect
Once you learn the basics of your browser’s inspect tool, you might realize just how much information about your favorite websites is publicly available. With a few clicks, you can explore how exactly web pages are built, what styles they use, how they optimize for search engines, how they format on mobile screens, and a lot more.
Editor's note: This article was originally published in December 2020 and has been updated for comprehensiveness.
Don't forget to share this post!
Related articles.

The Beginner's Guide to Website Development

Are .io Domains Good? Why Tech Startups Love .io Domains

15 Backend Project Ideas for Your Developer Portfolio

37 Backend Interview Questions and Answers: The Ultimate Guide 2022
![How to Build & Run an Effective Website With a Small Team or Budget [Startup Tips]](https://blog.hubspot.com/hubfs/website-on-a-budget.jpg "safari inspector edit style")
How to Build & Run an Effective Website With a Small Team or Budget [Startup Tips]

How to Code a Website for Free in 6 Easy Steps

How Long Does it Take to Build a Website?

Flush DNS: What It Is & How to Easily Clear DNS Cache
![How to Make a Website With User Accounts and Profiles [With WordPress, Wix, and More]](https://blog.hubspot.com/hubfs/how-to-create-user-accounts-and-profiles.jpeg "safari inspector edit style")
How to Make a Website With User Accounts and Profiles [With WordPress, Wix, and More]

Wildcard SSL Certificates: What They Are & How They Work
CMS Hub is flexible for marketers, powerful for developers, and gives customers a personalized, secure experience
Productivity
How to use Inspect Element in Chrome, Safari, and Firefox

There's a powerful tool hiding in your browser: Inspect Element.
Right-click on any webpage, click Inspect , and you'll see the innards of that site: its source code, the images and CSS that form its design, the fonts and icons it uses, the JavaScript code that powers animations, and more. You can see how long the site takes to load, how much bandwidth it used to download, and the exact color in its text.
Or, you could use it to temporarily change anything you want on the page.
Inspect Element is a perfect way to learn what makes the web tick, figure out what's broken on your sites, mock up what a color and font change would look like, and keep yourself from having to Photoshop out private details in screenshots. Here's how to use Inspect Element—your browser's secret superpower—to do all the above and more.
Table of contents:
Why should I use Inspect Element?

If you've never peeked at a website's code out of curiosity, you might wonder why you should learn how to use Inspect Element. Below are just a few reasons why different roles can benefit from learning this trick of the trade.
Designer: Want to preview how a site design would look on mobile? Or want to see how a different shade of green would look on a sign-up button? You can do both in seconds with Inspect Element.
Writer: Tired of blurring out your name and email in screenshots? With Inspect Element, you can instantly change any text on a webpage.
Support agent: Need a better way to tell developers what needs to be fixed on a site? Inspect Element lets you make a quick example change to show what you're talking about.
Web developer: Need to look for broken code, compare layouts, or make live edits to a page? Inspect Element does that, too.
For these and dozens of other use cases, Inspect Element is a handy tool to know. For now, let's see how to use the main Elements tab to tweak a webpage on your own.
How to inspect element on Google Chrome
Method 1: Right-click anywhere on the webpage, and at the very bottom of the menu that pops up, click Inspect .

Method 2: Click the hamburger menu (the icon with three stacked dots) on the far-right of your Google Chrome toolbar, click More Tools , then select Developer Tools .

Once you take your preferred route to opening the Developer Tools pane, by default, it will show the Elements tab—that's the famed Inspect Element tool we've been looking for.
If you want to change the orientation of the Inspect Element pane, click the three vertical dots on the top-right side of the Inspect Element pane near the "X" (which you'd click to close the pane). Now, you'll see options to move the pane to the bottom, left, or right side of your browser or to open the pane in a completely separate window (undock view).

For this tutorial, let's dock the pane on the right side of our browser window to give us more space to work. You can make the Developer Tools panel wider or narrower by hovering over the left-side border. Once the ↔ cursor appears, drag the pane left to widen it or right to narrow it.
How to inspect element on Firefox
To get to Inspect Element on Firefox you have three options (just like on Chrome).
Method 1: Right-click anywhere on the page and click Inspect at the bottom of the menu.

Method 2: Click the hamburger menu (three horizontal lines at the top-right corner of the window), select More tools , then click Web Developer Tools .

Method 3: The keyboard shortcut on Firefox is command + option + I for Macs and Control + Shift + C for PCs.
The Element pane in Firefox likes to pop up at the bottom of the window, which doesn't give you much room to work with. To move that pane to the side and free up more room, click the hamburger menu (three horizontal dots, next to the "X" in the top-right corner) and click Dock to Right (or left, if you prefer).

If you like, you can also move the pane into a separate window in this menu. You can also expand the pane further or narrow it by hovering over the edge until your cursor changes, and then drag it to the left or right.
How to inspect element on Safari
To launch Inspect Element with Safari, you'll need to activate the developer capabilities in the advanced settings first. Here's how.
Click the Safari dropdown in the top navigation bar above the Safari window, and then click Preferences .

Navigate to Advanced , and check the box at the bottom of the window by Show Develop menu in the menu bar . Close the window.

Now, you should be able to right-click anywhere on the page and click Inspect Element to open the Elements pane.

The pane should appear along the bottom of your window. To move it to a side alignment and give yourself a little more space to look at the code, click the Dock to right of window (or left of window) option on the top-left corner of the pane, next to the "X."

I prefer right, but you can easily switch this to the other side or detach the pane into its own separate window if you prefer. To make the pane wider or narrower, just hover over the edge until the cursor changes to the dragger, then drag to move the edge.
Tools you can access through Inspect Element (+ tutorials)
Now that we're in Inspect Element, there's an array of useful tools at our fingertips that we can use to make any site look exactly how we want. For this tutorial, we'll focus on the Search , Elements , and Emulation tabs. These aren't the only useful tools Inspect Element opens up—not by a long shot—but they're extremely helpful ones that beginners can start putting to use right away.
Note that, for simplicity, I'll be using Chrome to demonstrate, but the instructions should be essentially the same for all three browsers.
Use Inspect Element Search to find anything on a site
Wondering what goes into your favorite sites? Search is your best tool for that, aside from reading a site's entire source code.
You can open the default Elements view, press Ctrl + F or command + F , and search through the source code. But the full Search tool will also let you search through every file on a page, helping you find text inside CSS and JavaScript files or locate an icon image you need for an article.

In the search field, you can type anything— anything —that you want to find on this webpage, and it will appear in this pane. Let's see how we can use this.
Type meta name into the search field, press Enter, and you'll immediately see every occurrence of "meta name" in the code on this page. Now, you can see this page's metadata, the SEO keywords it's targeting, and whether or not it's configured to let Google index it for search. That's an easy way to check what your competitors are targeting—and to make sure you didn't mess anything up on your site.

Search is an effective tool for designers as well since you can search by color, too. Type #ff4a00 into the search field and press Enter (and make sure to leave the Match Case button unchecked to view all of the results). You should now see every time the color #ff4a00, Zapier's shade of orange, appears in this site's CSS and HTML files. Then, just click the line that reads "color: #ff4a00;" to jump to that line in the site's HTML and tweak it on your own (something we'll look at in the next section).

This is a handy way for designers to make sure a site is following their brand's style guide. With the Search tool, designers can easily check the CSS of a webpage to see if a color is applied to the wrong element, if an incorrect font family is used on a webpage, or if you're still using your old color somewhere on your site.
The Search tool is also the perfect way to communicate with developers better since you can show them exactly where you've found a mistake or exactly what needs changing. Just tell them the line number where the problem exists, and you'll get your fix that much quicker.
Or you can change the webpage yourself with Elements , the core part of Chrome's Developer Tools.
Change anything with Elements
Front-end developers use the Inspect Element tool every day to modify the appearance of a webpage and experiment with new ideas—and you can, too. Inspect Element lets you tweak the appearance and content of a webpage by adding temporary edits to the site's CSS and HTML files.
Once you close or reload the page, your changes will be gone; you'll only see the changes on your computer and aren't actually editing the real website itself. That way, you can feel free to experiment and change anything—and then copy and save the very best changes to use later.
Let's see what we can do with it.
Click the Elements tab in the Developer Tools pane—and if you want more room, tap your Esc key to close the search box you had open before. You should see the HTML for this page—now you know how the sausage gets made.

In the top-left corner of the Developer pane, you'll see an icon of a mouse on top of a square. Click it, then you can select any element on the page you want to change. So let's change some things!
Change the text on a webpage
Ever wanted to change text on a site? Perhaps to see how a new tagline would look on your homepage or to take your email address off a Gmail screenshot? Now you can.
Click the icon of a mouse cursor on a square in the top-left corner of the pane.

Double-click the highlighted text in the Developer Tools pane (not the text on the live page) to turn it into an editable text field.

Type anything you want in this text field ("Auri is a genius" should work just fine), and press Enter .
Voila! You've just (temporarily) changed the text on the webpage.

Refresh the page, and everything will go back to normal.
Fun? Let's try another way to change some things on this page by closing out of the Developer pane altogether. You can then highlight any part of the live webpage you want to edit, then right-click it and hit Inspect .

When your Developer Tools pane opens, it should automatically highlight that sentence. Pretty neat, huh? It's the little things that count.
Now that we've selected a sentence to change on our blog, let's change how it looks.
Change the color and font of elements
On the lower half of the Developer Tools pane, you'll see a sub-pane with a few additional tabs that allow you to change how this text looks on the page. Let's get started on the Styles tab.

You may notice that some things are crossed out. This means that these styles are not active for the element we've selected, so changing these values will have no effect.
Let's try changing something.
Look through the code for the "font-size" field and click into it. Let's change it from 34px to 42px.

Now scroll down to "color" and change it to Zapier's signature #ff4a00.

This will look a bit cramped, so let's finish by changing the "line-height" to 44px.

Now check the blog post to see the difference.

Now let's try something really cool.
Change element states
Want to see how a button or link will look once someone interacts with it? Inspect Element can show that, too, with force element state tools. You can see how the element will look once a visitor hovers over the element (hover state), selects the element (focus state), and/or has clicked that link (visited state).
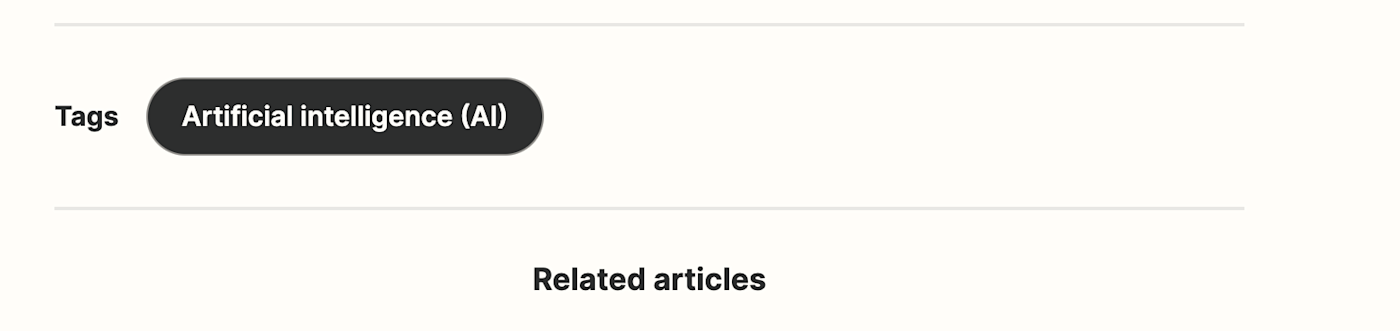
As with the other examples, you'll need to click the mouse cursor/box icon. For this example, we'll select the "Artificial Intelligence (AI)" tag on the "What is AI" article to try a color change.
In the Developer Tools pane, right-click on that code in the Elements tab, hover over Force state , and click the :active: option. Do this one more time, but click the :hover: option this time.
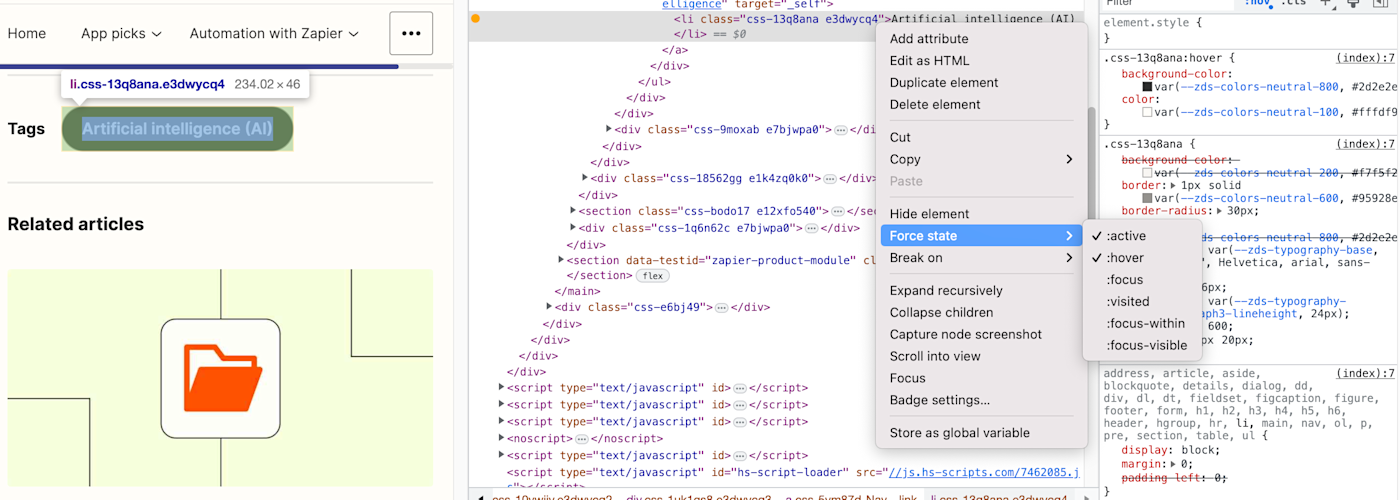
That will change the button's background to black, which is what happens when you hover over the button on the live site.
Now, change the "background-color" value to #ff4a00.
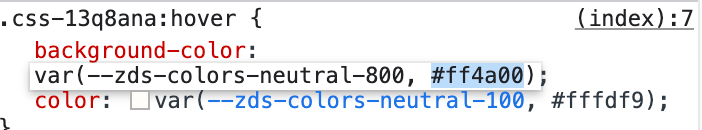
You should instantly be able to see what the new hover color will look like.

Try experimenting—change the :hover: color, then uncheck :hover: in the right-click menu and drag your mouse over the button to see the new button color.
Change images
You can easily change images on a webpage with Inspect Element, too. Using the same "What is AI?" blog post as an example, let's replace the orange solid color background on the "Power your automation with AI" button with a dramatic photo of a solar flare from NASA.
First, copy this link to the image: https://c1.staticflickr.com/9/8314/7931831962_7652860bae_b.jpg
Open Inspect Element on the orange background of the "Power your automation with AI" button and look for the "background-color" code in the pane.

Click "background-color" and replace color with image —this should cause an error. Just replace the color code with url and then paste the URL you copied into the parentheses.

This should automatically replace that boring single-color background with a flashy new image.

Note: You can also change a photo to a GIF or a video—all you need is a link to the file, and you can add it in.
Editing text is handy, swapping out images is fun, and changing colors and styles just might help you quickly mock up the changes you want made to your site. But how will that new tagline and button design look on mobile?
That's where Emulation comes in—it's where everything we've reviewed so far can be applied even further. Let's see how.
Test a site on any device with Emulation
Everything has to be responsive today. Websites are no longer only viewed on computers—they're more likely than ever to be viewed on a phone, tablet, TV, or just about any other type of screen. You should always keep that in mind when creating new content and designs.
Emulation is a great tool to approximate how websites will look to users across various devices, browsers, and even locations. Though this does not replace actual testing on a variety of devices and browsers, it's a great start.
In the Developer Tools pane, you'll notice a little phone icon in the top-left corner. Click it. This should change the page into a tiny, phone-styled page with a menu at the top to change the size.

Resize the small browser to see how things would look if you were browsing on a tablet, phone, or even smaller screen. Or, click the menu at the top to select default device sizes like Surface Duo or iPhone 12 Pro—let's go ahead and select the latter.
The webpage screen should shrink down to the device's size, and you can zoom in a bit by clicking the percentage dropdown next to the dimensions.
If you change the device preset to "Responsive," you can enlarge the view by dragging the right edge of the webpage emulation right. See what happens? Dragging the screen along the grid allows you to see how the webpage will change as the screen size changes. You can even toggle portrait and landscape views by clicking the little rotation icon at the end of the top menu.
Play around with the other devices to see how the webpage and screen resolution changes. All of the other developer tools we've gone over so far will also react to the device view.
Emulate mobile device sensors
When you start interacting with a device preview, you may notice that your mouse now appears as a little circle on the webpage. This allows you to interact with the page as if you're on your mobile device.
If you click while dragging the page down, it doesn't highlight text like it normally would in your browser—it drags the screen down like you're on a touchscreen device. Using this view, you can see how large touch zones are on a webpage. This means you can see which buttons, icons, links, or other elements are easily touchable with the finger.
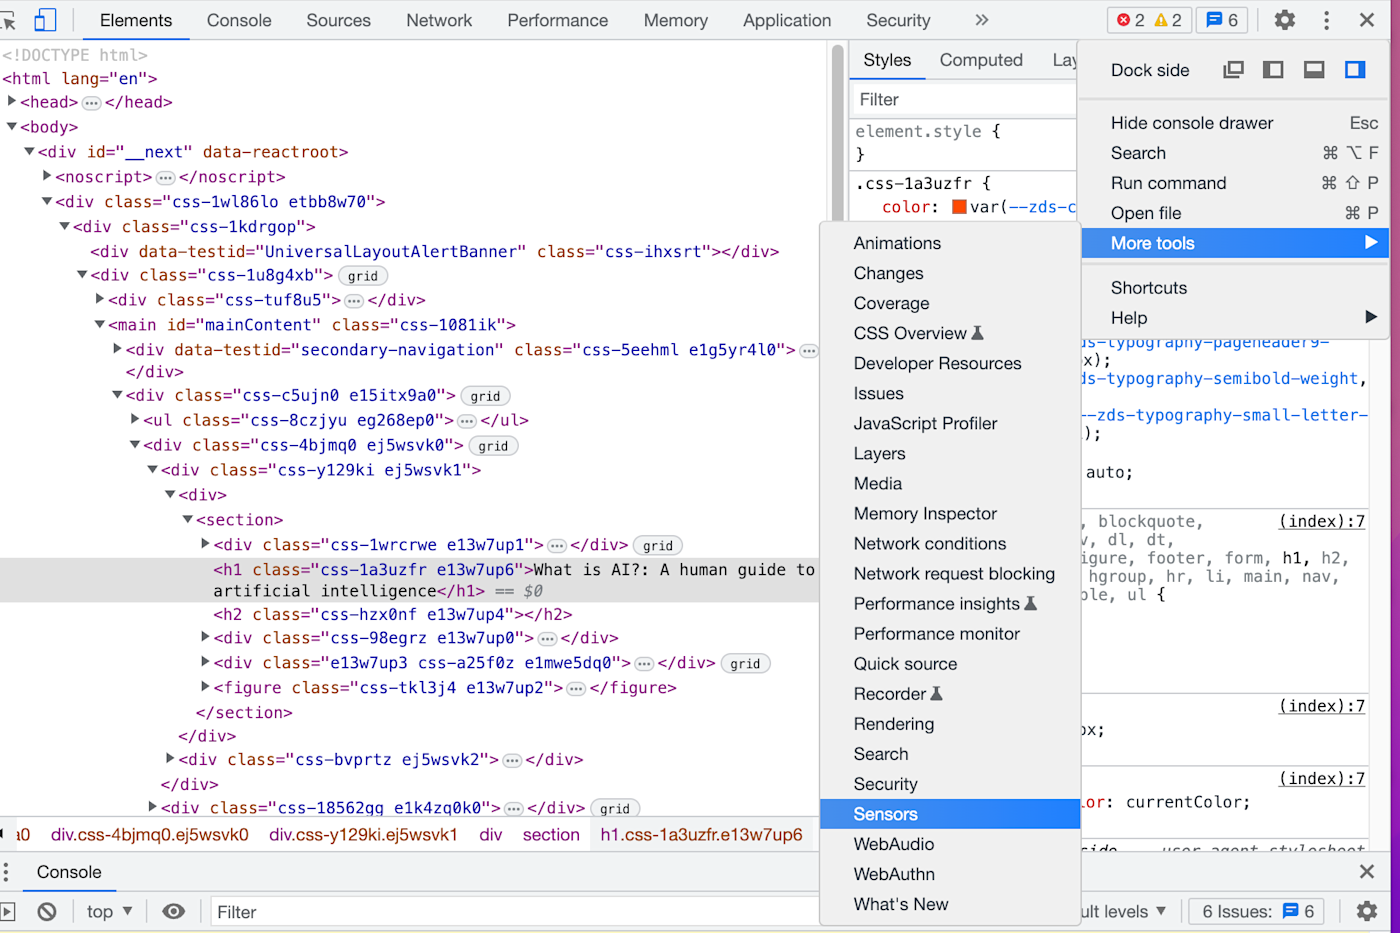
You can even make your browser act like a phone. Press your Esc key to open the Search pane in Inspect Element again, and this time click the hamburger menu on the top-right. Select More tools and then Sensors to get four new tools: Location, Orientation, Touch, and Emulate Idle Detector state.
Touch lets you choose whether the circle selector that acts more like a finger than a normal mouse cursor is forced or device-specific.
Orientation lets you interact with motion-sensitive websites, such as online games that let you move things by moving your phone.
Location lets you pretend you're in a different location.
Emulate Idle Detector state allows you to toggle between different idle user conditions.
Let's try viewing this site from Berlin. Just click the dropdown and select the city—nothing changes, right?
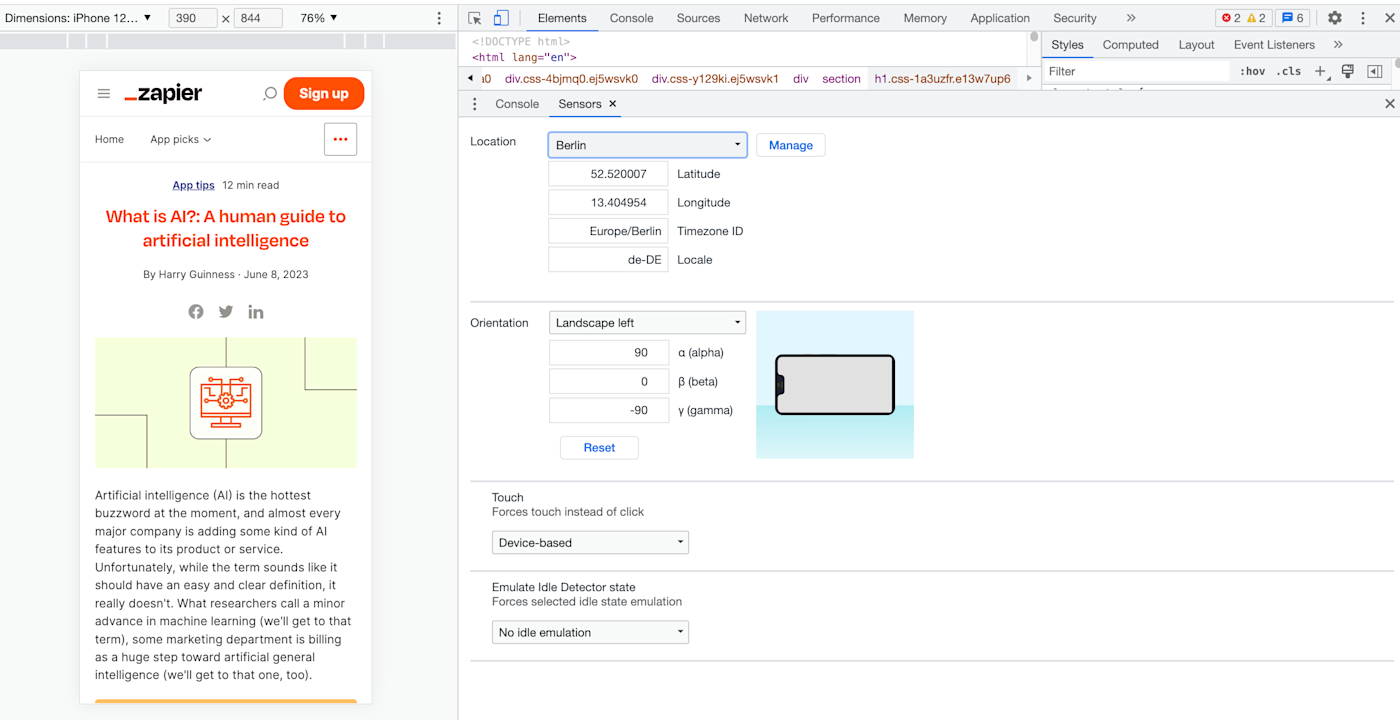
This is because there isn't content on this page that changes based on your location. If you change the coordinates on a site like Groupon.com that uses your location to show localized content, though, you would get different results. Go to Google.com in a different location, and you'll perhaps see a new Google logo for a holiday in another country, or at least will get the results in a different language.
Emulation is a great way to put yourself in your user's shoes and consider what the user may be seeing on your webpage—and it's a fun way to explore the international web.
Emulate mobile networks
You can also see what it's like to browse a site on different networks—perhaps to see if your site will load even if your users are on a slower 3G network.
To give it a try, click the hamburger menu in the top-right corner of the pane, hover over More tools , and select Network conditions .

There, you can choose from fast or slow 3G, or offline to see how the page works without internet. Or, click Add... to include your own testing (perhaps add 56Kbps to test dial-up internet). Now, reload the page, and you'll see just how long it'd take for the site to load on a slow connection—and how the site looks while it's loading. That'll show why you should improve your site to load faster on slow connections.

You can also change your user agent—uncheck Use browser default in the User agent field and select Firefox — Mac perhaps to see if the site changes its rendering for other browsers on different devices. That's also a handy hack to make webpages load even if they claim they only work in a different browser.
Inspect Element keyboard shortcuts
Now that you've learned the ropes, here are some Inspect Element keyboard shortcuts that'll make using it even easier.
Related reading:
This article was originally published in January 2015 by Auri Pope. The most recent update, with contributions from Dylan Reber, was in May 2024.
Get productivity tips delivered straight to your inbox
We’ll email you 1-3 times per week—and never share your information.

Bryce Emley
Currently based in Albuquerque, NM, Bryce Emley holds an MFA in Creative Writing from NC State and nearly a decade of writing and editing experience. His work has been published in magazines including The Atlantic, Boston Review, Salon, and Modern Farmer and has received a regional Emmy and awards from venues including Narrative, Wesleyan University, the Edward F. Albee Foundation, and the Pablo Neruda Prize. When he isn’t writing content, poetry, or creative nonfiction, he enjoys traveling, baking, playing music, reliving his barista days in his own kitchen, camping, and being bad at carpentry.
- Software & web development
- Internet browsers
Related articles

How to capitalize all letters in Word, Excel, and other apps
How to capitalize all letters in Word,...

How to type an em dash symbol on a Mac or Windows
How to type an em dash symbol on a Mac or...

What are AI agents? A comprehensive guide

How to use Browse AI to scrape data from any website
How to use Browse AI to scrape data from any...
Improve your productivity automatically. Use Zapier to get your apps working together.

How to Inspect in Safari: A Comprehensive Guide for Web Developers and Designers
The browsers Chrome, Safari, and Firefox come equipped with powerful built-in tools named “Inspect Element.” These tools allow any user to easily view and edit the underlying code of websites.
Learning this tool opens up many possibilities. Designers can preview tweaks to styles and layouts.

Beginners can understand how the web works under the hood. And anyone can quickly modify text or images to create perfect screenshots.
Mastering Inspect Element takes your ability to build, assess, and communicate about websites to the next level.
How to Enable Inspect Element in Apple Safari
Safari keeps its Inspector capability turned off by default on Macs. To activate it:
1. Open Safari's Preferences > Advanced settings.
2. Check “Show Develop menu in menu bar.”
Now you can right-click elements and choose “Inspect Element” or use Command + Option + I anywhere on the page to open the tool.
Use the Web Inspector Toolbar
With Inspect Element enabled, an extra toolbar appears at the top of the panel. This contains handy utilities for analyzing and modifying webpages. Here is an overview – try each icon's features by clicking on page elements after activation:
– Element Selector: Switch to selection mode. Click any content to reveal its code.
– Magnifying Glass: Zoom into parts of the rendered webpage.
– Crosshairs: Toggle pixel coordinate overlays.
– Device Mode Toggle: View responsiveness across screens.
– CSS Selector: Automatically locate code by element class/ID.
– Console: Input JavaScript and see console messages.
– Visualize Layout: See CSS box model measurements.
Browsers share these core icon functions, though Safari and Firefox have some differences like additional 3D rendering views.
Dig Into Website Code With Inspect Element
Now that you know how to bring up the tool, here is how web developers themselves utilize it:
See What Constructs a Page:
Explore the Elements panel to understand what HTML tags, classes, IDs, and other code makes up each section. See what images, videos, icons, and fonts are used where. Diagnose what CSS code styles certain parts.

Inspect competing or exemplary pages to see what code snippets you could reuse. Study how they format elements that look nicely designed.
Quickly Test Changes:
Edit code values directly to immediately view appearance tweaks like colors, spacing, sizes, etc.
Check Mobile Friendliness:
Click the mobile icon to simulate how the page layout changes across device sizes to optimize responsiveness.
Identify Issues:
If a site is broken, Inspect Element can reveal errors stopping functionality or visual bugs.
Audit page speed, security, accessibility and more under the Audits tab. Debug complex JavaScript code. Throttle networks. Mock locations. The possibilities are endless for how much you can analyze your own or other websites.
Get Comfortable With Your Browser's Inspect Element
Learning the basics of Inspect Element is simple with some hands-on practice. It opens up many opportunities from understanding web design better to streamlining your workflow.
Web developers rely on these built-in browser tools daily.
Go ahead, try right-clicking and tinkering with the code of your favorite sites. Just refresh the page when you're done to revert changes.
Gradually explore all the tabs and features your browser offers. Before long, you will start seeing the web in a whole new way and improving your skills as a result.
Tabletmonkeys is a tablet computer media company focusing solely on tablet computers. iPad & tablet news, tablet leaks, November tablet deals, tablet sales, tablet prices, tablet launches, tablet apps, tablet comparison, 2-in-1 tablets, and tablet accessories, is otherwise the focus of Tabletmonkeys.com.

- PRO Courses Guides New Tech Help Pro Expert Videos About wikiHow Pro Upgrade Sign In
- EDIT Edit this Article
- EXPLORE Tech Help Pro About Us Random Article Quizzes Request a New Article Community Dashboard This Or That Game Popular Categories Arts and Entertainment Artwork Books Movies Computers and Electronics Computers Phone Skills Technology Hacks Health Men's Health Mental Health Women's Health Relationships Dating Love Relationship Issues Hobbies and Crafts Crafts Drawing Games Education & Communication Communication Skills Personal Development Studying Personal Care and Style Fashion Hair Care Personal Hygiene Youth Personal Care School Stuff Dating All Categories Arts and Entertainment Finance and Business Home and Garden Relationship Quizzes Cars & Other Vehicles Food and Entertaining Personal Care and Style Sports and Fitness Computers and Electronics Health Pets and Animals Travel Education & Communication Hobbies and Crafts Philosophy and Religion Work World Family Life Holidays and Traditions Relationships Youth
- Browse Articles
- Learn Something New
- Quizzes Hot
- This Or That Game
- Train Your Brain
- Explore More
- Support wikiHow
- About wikiHow
- Log in / Sign up
- Computers and Electronics
- File Manipulation
4 Easy Ways to Inspect Element on an iPhone
Last Updated: August 8, 2023 Fact Checked
- Safari Developer Tools
- Web Inspector
- JavaScript Bookmark
- Edit Webpage Shortcut
This article was written by Luigi Oppido and by wikiHow staff writer, Nicole Levine, MFA . Luigi Oppido is the Owner and Operator of Pleasure Point Computers in Santa Cruz, California. Luigi has over 25 years of experience in general computer repair, data recovery, virus removal, and upgrades. He is also the host of the Computer Man Show! broadcasted on KSQD covering central California for over two years. This article has been fact-checked, ensuring the accuracy of any cited facts and confirming the authority of its sources. This article has been viewed 41,331 times.
Need to debug a website on your iPhone but can't find "Inspect Element?" While this common browser feature isn't built into Safari on your iPhone, there are still ways you can inspect website elements without paying for an app. The official way is to use Safari Developer Tools, which requires you to connect your iPhone to a Mac. If you're not near a computer, you can install a free app called Web Inspector, or create a JavaScript bookmark (which also works on Chrome). Or, if you're not debugging a web app and just want to change the way a website looks, you can use an iPhone shortcut called Edit Webpage.
Things You Should Know
- Use Safari Developer Tools to inspect elements by connecting your iPhone to your Mac.
- To inspect an element without a computer, install the Web Inspector app, or use a JavaScript bookmark.
- To edit text or remove images from a website, try the Edit Webpage shortcut in the Shortcuts app.
Using Safari Developer Tools

- You will need to use a USB cable to connect , as connecting with Wi-Fi won't allow you to inspect an element.

- Open your iPhone's Settings .
- Scroll down and tap Safari .
- Scroll down and tap Advanced .
- Tap the "Web Inspector" switch to turn it on (green).

- Click the Safari menu.
- Click Settings .
- Click Advanced .
- Select "Show Develop menu in menu bar." [1] X Research source

- As you select items in the Elements tab on your Mac, you'll see the selected element highlighted on your iPhone. [2] X Research source
- If you want to continue using Inspect Element without leaving your iPhone plugged in to your Mac, click the Develop menu again and select Connect via Network .
Using the Web Inspector Extension

- Web Inspector is useful for inspecting elements in Safari as it doesn't require you to connect your iPhone to a Mac. If you want to debug in Chrome, you'll need to use a JavaScript bookmark instead.
- While this extension does have the same name as Safari's "Web Inspector," it's not an official Apple tool.

- Open Safari and go to any website.
- Tap Aa in the address bar.
- Tap Manage Extensions . [3] X Research source
- Tap the switch next to "Web Inspector" to enable it.

- To allow Web Inspector to inspect elements on this website for one day only, select Allow for One Day .
- If you choose the latter option, you won't have to give Web Inspector permission to access websites again in the future.

- When you're finished, double-tap Aa to close Web Inspector.
Using a JavaScript Bookmark

- 1 Go to the website you want to inspect. This trick involves creating a bookmark that contains a string of JavaScript code to bring Inspect Element to any iPhone web browser. This trick will work in both Safari and Chrome, though the process of creating the bookmark will be a little different.

- Chrome: Tap the three-dot menu and select Add to Bookmarks .
- Safari: Tap the Sharing icon at the bottom, then tap Add to Favorites .

- Chrome: Tap the three-dot menu and select Bookmarks at the top. Tap and hold the new bookmark, then tap Edit Bookmark.
- Safari: Tap the open book icon at the bottom, then tap Favorites . Tap and hold the bookmark you just created, then tap Edit .

Using the Edit Webpage Shortcut

- You'll find the Shortcuts app in your App Library.
- This is helpful if you want to edit text or remove images and other objects from a website you're viewing.

- Scroll down and tap Shortcuts .
- Tap Advanced .
- Toggle on "Allow Running Scripts."

- Tap any element to edit it. Now you can edit text and images on the website without having an official Inspect Element feature built into Safari.
Expert Q&A
- Adobe Edge Inspect was a popular tool for inspecting elements on websites, but the tool is no longer in development or receiving updates. [4] X Research source Thanks Helpful 1 Not Helpful 0
- There are also several paid apps that will allow you to inspect web elements on your iPhone, including Achoo HTML Viewer & Inspector and Inspect Browser. Thanks Helpful 2 Not Helpful 0

You Might Also Like

- ↑ https://support.apple.com/guide/safari/use-the-developer-tools-in-the-develop-menu-sfri20948/mac
- ↑ https://support.apple.com/guide/safari-developer/inspecting-overview-dev1a8227029/mac
- ↑ https://support.apple.com/guide/iphone/get-extensions-iphab0432bf6/ios
- ↑ https://helpx.adobe.com/edge-inspect/system-requirements.html
About This Article

- Send fan mail to authors
Is this article up to date?

Featured Articles

Trending Articles

Watch Articles

- Terms of Use
- Privacy Policy
- Do Not Sell or Share My Info
- Not Selling Info
wikiHow Tech Help Pro:
Level up your tech skills and stay ahead of the curve
How To Inspect In Safari On IPad

- Software & Applications
- Browsers & Extensions

Introduction
Safari Inspector is a powerful tool that allows you to inspect, debug, and modify webpages directly from your iPad. Whether you're a web developer, designer, or simply curious about how websites are built, Safari Inspector provides a window into the inner workings of the web.
With the increasing use of iPads for web browsing and content creation, having the ability to inspect and modify webpages directly on the device is invaluable. Safari Inspector empowers users to delve into the structure and behavior of web content, making it an essential tool for anyone involved in web development or design.
In this article, we will explore the ins and outs of using Safari Inspector on iPad. From opening the Inspector to utilizing its powerful tools for inspecting and modifying elements, we will guide you through the process of harnessing the full potential of this feature. Whether you're a seasoned developer or a novice enthusiast, understanding how to leverage Safari Inspector on iPad can enhance your web experience and deepen your understanding of web technologies.
So, grab your iPad, launch Safari, and let's embark on a journey to uncover the hidden layers of the web with Safari Inspector.
Opening Safari Inspector on iPad
To begin our exploration of Safari Inspector on iPad, let's first uncover how to open this powerful tool. Safari Inspector is seamlessly integrated into the Safari browser , allowing users to access it with just a few taps. Here's how to open Safari Inspector on your iPad:
Launch Safari : Start by opening the Safari browser on your iPad. Safari Inspector is a built-in feature, so there's no need to download or install anything extra.
Navigate to the Webpage : Once Safari is open, navigate to the webpage you want to inspect. Whether it's a personal blog, a news site, or an e-commerce platform, Safari Inspector allows you to peek behind the curtain of any webpage.
Access the Inspector : With the webpage loaded, tap the address bar at the top of the Safari browser. Next, select the "Share" icon, which resembles a square with an arrow pointing upwards. This action will reveal a menu of options.
Select "Inspect" : From the menu, scroll to the right until you see the "Inspect" option. Tap on "Inspect," and voila! Safari Inspector will open, presenting you with a wealth of tools and information to delve into the webpage's structure and functionality.
By following these simple steps, you can easily open Safari Inspector on your iPad and begin your journey into the world of web development and design. The ability to inspect and modify webpages directly on your iPad empowers you to gain a deeper understanding of how websites are built and how they function. Now that we've opened Safari Inspector, let's dive into the array of tools and features it offers for inspecting and modifying elements on a webpage.
Using Safari Inspector Tools
Safari Inspector equips you with a robust set of tools designed to facilitate the inspection, debugging, and modification of web content directly from your iPad. Let's delve into the diverse array of tools at your disposal and explore how each one empowers you to gain insights into the inner workings of webpages.
Elements Tab
The Elements tab serves as your window into the structure of the webpage. It presents a hierarchical view of the HTML elements that compose the page, allowing you to inspect and manipulate individual elements. By tapping on specific elements within the Elements tab, you can view and modify their attributes, styles, and content, providing a comprehensive understanding of the webpage's structure.
Console Tab
The Console tab is a powerful tool for debugging JavaScript, logging messages, and executing JavaScript commands directly within the context of the webpage. It enables you to identify errors, test scripts, and interact with the webpage's functionality in real time. The Console tab serves as a valuable resource for diagnosing and resolving issues related to JavaScript execution and behavior.
Sources Tab
The Sources tab provides access to the underlying sources of the webpage, including HTML, CSS, and JavaScript files. It allows you to inspect, debug, and modify these sources, providing a comprehensive view of the webpage's codebase. With the ability to set breakpoints, step through code, and analyze network activity, the Sources tab empowers you to gain deep insights into the inner workings of the webpage's code.
Network Tab
The Network tab offers visibility into the network activity associated with the webpage, including requests, responses, and loading times for various resources. It enables you to analyze network performance, identify potential bottlenecks, and optimize the loading speed of the webpage. By examining network requests and responses, you can gain a comprehensive understanding of the webpage's resource utilization and enhance its overall performance.
Application Tab
The Application tab provides access to various aspects of the webpage's application functionality, including local storage, session storage, cookies, and cache data. It allows you to inspect and modify these application resources, providing insights into how the webpage manages and stores data locally. The Application tab is instrumental in understanding and manipulating the application-specific aspects of the webpage.
By leveraging these powerful tools within Safari Inspector, you can gain a comprehensive understanding of the structure, behavior, and performance of webpages directly from your iPad. Whether you're debugging JavaScript, optimizing network performance, or inspecting the underlying codebase, Safari Inspector equips you with the tools needed to unravel the intricacies of web development and design.
Inspecting Elements on a Webpage
Inspecting elements on a webpage is a fundamental aspect of web development and design, and Safari Inspector on iPad provides a seamless and intuitive interface for this essential task. By delving into the Elements tab within Safari Inspector, you gain the ability to explore the underlying structure of a webpage, inspect individual elements, and modify their attributes and styles. This process not only facilitates debugging and troubleshooting but also offers valuable insights into the composition and layout of web content.
Upon accessing the Elements tab, you are presented with a hierarchical view of the HTML elements that constitute the webpage. Each element, such as headings, paragraphs, images, and buttons, is displayed within a structured tree, reflecting its position and relationships within the document object model (DOM). By tapping on specific elements within this tree, you can inspect a wealth of information, including the element's attributes, styles, dimensions, and content.
Inspecting individual elements unveils a treasure trove of details that empower you to understand how the webpage is constructed. You can view and modify attributes such as IDs, classes, data attributes, and event listeners, providing the flexibility to manipulate the behavior and appearance of elements. Additionally, the Styles pane within the Elements tab allows you to explore the CSS styles applied to each element, including properties such as color, font size, margins, and positioning. This insight into the styling of elements enables you to diagnose layout issues, experiment with design modifications, and ensure visual consistency across the webpage.
Furthermore, Safari Inspector facilitates the inspection of the box model, which illustrates the dimensions and spacing of elements within the layout. By examining the content, padding, borders, and margins of elements, you can gain a comprehensive understanding of their spatial relationships and fine-tune the visual presentation of the webpage.
In essence, inspecting elements on a webpage using Safari Inspector empowers you to unravel the intricacies of web content, from its structural composition to its visual styling. Whether you're troubleshooting layout inconsistencies, experimenting with design variations, or gaining insights into the underlying HTML and CSS, Safari Inspector provides a user-friendly and powerful platform for inspecting and modifying elements directly from your iPad. This capability not only enhances your proficiency in web development and design but also fosters a deeper appreciation for the craftsmanship behind every webpage you encounter.
Modifying and Debugging CSS and JavaScript
Modifying and debugging CSS and JavaScript directly from your iPad is a game-changer, and Safari Inspector empowers you to seamlessly delve into the styles and scripts that shape the visual and interactive aspects of webpages. By leveraging the powerful tools within Safari Inspector, you can not only inspect but also modify and debug CSS and JavaScript, providing a comprehensive platform for refining the visual presentation and functionality of web content.
Modifying CSS
The Styles pane within the Elements tab of Safari Inspector allows you to directly modify CSS styles applied to individual elements. By tapping on specific style properties, such as color, font size, margins, or positioning, you can experiment with real-time modifications and witness their immediate impact on the webpage's appearance. This dynamic approach to modifying CSS empowers you to fine-tune the visual presentation, troubleshoot layout issues, and iterate on design variations directly from your iPad.
Debugging JavaScript
The Console tab within Safari Inspector serves as a robust environment for debugging JavaScript directly within the context of the webpage. By logging messages, executing JavaScript commands, and identifying errors, you can gain insights into the behavior and execution of JavaScript scripts. Additionally, the ability to set breakpoints, step through code, and inspect variables provides a comprehensive toolkit for diagnosing and resolving JavaScript-related issues. Whether you're troubleshooting interactive features, testing script functionality, or analyzing runtime behavior, Safari Inspector equips you with the tools needed to debug JavaScript with precision and efficiency.
Real-time Experimentation
One of the most compelling aspects of modifying and debugging CSS and JavaScript within Safari Inspector is the real-time nature of the process. As you make adjustments to CSS styles or diagnose JavaScript behavior, the changes are immediately reflected on the webpage, allowing you to experiment, iterate, and refine with unparalleled immediacy. This real-time experimentation fosters a dynamic and iterative approach to web development and design, enabling you to fine-tune the visual and interactive aspects of web content with agility and precision.
In essence, Safari Inspector on iPad provides a comprehensive platform for modifying and debugging CSS and JavaScript, empowering you to refine the visual presentation and interactive behavior of webpages directly from your device. Whether you're fine-tuning styles, diagnosing script errors, or experimenting with design enhancements, Safari Inspector offers a seamless and powerful environment for shaping the digital experiences that define the web.
In conclusion, Safari Inspector on iPad serves as a gateway to the inner workings of the web, offering a wealth of tools and features that empower users to inspect, debug, and modify web content with precision and agility. By seamlessly integrating into the Safari browser, Safari Inspector provides a user-friendly and intuitive platform for delving into the structure, behavior, and performance of webpages directly from the iPad.
The ability to open Safari Inspector with just a few taps, navigate through the Elements, Console, Sources, Network, and Application tabs, and leverage the diverse array of tools within each tab underscores the accessibility and power of this feature. Whether you're a seasoned web developer, a budding designer, or simply curious about the mechanics of the web, Safari Inspector offers a window into the craftsmanship and complexity that underpin every webpage.
Inspecting elements on a webpage using Safari Inspector unveils the hierarchical structure of HTML elements, the intricacies of CSS styling, and the spatial relationships defined by the box model. This process not only facilitates troubleshooting and debugging but also fosters a deeper understanding of how web content is constructed and presented.
Furthermore, the ability to modify and debug CSS and JavaScript directly from the iPad elevates the Safari Inspector experience to a dynamic and iterative endeavor. Real-time experimentation with CSS styles and JavaScript behavior empowers users to refine the visual presentation and interactive features of web content with unparalleled immediacy and precision.
In essence, Safari Inspector on iPad transcends the traditional boundaries of web development and design, bringing the power of inspection, debugging, and modification to the fingertips of users. Whether you're refining the layout of a personal blog, diagnosing JavaScript errors on an e-commerce platform, or optimizing the performance of a news site, Safari Inspector equips you with the tools and insights needed to unravel the intricacies of web content.
As the landscape of web technologies continues to evolve, Safari Inspector remains a steadfast companion for those seeking to gain a deeper understanding of the web. By embracing the capabilities of Safari Inspector on iPad, users can embark on a journey of exploration, experimentation, and refinement, shaping the digital experiences that define the modern web.
In the ever-evolving ecosystem of web development and design, Safari Inspector stands as a testament to the power of accessibility, innovation, and empowerment, offering a glimpse into the boundless possibilities that await those who dare to inspect, modify, and create on the canvas of the web.
Leave a Reply Cancel reply
Your email address will not be published. Required fields are marked *
Save my name, email, and website in this browser for the next time I comment.
- Crowdfunding
- Cryptocurrency
- Digital Banking
- Digital Payments
- Investments
- Console Gaming
- Mobile Gaming
- VR/AR Gaming
- Gadget Usage
- Gaming Tips
- Online Safety
- Software Tutorials
- Tech Setup & Troubleshooting
- Buyer’s Guides
- Comparative Analysis
- Gadget Reviews
- Service Reviews
- Software Reviews
- Mobile Devices
- PCs & Laptops
- Smart Home Gadgets
- Content Creation Tools
- Digital Photography
- Video & Music Streaming
- Online Security
- Online Services
- Web Hosting
- WiFi & Ethernet
- Browsers & Extensions
- Communication Platforms
- Operating Systems
- Productivity Tools
- AI & Machine Learning
- Cybersecurity
- Emerging Tech
- IoT & Smart Devices
- Virtual & Augmented Reality
- Latest News
- AI Developments
- Fintech Updates
- Gaming News
- New Product Launches
- A Indstria 40 Realizing Isaac Asimov8217s Dream in the Age of Robots
Learn To Convert Scanned Documents Into Editable Text With OCR
Related post, how to make stairs planet coaster, how to rotate camera in planet coaster, how to make a good roller coaster in planet coaster, where is the minecraft folder, how to update minecraft windows, how to update minecraft education edition, related posts.

How To Open Developer Tools In Safari

How To Hard Reload Safari

How To View Page Source On Tablet

Why Does My IPad Keep Shutting Down Safari

How To Exit Safari On IPad

How To Get Rid Of Split Screen In Safari On IPad

Where Is My Safari App

How To Unlink Safari From IPhone To IPad
Recent stories.

A Indústria 4.0: Realizing Isaac Asimov’s Dream in the Age of Robots

Top Mini Split Air Conditioner For Summer

Comfortable and Luxurious Family Life | Zero Gravity Massage Chair

Fintechs and Traditional Banks: Navigating the Future of Financial Services

AI Writing: How It’s Changing the Way We Create Content

How to Find the Best Midjourney Alternative in 2024: A Guide to AI Anime Generators

How to Know When it’s the Right Time to Buy Bitcoin
- Privacy Overview
- Strictly Necessary Cookies
This website uses cookies so that we can provide you with the best user experience possible. Cookie information is stored in your browser and performs functions such as recognising you when you return to our website and helping our team to understand which sections of the website you find most interesting and useful.
Strictly Necessary Cookie should be enabled at all times so that we can save your preferences for cookie settings.
If you disable this cookie, we will not be able to save your preferences. This means that every time you visit this website you will need to enable or disable cookies again.
Controls the level of style and functionality of the site, a lower fidelity meaning less bandwidth, battery, and CPU usage. Learn more .
Custom Style Sheets in Safari
I first heard mention of adding a custom style sheet in Safari a couple months back. I honestly can’t remember where I saw it but I was reading something and, in passing, the author mentioned the idea of hiding the right sidebar on Twitter using a custom style sheet in Safari. This thing:

It’s funny how you sometimes miss the entire point of someone’s writing and selectively remember what you want, in this case “hey, I can hide that dumb module on Twitter with little effort?” I’d like to say that I have the self-discipline to avoid clicking on anything in that module, but unfortunately I am not that strong of a person. Sometimes I just get bored and something there makes me think “oh, hmm, I wonder...” and then I click it. It’s one of those things where, if it wasn’t there, it wouldn’t be a problem. Like keeping cookies right next to your desk. But it’s frictionless and easy and RIGHT THERE that I succumb. But I digress. My weaknesses are not on trial in this post.
The thought hit me: “hey I should hide that right sidebar on twitter.com using a custom style sheet in Safari!” So I did. And then I moved on with life. I never thought to write a post about it because, you know, custom style sheets in a browser? That’s old news.
But then, I recently found this post published in November of 2020 about customizing your browsing experience using custom style sheets and thought “I guess this isn’t old news just quite yet.” Plus I’m trying to write a lot more this year , so here we are.
Note: it’s worth mentioning that hiding the right sidebar in twitter isn’t a novel idea. Craig Hockenberry created a Safari extension that’ll do it for you called “Fixerrific”. Granted, like my custom style sheet, this removes the entire right sidebar, including the search box which you might actually find useful. That said, you can still access the search functionality on twitter by going to the Explore tab.
How I Did It
First off, Safari lets you specify a custom style sheet.

In case you don’t know, a custom style sheet is a bunch of CSS rules that you get to specify and then the browser will apply them to every single web page you visit .
The first thing I needed to do was open twitter.com and find out what type of CSS rule I could write to target that right sidebar. I can tell you, it wasn’t easy. Twitter has a bunch of generated classes names, which I’m assuming are quite dynamic, so finding a rule that would target the right sidebar and not change in the near future seemed like it might be tough. But then I found it: a DOM node which encompassed the entire right sidebar that had a very specific attribute data-testid="sidebarColumn" .

I can’t say for sure, but that looks like one of those attributes the QA team appends to certain elements they want to find with their automated browser tests. The whole purpose of those kinds of attributes is so the engineers won’t touch them and change their names, that way the automated tests can run for a long time without breaking. Again, I can’t make any guarantees, but this selector will probably be around for a while. So I felt pretty confident I could use that selector and not have it break in a short period of time due to twitter refactoring their DOM markup.
Once I had a selector I could use, I opened my text editor and created the following CSS file:
From there, I saved the .css file in my Dropbox folder (for backup purposes, i.e. a lazy man’s version control) then opened Safari’s preferences and selected my newly created file. A restart of Safari and boom! The sidebar was gone.
Feeling emboldened and empowered with my CSS sword of righteousness, I figured I’d go ahead and get rid of the DM/chat widget thing twitter recently introduced. It was merely visual noise to me. And fortunately, it had a similar way to be targeted: [data-testid="DMDrawer"] .

Pretty cool. Now I have a version of twitter custom tailored to me, free of a lot of distractions I don’t want to see.

Observations Nobody Asked For
If you write a lot of custom styles for sites across the web, you could start running into naming collisions. It would be neat if you could scope styles to a specific domain. Maybe there’s a way to do it? I couldn’t think of one. Imagine:
JavaScript has access to a page’s URL via window.location but AFAIK that’s not available—at least not in any standardized way—in CSS.
It's likely a terrible idea, but we have custom user style sheets, is there such a thing as a custom user scripts? Imagine giving a .js file to the browser and it runs it on every single page, like a custom style sheet. Why? Because I want to specify all my custom styles using JavaScript not CSS.
Just kidding.
But seriously, if there was something like this, I could have a script that runs on every page and sticks an attribute on the root html element with the page’s URL. Imagine:
This would result in every page getting an attribute on the root element with the current page’s href on it.
This would allow me to scope every single one of my custom style sheet selectors to a specific domain:
Honestly, that sounds cool but impractical (not to mention the incredible security implications). It’s fun to think about though.
But hey, if I felt like disabling JavaScript, I could use this theoretical custom script functionality to run the following JavaScript on ever page I visit, just to show who really is in power:
I love old-school browser functionality like this. Can you imagine a feature like custom style sheets being proposed and implemented in today’s world? I feel like this is in Safari as a holdover from a bygone era. Could it ever get the momentum to happen today? I worry Apple might take it out sometime in the future.
All that said, if you want to read more, this post has a perspective on the history of custom style sheets in Safari that you might find interesting.
Update: 2020-01-14
I received an email from John P. Rouillard who read my question about having custom user scripts and said “You mean like greasemonkey or tapermonkey?”
I realized when I wrote that paragraph that I was merely describing what browser extensions are for. What I was trying to get at is that it would be really cool if custom user scripts were a feature of the browser, i.e. adding a custom user script was as simple as adding a custom style sheet: select a .js file on disk and boom, you’re done.
That said, maybe I’ll give one of these user scripts extensions a try. I’ve heard of greasemonkey and used it back in like 2012. But I’ve never heard of tampermonkey. Looks like it’s open source and even available for Safari . Thanks John!
Safari Web Inspector Guide
- Table of Contents
- Jump To…
- Download Sample Code
Retired Document
Important: This document no longer represents the most current version of Safari developer tools. Links to downloads and other resources may no longer be valid. For new documentation on Safari Web Inspector, please visit Safari Developer Help .
Resources and the DOM
The Document Object Model ( DOM ) is the API between your JavaScript and HTML. Each HTML element is rendered as a node in the DOM tree.
Inspecting the DOM
At the heart of Web Inspector is the ability to inspect, or locate within the DOM tree, a specific element on the page. After the specific element is selected in the DOM tree, details about the element become available, such as the element’s styles and event listeners.
Click the Inspect button, and start moving your mouse along the page. Notice that the elements you hover over becomes highlighted in a set of colors, and a tooltip appears, indicating the element’s tag and total dimensions. The colors that appear upon hover represent the element’s margin, border, padding, and dimensions, as illustrated in Figure 2-1 .

With the Inspect button selected, click on this sentence. You can also right-click on this sentence and select Inspect Element in the contextual menu. Notice that the corresponding node becomes selected in the content browser.
Source versus DOM
The notions between a page’s source and a page’s DOM are similar, but different. The source is the raw HTML that is unadulterated by any client-side scripts. It is the direct response of the HTTP request to the server. The DOM, on the other hand, is the same HTML structure that has been modified by JavaScript.
Source Code reads the page’s HTML as if you opened it in a text editor. The source code reflects your HTML structure before any JavaScript is loaded. While the contents can’t be edited, it’s useful to see the HTML Safari receives from the server.

The DOM tree is fully editable. Of course, your edits are temporary, so any changes you make are lost in a browser refresh. To save changes you make to the DOM tree, select the root html node and press Command-C, which copies the DOM structure to you clipboard as HTML.

You can switch between the page’s DOM tree and source code in the Navigation bar.
The Shadow DOM
Editing Nodes
To edit the markup of an element, double-click an element name, attribute name, or attribute value. Alternately, you can press the Enter key to input a new attribute. You can also use the Tab key and Shift-Tab key combination to cycle through attributes.
For example, inspect this paragraph and press the Enter key. You’ll see a text field appear within the highlighted node. Type in class="notebox" and press Enter. A blue border appears surrounding the paragraph. That’s because the notebox class is already defined in the stylesheets included in this page. Deleting the class attribute or its value restores it to its original appearance.
Rearrange nodes with a simple drag and drop. Delete nodes by pressing the delete key. Try editing a couple nodes on this page—inspect this paragraph, then drag it above or below other nodes in the DOM tree. You’ll see the order of paragraphs change in the page to reflect the changed order in the DOM tree. All of your changes are local and won’t persist across pageloads. If you want to undo a change without losing other modifications you’ve made to the DOM, go to Edit > Undo (Command-Z) to undo your change.
The Style details sidebar shows all of the CSS styles that pertain to the selected element. It also contains a series of checkboxes representing the element’s active, focus, hover, and visited pseudo-state. You can select these checkboxes to enable the pseudo-state without interacting with the element directly. For example, selecting the Hover checkbox will change the appearance of the element as if the mouse cursor is hovering over it.
The computed styles show all CSS styles associated with the selected element. It shows properties set to this specific element, as well as properties inherited from other selectors.

The styles displayed in the Computed tab are read-only. To edit an element’s styles, go to the Rules tab.
Next to every color in the Style sidebar is a color swatch. Clicking on the square swatch cycles through different formats of expressing that color. You can cycle through Hex, RGB, RGBA, HSL, HSLA, and named color values, depending on the color in context—for example, colors without alpha channels won’t cycle through RGBA or HSLA; colors that don’t represent an exact named color won’t cycle through the named color.
To see every CSS property, click on the Show All checkbox. This shows properties and their default values.
The Rules tab lists CSS rules that pertain to the selected element. The rules are collected from inline styles, attached stylesheets, and User Agent stylesheets. User Agent stylesheets are styles that Safari itself applies, such as a default margin.
Here, you can edit your styles as you would in a text editor. As you begin typing, notice that CSS properties auto-complete. As soon as your rule is valid, the style is automatically applied to the page. You can uncheck the checkbox that appears next to rules on hover to disable them, or press the Delete key to remove them entirely.

Inspect this paragraph, then click on New Rule. Web Inspector creates a rule with a selector that matches the selected element. In this case, the element is a paragraph, so Web Inspector chose the generic p tag. Type color: red; underneath the p selector, and notice that this entire paragraph instantly turns red.
The Box Model provides an easy way to visualize the dimensions of an element at a glance. From the center out, it shows the width and height, padding, border, and margin of the selected node. All of the values are editable; double-click and type in a value to see the change update immediately. As in the Rules tab, you can hold the Option key while pressing the up- or down-arrow keys to increment or decrement the current value.

Inspect this sentence, and then click the Metrics tab. As you move your mouse over areas of the box model, you’ll see the corresponding areas on the page flash with color. Give the padding-bottom a value by double-clicking the hyphen directly underneath the dimensions. Type in a number (50, for example) and press Enter. You’ll notice the padding underneath this paragraph expand by 50 pixels. You do not need to supply a unit in the box model—all values are in pixels.
Adding values in the Metrics tab affects only the selected element. The values are applied as an inline style; look back in the content browser and notice that the selected node now has a style attribute. If you’d like the style applied to multiple elements, you’ll need to create a rule in the Rules tab that matches a certain selector.
The Layer details sidebar provides information about what is composited as a layer. Elements that have a 3D transform, a fixed position, or overlap other composited elements are rendered in their own layer so that its movement during animations or scrolling can be hardware-accelerated for maximum performance.
However, each layer increases the memory footprint of your webpage (significantly for layers covering a large area). You should avoid having elements in their own layer unless absolutely necessary. If your page has poor scrolling or resizing performance, check to see if any nodes are being repainted on every scroll or resize event.
To see which elements on your page are rendered in their own layer, select the root html node in the content browser. Any elements composited in a layer appear here, as shown in Layers . Clicking on the row in this table causes a popover to appear, explaining the reasons for compositing. When possible, minimize the number of layers present by eliminating the element’s need for compositing. Clicking the arrow that appears on hover jumps to the node’s location in the content browser.

The number of element repaints is displayed next to the node name. A repaint occurs when the rendering engine assesses that a portion of the page’s visual presentation needs updating—for example, when a hovered link becomes underlined, or when a window resizes. Repaints are expensive operations that can negatively affect the responsiveness of your webpage as well as impact the user’s battery life.
The amount of memory the element consumes is also displayed in the Layer details sidebar. The amount of memory an element consumes is determined by multiplying the product of the element’s dimensions by 4 bytes (1 byte for each red, green, blue, and alpha channel).
The Node sidebar shows information relating to the selected element’s prototypal object, as shown in Figure 2-8 .

The Attributes section lists the names and values of HTML attributes of the selected node. These values are read-only; to edit an element’s attributes, double-click the node in the content browser.
The Properties section lists all available methods and properties available to the selected element, including methods and properties inherited from its parent objects.
The Event Listeners section lists all JavaScript events attached to this node and its ancestors. It presents the type of event, such as click or mouseover, as well as the name of the function it calls. If your JavaScript events aren’t firing as expected, check here to confirm that the element is indeed listening for the intended event and function.
The Resource sidebar shows information about the selected resource. You can view the full URL of the resource, as well as the server request and response headers that were sent with this resource, as shown in Figure 2-9 .

Resources and Storage
Resources are grouped implicitly. If there are over a certain number of resources on a page, then images, scripts, stylesheets, fonts, frames, and XHRs ( XMLHttpRequest s) coalesce into groups. These groups are represented by a folder. Groups do not reflect directory structure; that is to say, the organization of resources in the sidebar does not represent the path of the resource.
JavaScript and CSS
If source maps are present, Web Inspector splits production JavaScript and CSS into its original source files. Concatenated resources—for example, ones created by a CSS preprocessor or a build script—appear as a group, and the source files are listed as children. The names of source-mapped files appear throughout Web Inspector in italics; click the file name to jump to the position in the concatenated file, and Command-click the file name to jump to the position in the original source file.
JavaScript files allow you to set breakpoints in the left margin. To learn more about setting breakpoints, read Breakpoints .
While it’s quicker to change an element’s CSS rules in the Figure 2-11 sidebar, you can also live-edit the stylesheet directly in the content browser. Select a CSS resource and begin typing, just as you would in a text editor.
Changes you make to JavaScript or CSS files can easily be saved onto disk by pressing Command-S. Saving external resources with Web Inspector allows you to rapidly prototype without the need to switch back to your text editor.
If your website uses cookies, they appear as an offline resource in the Resources navigation sidebar. As shown in Figure 2-10 , cookies are displayed in a table that lists each cookie’s name, value, domain, path, expiration date, and size.

Entries in this table are read-only; if you want to edit a cookie’s value, you need to do so with the document.cookie object in JavaScript (you can use the Quick Console at the bottom of the content browser to modify the cookie and see the results update in real time). Pressing the Delete key while a cookie is selected deletes the cookie.
Local and Session Storage
If your web app uses HTML5 Web Storage , keys and values you set in your code appear in the Local Storage offline resource, as shown in Figure 2-11 . Local storage is displayed as an editable data grid of key-value pairs. Double-click an empty row to create a new entry, and double-click an existing entry to edit its value. Pressing the Delete key on a selected entry removes the key-value pair. Local storage provides a database of up to 5 MB per domain that persists even after Safari is quit.

Session storage is also displayed as an editable data grid of key-value pairs. Unlike local storage, session storage persists for as long as the window or tab remains open.
SQL Databases
If your webpage uses Web SQL Databases , they appear as an offline resource under Databases in the Resources navigation sidebar. Click the Databases disclose triangle to see a list of open databases and their tables. Selecting a database table displays a data grid containing all the columns and rows for that table.

In addition to inspecting HTML5 databases, you can interact with them by issuing SQL queries against any of the displayed databases. Select a database in the sidebar to see an interactive console for evaluating SQL queries.

The input to this console has auto-completion and tab-completion for table names in the database, as well as common SQL keywords.
Application Cache
Websites that provide a manifest file can have items stored in Safari’s offline application cache. On subsequent visits to the website, Safari loads these items from the cache instead of loading them from the website again. This provides a mechanism for websites to offer features such as canvas-based games that users can play, even when their device’s browser has no Internet connection.

You can inspect all the current contents of the application cache by clicking Application Cache. Safari shows a list of domains that have cached files. Select a domain to see the files in that domain’s cache, showing the URL from which they were loaded, the type of entry the resource was specified as (explicit, manifest, master, or fallback), and the file size.
When the Application Cache is selected, the Storage details sidebar is also shown. It reports if the target device is online or not, and its current status.
Extension Scripts
Any scripts that have loaded from an installed Safari extension appear in a group labeled Extension Scripts. For more information about Safari Extensions, read Safari Extensions Development Guide .
Copyright © 2018 Apple Inc. All Rights Reserved. Terms of Use | Privacy Policy | Updated: 2018-02-07
IMAGES
VIDEO
COMMENTS
Safari 8.0.8 on OS X. Right-click any element and select Inspect Element from the pop-up menu. Ensure Styles and Rules are selected on the right hand side of the inspector. You can then either add individual rules by clicking + New Rule, or simply click and start typing rules where Click to Edit appears (refer to image below)
Overview. Web Inspector helps you inspect all the resources and activity on webpages, Service Workers, Mac and Home Screen web apps, and JavaScript running inside your applications, making development more efficient across Apple platforms. The clean, unified design puts each core function in a separate tab, which you can rearrange to fit your ...
In Safari, there are two ways to begin inspecting a webpage. The first is via the Develop menu. With the webpage you wish to inspect frontmost in Safari, go to the Develop menu and choose Show Web Inspector (⌥⌘I). Web Inspector will then appear, and will be inspecting the webpage. The second was to show Web Inspector is to right click on ...
Open Safari. Click Safari in the top menu bar. From the dropdown menu, select Preferences . Select the Advanced option. Check the box that says Show Develop menu in menu bar . After selecting this option, you can right-click on a webpage and select Inspect Element. Alternatively, you can select Develop in the menu bar, and then Show Web Inspector .
Web development tools. Apple has brought its expertise in development tools to the web. Safari includes Web Inspector, a powerful tool that makes it easy to modify, debug, and optimize websites for peak performance and compatibility on both platforms. And with Responsive Design Mode, you can preview your web pages in various screen sizes ...
In Safari, click Safari in the tool bar. Click Settings and head to Advanced. Check Show Develop menu in menu bar. On a webpage, right click an element. Click Inspect Element. Read on to see ...
The Styles tab, a pivotal component of the Inspector in Safari, serves as a gateway to the visual presentation and styling of a web page. Upon navigating to the Styles tab within the Inspector, you are greeted with a comprehensive overview of the CSS (Cascading Style Sheets) rules that define the appearance and layout of the current webpage.
1) Click Develop from the Safari menu bar on Mac, and you'll see your iPhone or iPad listed here. 2) Mouse over the device, and you'll then see the websites open in Safari on your mobile device. 3) Select the one you want, and the Web Inspector will pop open in a new window for you to use. Note: If this is the first time you're using your ...
Option 2: Choose Develop > Show Web Inspector from the top menu bar. Option 3: Use the shortcut command-option-I. 3. Change the location of the inspect panel. Safari's inspector opens at the bottom of the window by default. To change this configuration, click the icon to dock the display on the right side or pop out in a separate window.
To get to Inspect Element on Firefox, like Chrome, you have three options. Method 1: Right-click anywhere on the page and click Inspect at the bottom of the menu. Method 2: Click the hamburger menu (three horizontal lines at the top-right corner of the window), select More tools, then click Web Developer Tools.
To do so, open the Safari browser and click Safari -> Settings. 2. Click on Advanced. Check the Show Develop menu in menu bar checkbox. Doing this also allows you to Inspect Elements on iPhones by connecting them also. 3. The Inspect Element Safari feature is now enabled. To cross-check, one can open any URL in Safari and right-click the mouse ...
1. Open Safari's Preferences > Advanced settings. 2. Check "Show Develop menu in menu bar." Now you can right-click elements and choose "Inspect Element" or use Command + Option + I anywhere on the page to open the tool. Use the Web Inspector Toolbar. With Inspect Element enabled, an extra toolbar appears at the top of the panel.
58. Just enable Show Developer Menu in Safari's Preferences, Advanced tab. It will enable the option Inspect Element when you right click the page. You can also start it with Command + Option + I. You can get more info about this option in Safari for Developers - Tools and Safari Web Inspector Guide: The Develop Menu. Share. Improve this answer.
Web Inspector shows you the structure of your DOM as perceived by Safari's rendering engine, WebKit. But the DOM isn't all you can inspect. External resources and locally stored data—such as scripts, stylesheets, and offline storage—can be inspected, providing insight to the data available to your web content.
Use Safari on your iPhone to navigate to the site on which you want to use Inspect Element. 5. On your Mac, click the Develop menu. You will see your iPhone listed here. 6. Hover your mouse over your iPhone and select the website. This opens the Inspect Element panel on your Mac for the site that's open on your iPhone.
Access the Inspector: With the webpage loaded, tap the address bar at the top of the Safari browser. Next, select the "Share" icon, which resembles a square with an arrow pointing upwards. This action will reveal a menu of options. Select "Inspect": From the menu, scroll to the right until you see the "Inspect" option.
First off, Safari lets you specify a custom style sheet. In case you don't know, a custom style sheet is a bunch of CSS rules that you get to specify and then the browser will apply them to every single web page you visit. The first thing I needed to do was open twitter.com and find out what type of CSS rule I could write to target that right ...
To tell Safari to add your tool as a tab in Web Inspector, you must create the inspector tab in your extension using browser.devtools.panel.create(). Don't conditionally create the inspector tab after you check permissions; if you do, Safari won't add a tab for your tool. Let Safari handle permissions with its dialogs; then update your user ...
For new documentation on Safari Web Inspector, please visit Safari Developer Help. Resources and the DOM. The Document Object Model (DOM) is the API between your ... to undo your change. Style. The Style details sidebar shows all of the CSS styles that pertain to the selected element. It also contains a series of checkboxes representing the ...
The culprit in my case turned out to be a Content Blocker (iOS ad-blocker) which was blocking elements on the page by forcing a User Stylesheet to display:none on certain CSS elements. Because of this, Safari showed it as "locked" like in your screenshot with no way to edit/modify it. A warning appeared in the Web Inspector 'Logs' tab telling ...
Expanding the frame lets you see the events that happened right before/after the event you're looking into. On the last column "Location" you can see where the problem was caused. If it's filled in, you can click on the right arrow to see the line that caused it. BUT it doesn't always have something in the column.