- Terms of Service
- Alpha Release – Text-based
Faster, Better, More Ethical Products to Market

JourneyMap AI
Why AI for Product Management & UX Research?
In the ever-evolving landscape of product management and user experience research, the need for speed, accuracy, and innovation is paramount. Introducing a groundbreaking method that harnesses the power of AI to revolutionize the way we create and understand user personas, journey maps, and assumptions while checking for bias and AI risk.
Background :
Derived from the principles of Compassion Driven Innovation , this tool offers a systematic and programmatic approach to creating product management and UX research artifacts. By leveraging directed workflow, secondary source data, machine learning, and AI, we ensure a significant improvement in the creation of:
- Persona Maps
- Proto Journey Maps
- Assumption Generation
- Linear Journey Maps
Resulting in significantly better products that have direct market fit.
Please review the Terms of Service .
Keep updated – join our mailing list:
Sign up for the Newsletter
We are just getting started – sign up to join our newsletter and be the first to know about new beta releases and feedback opportunities!
User Journey Maps: How To Use AI to Create Templates
Home » User Journey Maps: How To Use AI to Create Templates
In the ever-evolving landscape of user experience design, understanding and optimizing user journeys is crucial for the success of any digital product or service. User Journey Maps serve as invaluable tools that visually represent the steps a user takes while interacting with a product. In this blog post, we will delve into the realm of User Journey Maps and explore how Artificial Intelligence (AI) can be harnessed to create accurate and insightful maps. By the end of this guide, you’ll be equipped with the knowledge to leverage AI-powered tools and templates to enhance your User Journey Mapping process.
Understanding User Journey Maps
User Journey Maps are dynamic visual tools that provide a comprehensive overview of a user’s interactions with a product or service. These maps serve as a roadmap, guiding teams through the entire user experience, from the initial interaction to the successful completion of a goal. Let’s delve deeper into the significance of User Journey Maps and the evolution of their creation process.
Significance of User Journey Maps:
1. Behavioral Understanding : User Journey Maps go beyond a simple chronological sequence of interactions. They delve into the user’s emotions, motivations, and pain points, offering a holistic view of their experience. This behavioral understanding is crucial for tailoring products and services to meet user expectations effectively.
2. Identifying Pain Points: One of the primary purposes of User Journey Maps is to pinpoint pain points in the user experience. By visualizing the entire journey, teams can identify areas where users face challenges, frustration, or confusion. This insight is invaluable for making targeted improvements and enhancing overall satisfaction.
3. Optimizing User Experience: Armed with insights from User Journey Maps, teams can strategically optimize the user experience. Whether it involves refining the onboarding process, streamlining navigation, or improving support mechanisms, User Journey Maps guide iterative improvements that align with user needs.
Traditional Methods vs. AI-Driven Approach:
1. Traditional Methods: Historically, creating User Journey Maps relied heavily on traditional methods such as user interviews, surveys, and manual data analysis. While effective, these methods often consumed considerable time and resources, limiting the frequency of updates and iterations.
2. Data-Driven Efficiency with AI: The advent of AI has revolutionized the process of creating User Journey Maps. AI-powered tools can analyze vast datasets in real-time, identifying patterns and trends that might be overlooked through manual analysis. This data-driven efficiency allows for more frequent updates, ensuring that User Journey Maps remain reflective of the ever-changing user landscape.
3. Enhanced Accuracy: AI brings a level of accuracy and depth to User Journey Maps that traditional methods may struggle to achieve. Machine learning algorithms can uncover subtle nuances in user behavior, providing a nuanced understanding that goes beyond what qualitative methods alone can offer.
4. Scalability: With AI, User Journey Mapping becomes more scalable. It can handle larger datasets and diverse user interactions, making it suitable for products or services with a broad user base. This scalability ensures that insights derived from User Journey Maps are applicable and representative of the entire user population.
In essence, User Journey Maps serve as a bridge between user expectations and the design and functionality of digital products. The evolution from traditional methods to AI-driven approaches signifies a paradigm shift in how teams conceptualize, create, and leverage these maps to drive user-centric design decisions.
The Role of AI in Creating Accurate User Journey Maps
AI plays a pivotal role in enhancing the accuracy and efficiency of User Journey Mapping. By analyzing vast amounts of data and identifying patterns, AI can uncover insights that might be overlooked through traditional methods. The use of machine learning algorithms allows for a more nuanced understanding of user behavior, leading to more accurate and comprehensive User Journey Maps.
Utilizing AI-Powered Tools for User Journey Mapping
Several AI-powered tools have emerged to streamline the User Journey Mapping process. These tools leverage advanced algorithms to analyze user data and generate visual representations of user journeys. One such tool that has gained prominence is Insight7, which combines the power of AI with user-friendly templates to simplify the mapping process.
The Step-by-Step Guide to Using Insight7 for AI-Driven User Journey Mapping with Templates
Step 1: data collection.
To begin the User Journey Mapping process with Insight7, gather relevant data from various touchpoints. This can include user interactions, feedback, and analytics data.
Step 2: Inputting Data into Insight7
Once the data is collected, input it into the Insight7 platform. The tool’s intuitive interface allows for easy uploading and organization of data, ensuring a seamless transition to the mapping phase.
Step 3: Template Selection
Insight7 offers a range of templates designed for different types of user interactions. Choose a template that aligns with your specific goals, whether it be for onboarding, product exploration, or conversion.
Step 4: AI Analysis
The true power of Insight7 lies in its AI-driven analysis. The tool employs machine learning algorithms to identify patterns, trends, and correlations within the data, providing a deeper understanding of user behavior.
Step 5: Visualization
Once the analysis is complete, Insight7 generates visually compelling User Journey Maps. These maps outline the key touchpoints, user emotions, and potential areas for improvement.
Enhancing User Journey Maps with Qualitative and Quantitative Insights
As we navigate this intricate landscape, it becomes evident that a holistic understanding of user experiences necessitates a synergy between quantitative insights derived from AI and the qualitative richness offered by direct user feedback, surveys, and usability testing. Let’s explore the importance of combining these two dimensions and how this synthesis elevates the effectiveness of User Journey Maps.
The Importance of Qualitative Insights:
1. Human-Centric Perspective: Quantitative data, while powerful, often lacks the nuanced understanding of human emotions, motivations, and preferences. Qualitative insights, gleaned from user feedback and direct interactions, inject a human-centric perspective into User Journey Maps. This perspective is crucial for capturing the subjective aspects of the user experience that quantitative data might not fully encapsulate.
2. Contextual Understanding: Qualitative insights provide context to quantitative metrics. For instance, a spike in user drop-off rates identified through AI analysis may be better understood when supplemented with qualitative feedback that highlights specific pain points or user frustrations. This contextual understanding enables teams to interpret data more accurately and make informed decisions.
3. Identifying Unseen Issues: While AI is adept at identifying patterns and trends, it may not always uncover issues that are not explicitly defined in the data. Qualitative insights act as a detective tool, revealing latent problems that might have gone unnoticed in quantitative analysis alone. This proactive approach is vital for addressing potential issues before they escalate.
Integration of Quantitative and Qualitative Data:
1. Comprehensive User Profiles: By merging quantitative metrics with qualitative narratives, User Journey Maps can paint a more comprehensive picture of user profiles. This synthesis allows for the creation of detailed personas that not only include behavioral patterns but also reflect the diverse motivations, preferences, and pain points of users.
2. Data Triangulation: Combining both types of insights provides a form of “data triangulation,” where the strengths of one approach compensate for the limitations of the other. For instance, if AI analysis indicates a high bounce rate on a particular webpage, qualitative insights can uncover the specific reasons behind users abandoning that page.
3. Informed Decision-Making: User Journey Maps are not static; they evolve as products and user behaviors change. The integration of qualitative and quantitative insights facilitates ongoing refinement. Teams can make informed decisions about feature enhancements, usability improvements, or communication strategies based on a deep understanding of user needs.
Implementing a Holistic Approach:
1. User Surveys and Interviews: Conducting user surveys and interviews helps gather qualitative data directly from users. These insights can uncover subjective experiences, preferences, and pain points that may not be evident through quantitative analysis alone.
2. Usability Testing: Observing users interact with a product in real-time provides valuable qualitative insights. Usability testing identifies user struggles, confusion, or delight moments, contributing to a more nuanced understanding of the user journey.
3. Feedback Loops: Establishing continuous feedback loops ensures an ongoing influx of qualitative data. Regularly seeking and incorporating user feedback aligns User Journey Maps with real-time user sentiments.
In conclusion, the marriage of quantitative insights from AI with qualitative data forms the cornerstone of effective User Journey Mapping. This hybrid approach not only deepens the understanding of user experiences but also empowers teams to create user-centric solutions that resonate with the diverse needs of their audience. As we strive for excellence in user experience design, embracing both the art and science of user feedback ensures that User Journey Maps remain living documents that evolve in harmony with the ever-changing user landscape.
Continuous Optimization and Maintenance with AI
User journeys are dynamic and subject to change as products evolve and user preferences shift. AI plays a crucial role in continuously optimizing and maintaining User Journey Maps. Regularly update your maps based on new data and insights generated by AI algorithms. This iterative process ensures that your maps remain accurate and reflective of the current user landscape.
In conclusion, User Journey Maps are indispensable tools for enhancing user experiences, and the integration of AI elevates their accuracy and efficiency. Leveraging AI-powered tools like Insight7 streamlines the mapping process, making it accessible and insightful for teams of all sizes. By following a structured approach and combining quantitative AI insights with qualitative data, organizations can create User Journey Maps that not only identify pain points but also highlight opportunities for innovation.

How To Use AI to Create Buyer Persona Templates
Related posts, ai-powered customer journey analysis tools.
AI Jobs to be Done Framework Software
Prospect journey mapping best practices.
Unlock Insights from Interviews 10x faster
- Request demo
- Get started for free
Customer Journey Map with AI assistance
Welcome to the "Customer Journey Map with AI Assistance" template on Miroverse! Elevate your understanding of the customer experience by integrating the analytical prowess of AI into your user's journey mapping.
Key Features:
Comprehensive Journey Map Framework: Plot out every step of your customer's experience, from initial awareness to post-purchase behavior.
AI-Enhanced Analysis: Utilize AI to gain insights into customer emotions, pain points, and highlights, ensuring a deeply informed journey map.
Interactive and Guided Experience: Our template provides prompts and suggestions, with AI to offer data-backed optimizations for your customer journey strategy.
Collaborative Possibilities: Work together with stakeholders to refine your customer's path, ensuring a cohesive and customer-focused approach.
Customer Experience (CX) professionals seeking depth in journey analysis
Marketing teams aiming for a targeted approach
Product managers desiring to align features with customer needs
UX/UI designers crafting intuitive user interfaces
A richer, more accurate customer journey map informed by AI
Targeted strategies that meet customers at each touchpoint
Streamlined collaborative efforts across departments
The merger of qualitative and quantitative data for strategic planning
Utilize our "Customer Journey Map with AI Assistance" to capture the essence of your customers' experiences and tailor your services to meet their needs more effectively.
- Research & Design
- Meetings & Workshops
- UX & Design
- Design Sprints

Submit your template →
Do you have a great board to share with the world? We' ll help you turn it into a template to share with the community.
Similar templates

Rapid Prototyping With AI

AJ&Smart's Remote Design Sprint

Design Principles

- Case studies
- Expert advice
AI customer journey mapping prompts for ChatGPT
AI is more than a buzzword when it comes to journey mapping. If you have doubts about it, you will forget your concerns pretty soon.
In this article, you will learn how to leverage AI technology to your advantage when doing a journey mapping project. Read on to find ChatGPT prompt examples for different phases of a journey mapping project. You will also see the output produced by the chatbot for each prompt. Ready? Let’s go!
- 1.1 Creating a research plan
- 1.2 Interview questions
- 1.3 Surveys
- 1.4 Recruitment emails
- 1.5 Qualitative data analysis
- 2.1 Building personas from the ground up
- 2.2 Working with existing personas
- 2.3 Bonus: Persona photo
- 3.1 Defining journey stages & determining touchpoints
- 3.2 Completing map sections
- 4.1 Ideation
- 5 Summing up
- 6 Bonus Video
Research & analysis
Successful customer journey maps are backed up by research. Research takes time and requires resources that might not always be at hand. That is where AI — an intelligent and never sleeping assistant — comes into play to give you guidance and a helping hand.
Creating a research plan
Don’t know what to start with your case and have no one to consult? Before taking steps that may lead you to nowhere, embrace the power of the artificial brain to solve the problem.
“Imagine you are a customer experience mapper in healthcare, and your ultimate goal is improving patients' and doctors' experience. Your task is to pick appropriate research techniques to learn about their journeys and prepare a research plan. Limitation: doctors' availability is very limited (most likely, you'll have less than 1-2h a week of their time), and it might be problematic to talk to patients due to the sensibility of the subject.”
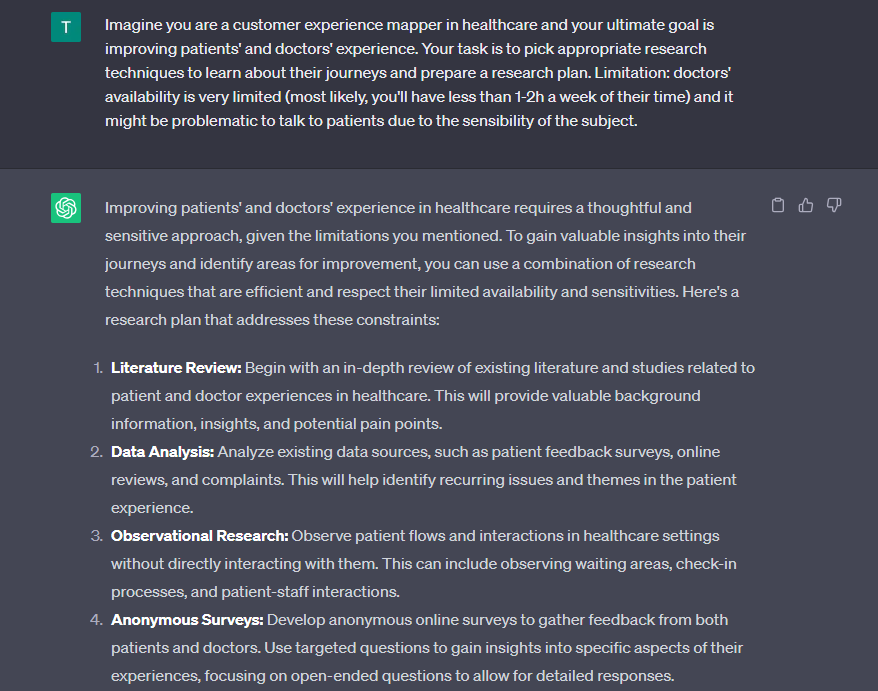
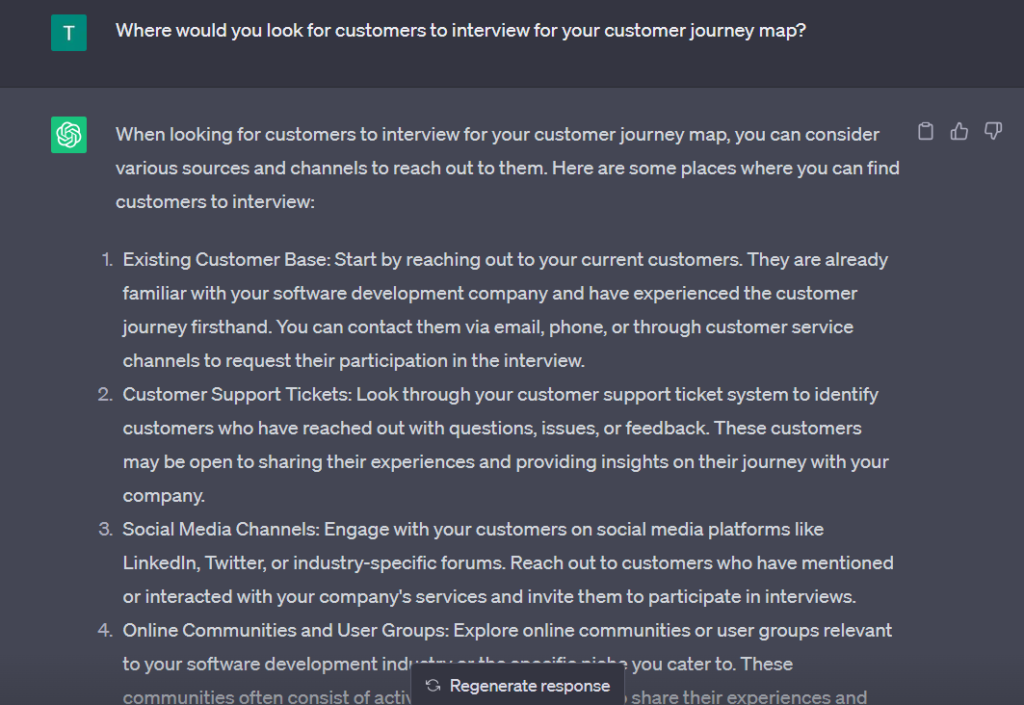
💡 Pro tip: You can also get advice on where to look for all the information.
“Where would you look for customers to interview for your map?”
Interview questions
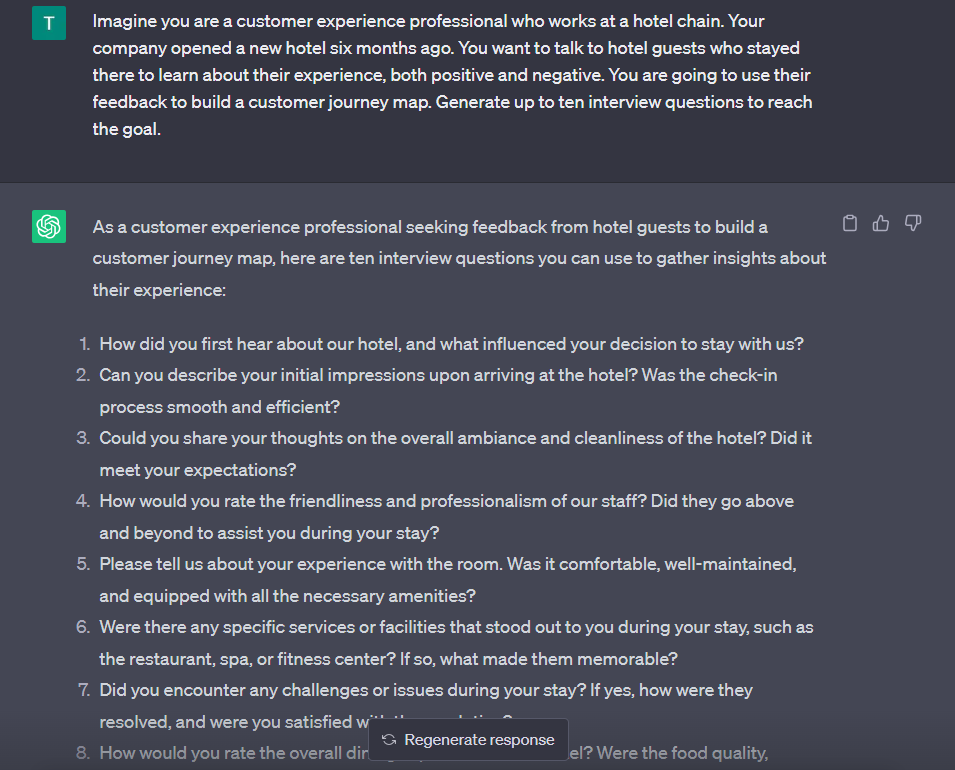
Tell ChatGPT about your business, give it the necessary context, and specify your interview goals and the number of questions you want to ask.
“Imagine you are a customer experience professional who works at a hotel chain. Your company opened a new hotel six months ago. You want to talk to hotel guests who stayed there to learn about their experience, both positive and negative. You are going to use their feedback to build a journey map. Generate up to ten interview questions to reach the goal.”
💡 Pro tip: You can get a lot of valuable data by interviewing your colleagues (especially customer-facing ones). So ask the chatbot to come up with questions for such interviews as well.
Another way to gather customer feedback is to send surveys. And AI can help you with writing questions for a survey.
“You are a customer experience specialist at an e-commerce company. The company wants to learn more about its customers' experience at different customer journey stages. You want to survey the company's customers for their feedback. For that purpose, you are going to send customers a survey. Come up with questions to use in the survey.”
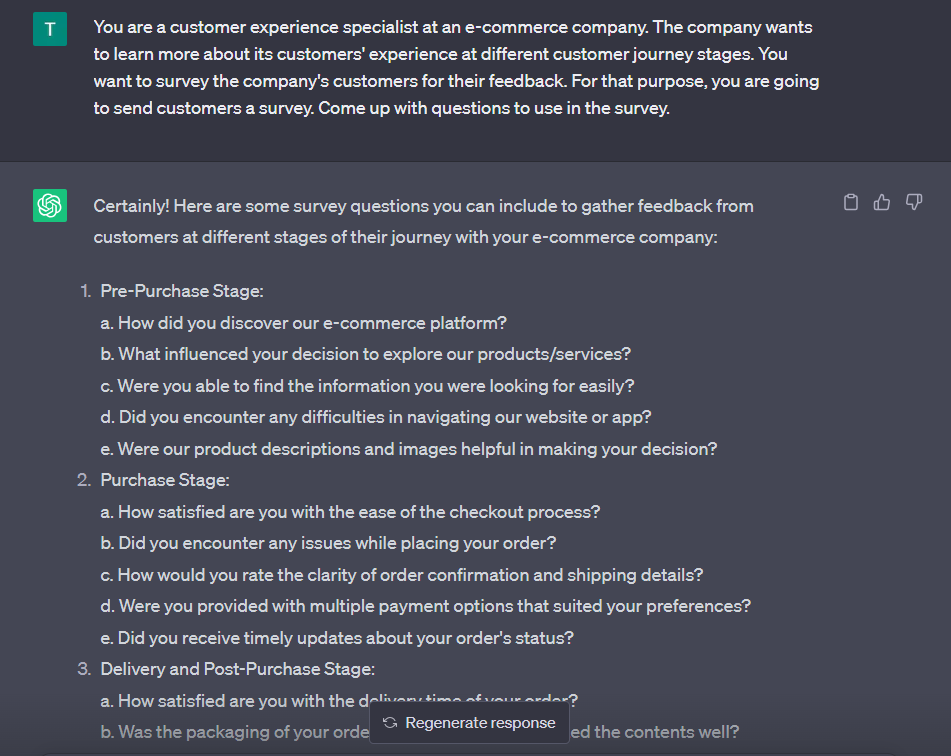
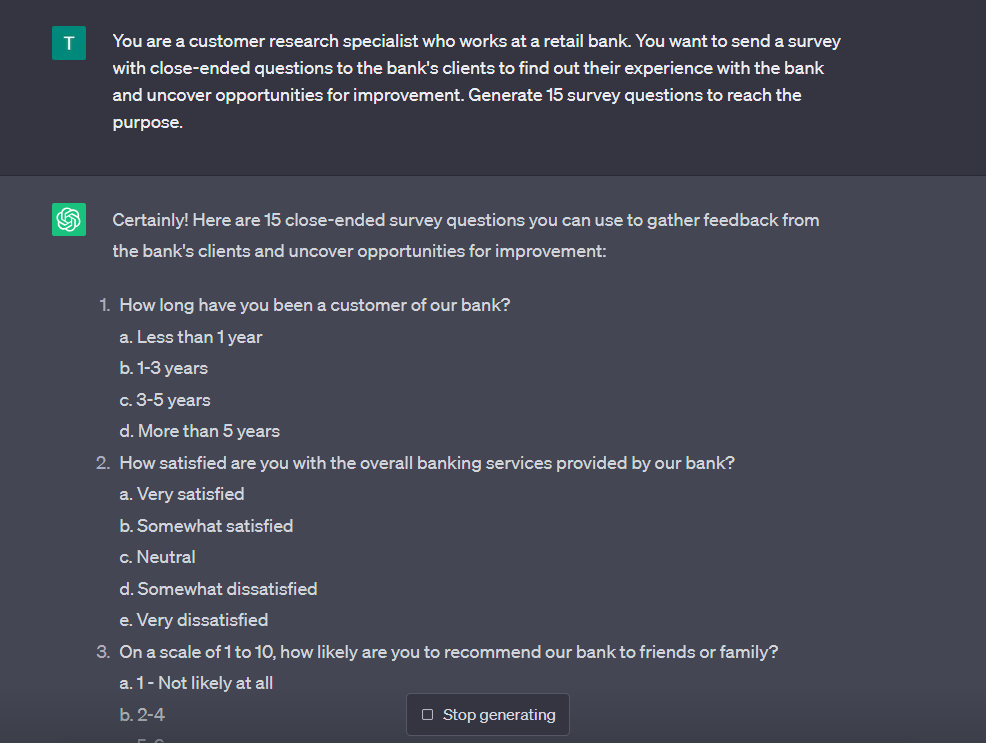
ChatGPT can generate both open- and closed-ended questions. So if you need a particular question type in your survey, ask about it.
“You are a customer research specialist who works at a retail bank. You want to send a survey with close-ended questions to the bank's clients to find out their experience with the bank and uncover opportunities for improvement. Generate 15 survey questions to reach the purpose.”
Recruitment emails
When sending an email to people you want to take part in a survey or interview, you never know how many people will say “Yes” to you. Play with AI AI to generate catchy subject lines that draw the recipient’s attention and text that drives action.
“You are a researcher who is going to send the survey to customers. Come up with alternative subject lines that catch the reader's attention and an email asking to participate in the survey. Avoid cliché and corporate language, make it friendly and human.”
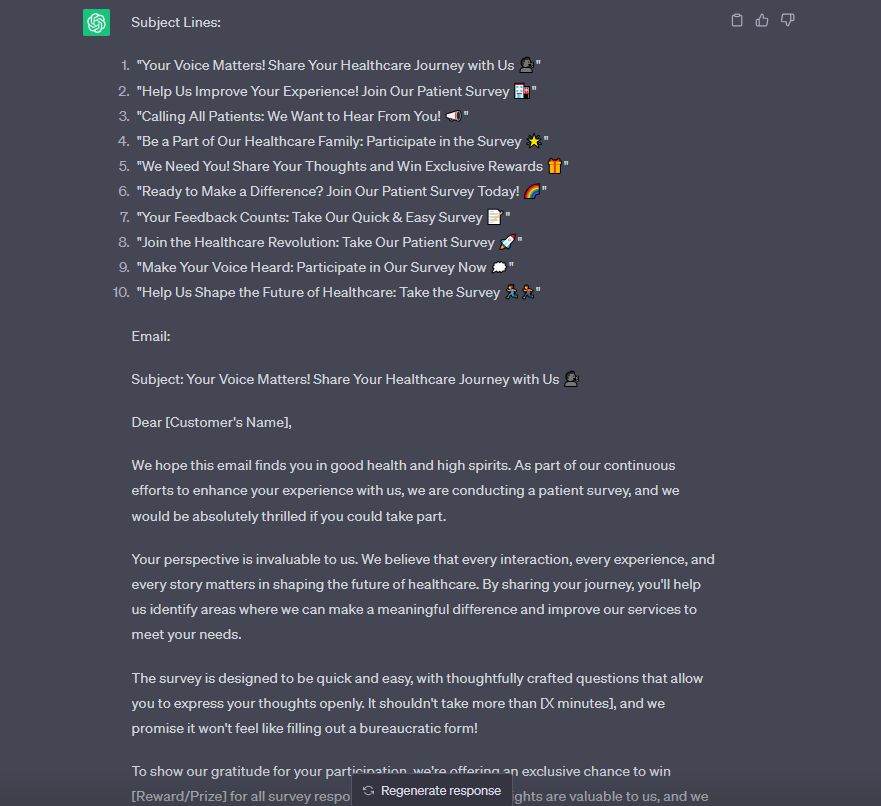
You will edit an email a little bit. But, in most cases, it will take less time than writing an email from scratch.
💡 Pro tip: If you have Tone of Voice guidelines you follow in the company, ask ChatGPT to follow them to get a better result. All you need to do is share these guidelines with the bot when you explain the task.
Qualitative data analysis
Whether you are a lone research ranger or a team of experienced researchers, there’s always a lack of time and a deadline on the horizon. You can move towards your goal quicker by making AI your data analysis buddy.
For example, you can ask ChatGPT to do a sentimen t analysis of customer feedback from review sites or social media comments.
“Act as a customer experience expert for a tech company selling a video conferencing product. Read the customer feedback below to determine patterns. Determine the average satisfaction rate based on the feedback, specify the customer's emotions, and support this info with insights.”
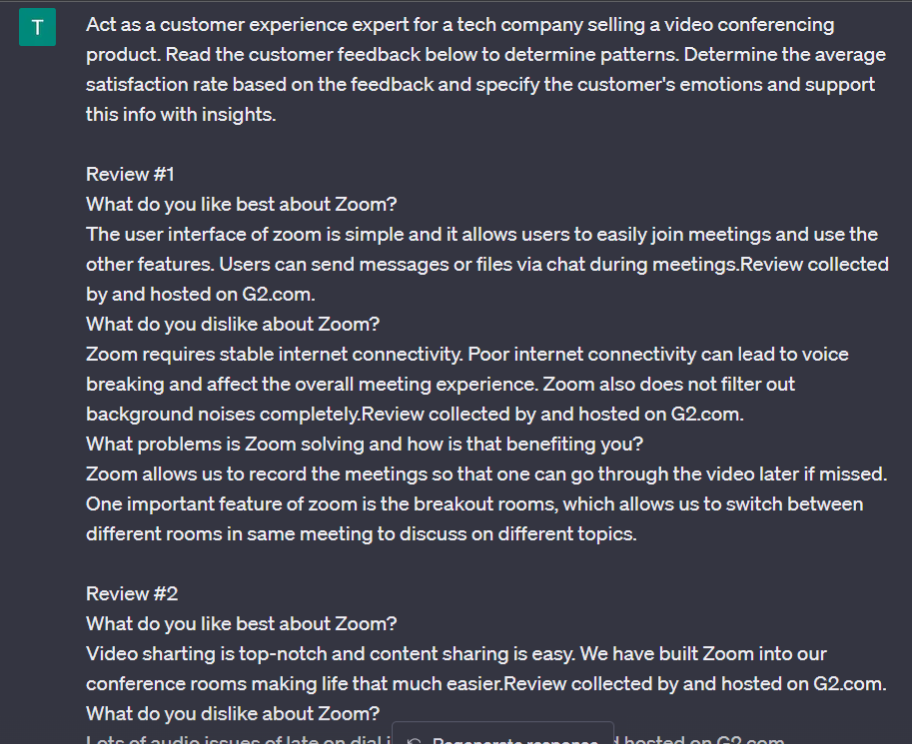
In the example above, four Zoom reviews from G2 were used.
Further, you can use this data in the experience section when building a journey map.

💡 Pro tips: ChatGPT can assist you with finding different patterns for a map. These can be Moments of Truth, common experience issues, etc. You can also ask the bot to create a summary of a user interview transcript or do a sentiment analysis of this script.
If you write the right prompt, it can even help you group your customer data into personas. If your prompt isn’t that good, you can always use more prompts to get the desired result.
Persona creation
There can be two scenarios for pairing AI with personas: building them from scratch and augmenting or improving them.
Building personas from the ground up
Turning your research data into living and breathing personas takes time, and AI can speed up the process. Sometimes, you may have no research data to back up the persona. You can describe your business case to AI, and it will generate a persona for you. Though personas generated by AI might be quite biased and stereotypical, they might give you good insights into behavioral scales to look into during your research.
- One persona
To get one persona, use a similar prompt:
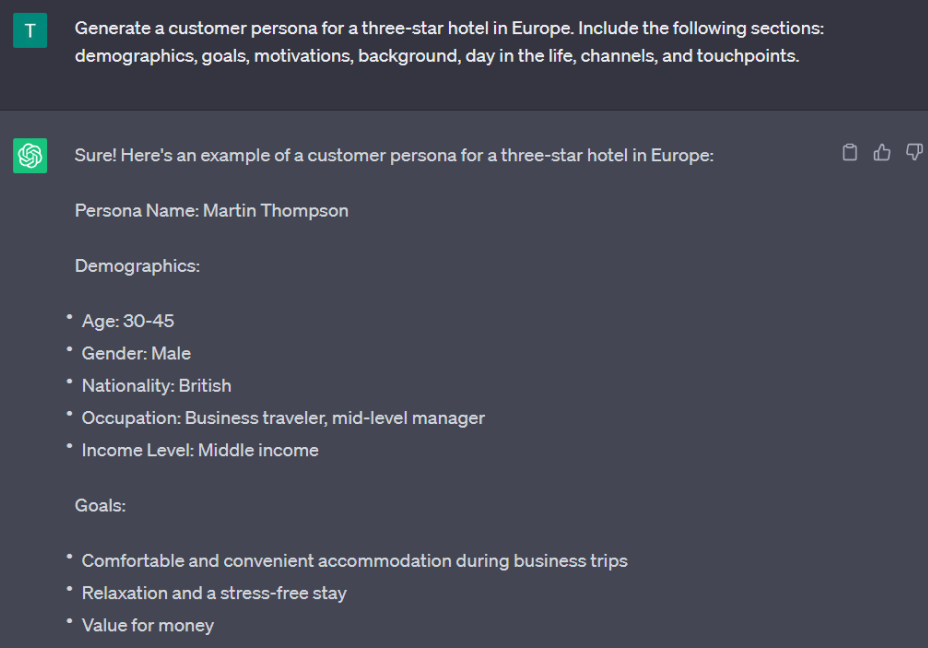
“Generate a customer persona for a three-star hotel in Europe. Include the following sections: demographics, goals, motivations, background, day in the life, channels, and touchpoints.”
- Multiple personas
Generating multiple personas might be more beneficial. You can see the difference between them, which helps you get your creative juices flowing and inspires further actions.
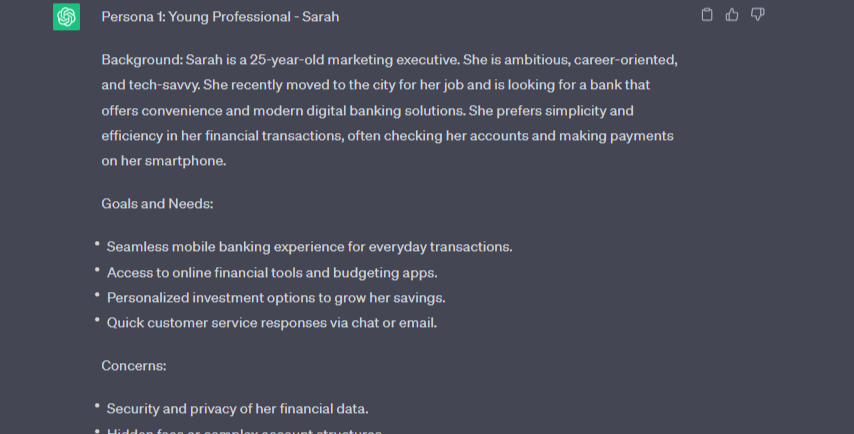
“Generate 5 different persona profiles that would represent a financial institution's potential clients who need to open an account. Focus on the differences in their behavior and make sure to cover different customer segments.”
💡 Pro tip: To save time migrating persona drafts from ChatGPT to another tool, you can create AI-driven personas in UXPressia's Persona Editor. There, you can make necessary adjustments and refinements both in terms of content and design.
Working with existing personas
If you already have a persona, you can utilize AI to enrich it with data, augment it to your needs, or suggest ideas.
- Producing ideas and strategies
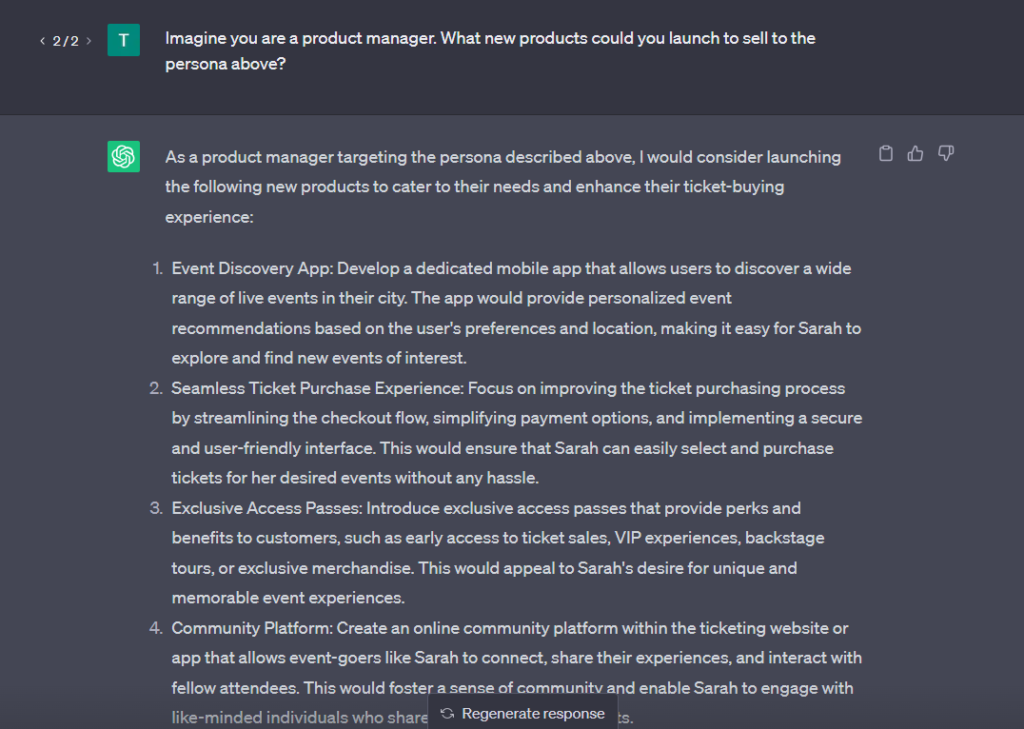
For instance, you can ask the bot to suggest new products or features for the persona.
“Imagine you are a product manager. What new products could you launch to sell to the persona above?”
Or request AI to go strategic and develop a strategy based on the persona(s).
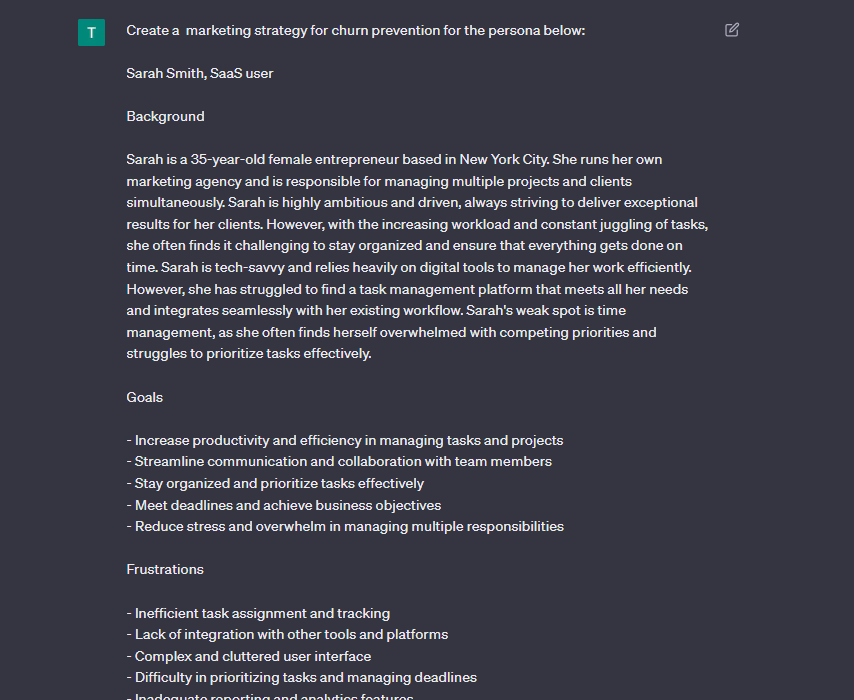
To do that, share your persona(s) with ChatGPT and request it to come up with, for example, a marketing strategy.
“Create a marketing strategy for churn prevention for the persona below.”
- Enhancing the profile with data
Imagine you decided to expand to a new market. But the thing is that you know your current market’s specifics but know only a little bit about the new market.
Use the knowledge your AI helper has to add the necessary information to your persona.
“We have a SaaS platform whose target market is the U.S and decided to launch a new version of the platform and sell it to people in Asia. We have a target customer profile for the U.S. market and we want to use this profile for the Asian version of the platform. Update the persona below with the Asian region specifics.”
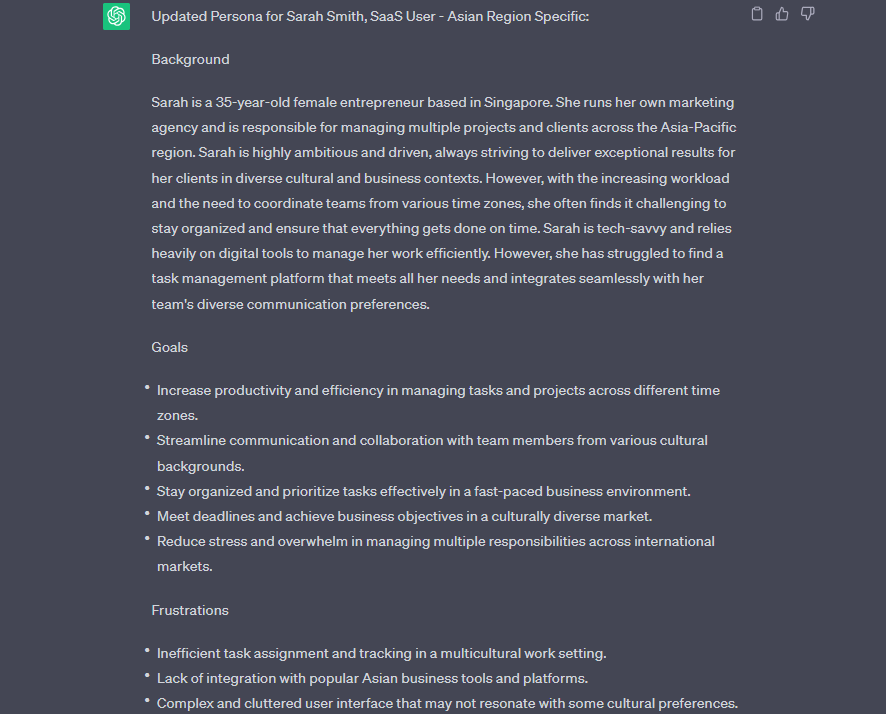
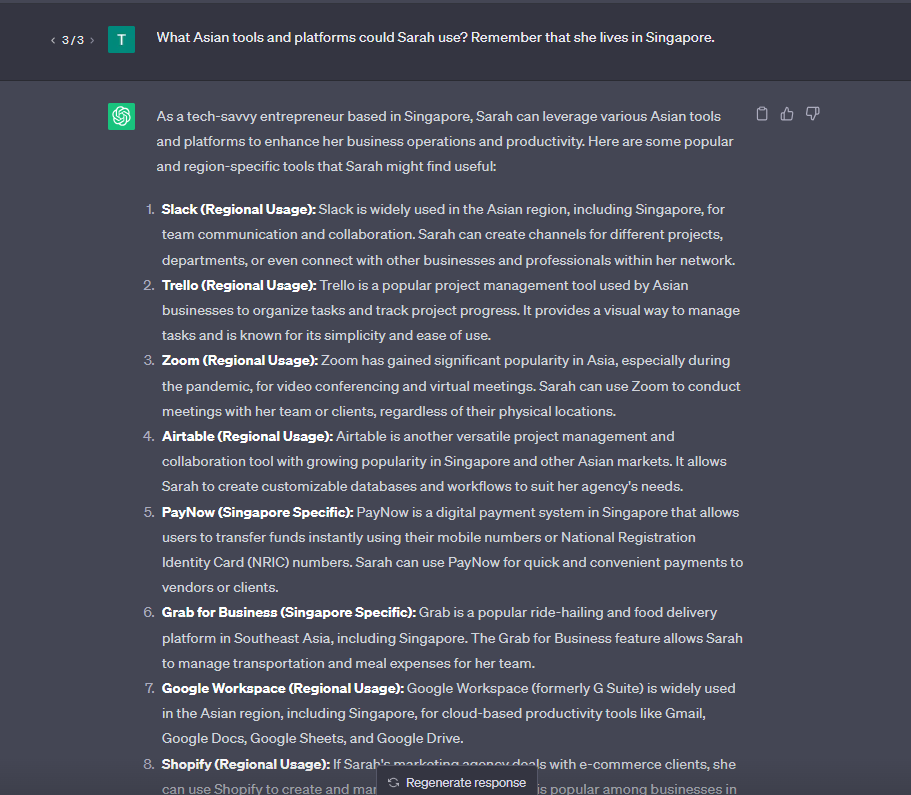
💡 Pro tip: You can dig deeper by asking AI to share examples of tools and platforms used by Sarah.
Bonus: Persona photo
A photo-like image of a persona drives empathy and helps everyone get on the same page quicker. Finding a perfect image to represent a persona ain’t easy. Plus, it may be subject to copyright.
You can ask an AI-powered image generator like DALL·E 2 or Midjourney to create a unique persona image based on your description. You’ll get it in seconds. And no copyright issues! Isn’t it fascinating?
“A middle-aged Chinese woman with short hair. She is making a phone call from home.”

Mapping the journey
When using ChatGPT, it's important to remember that AI can’t do all the work for you.
One of the central values of building a map is the process of collaboration within the team. It’s when you raise important questions, find common ground, and discover insights together. AI can’t simulate this process, but it can save you some time on routine tasks.
Defining journey stages & determining touchpoints
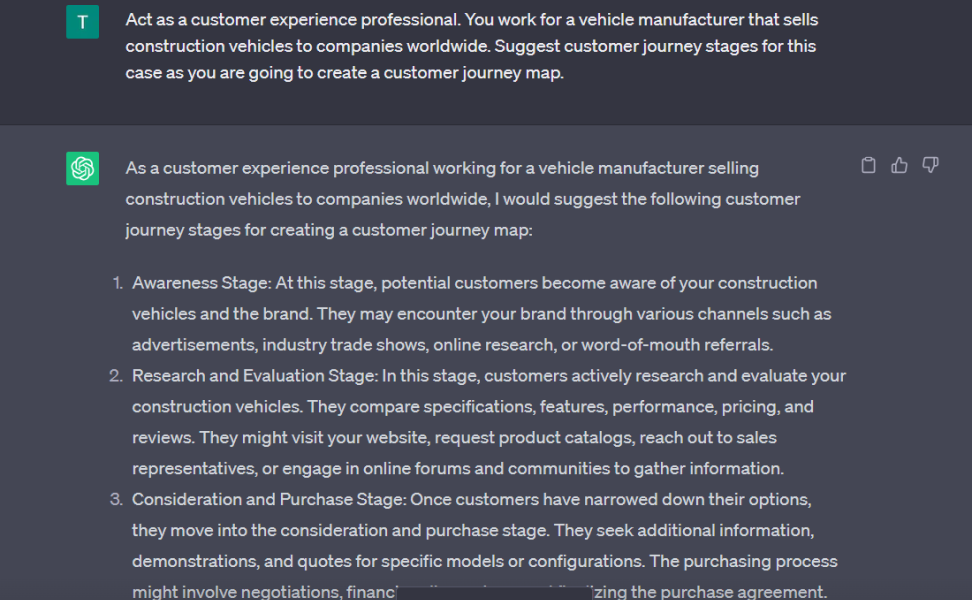
Whether you are going to map an end-to-end journey or a limited-scope one, dividing the journey into stages can be challenging. Describe your business case and the required scope to ChatGPT and ask it to come up with journey stages.
“Act as a customer experience professional. You work for a vehicle manufacturer that sells construction vehicles to companies worldwide. Suggest customer journey stages for this case, as you are going to create a customer journey map.”
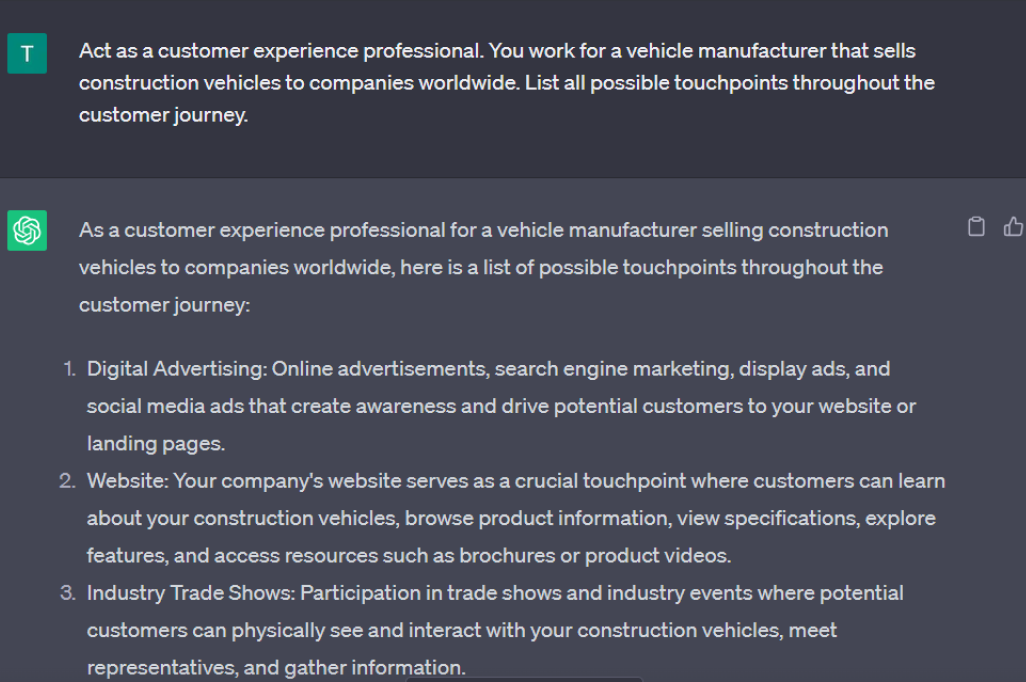
Or you can request it list all the possible touchpoints for this journey.
“Act as a customer experience professional. You work for a vehicle manufacturer that sells construction vehicles to companies worldwide. List all possible touchpoints throughout the customer journey.”
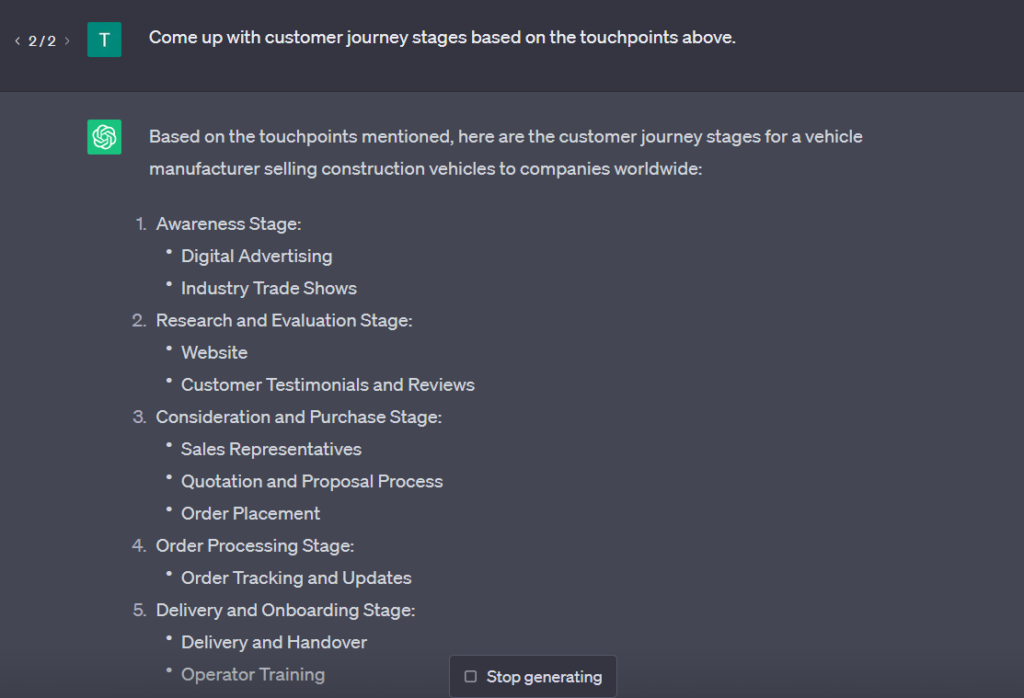
💡 Pro tip: AI can come up with stages based on the touchpoints provided by you or previously generated by it.
“Come up with customer journey stages based on the touchpoints above.”
Completing map sections
When populating your map with data, talk to ChatGPT to make your map even more informative and true to life.
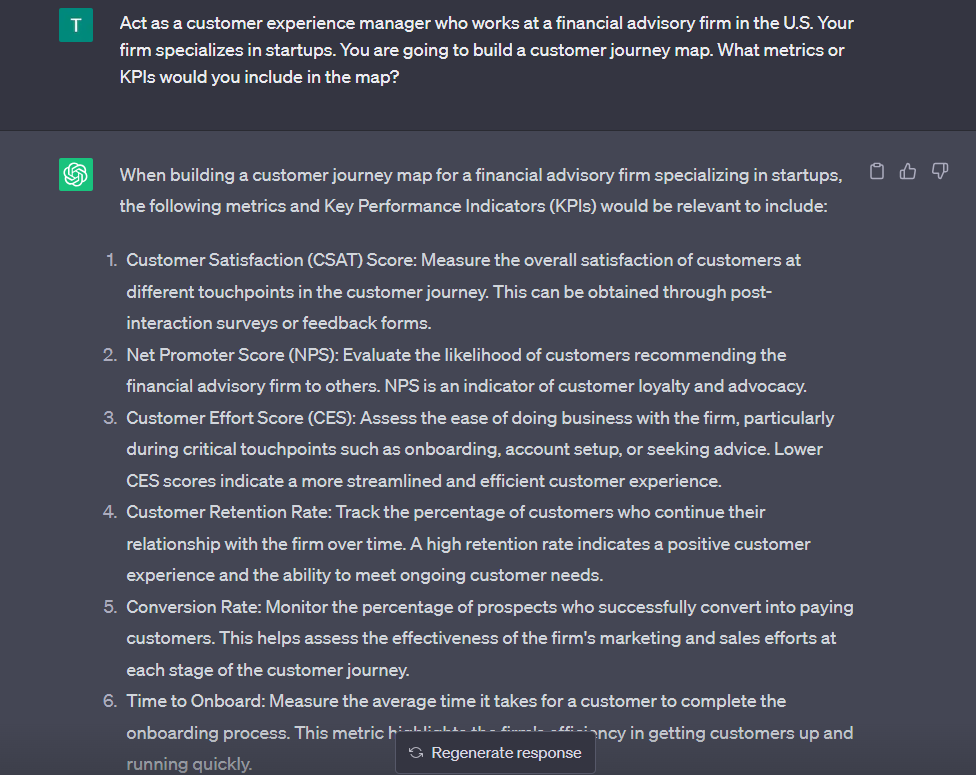
To be actionable, maps should include some experience- and maybe business-related metrics to keep an eye on. Don’t know what to use? There’s an intelligent someone to ask for advice 😉
“Act as a customer experience manager who works at a financial advisory firm in the U.S. Your firm specializes in startups. You are going to build a customer journey map. What metrics or KPIs would you include in the map?”
- Persona actions
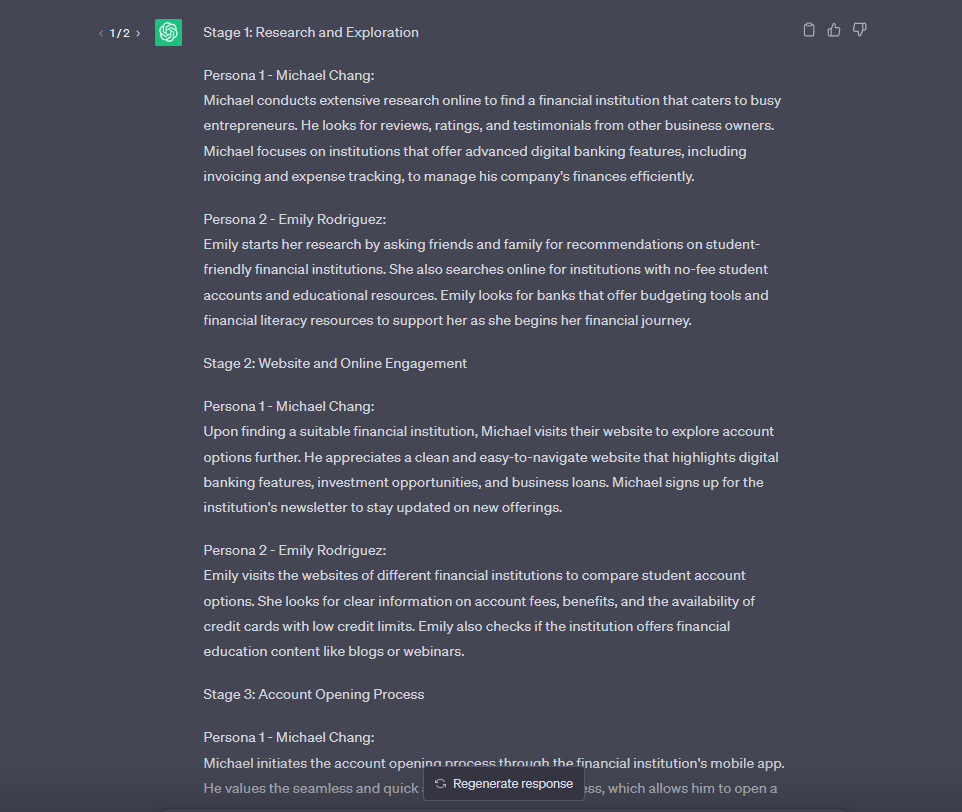
ChatGPT can list typical customer actions at each stage of the journey. That will help you determine whether you missed something when describing your persona’s actions.
You can go further. Ask AI to list stage-specific actions for two or more different personas and specify the differences in their behavior.
💡 Pro tip: It’s better to share your personas with the bot before asking it to produce stages and actions.
“I have two personas who go through the journey of opening an account in a financial institution. Describe their actions at each stage of the journey and specify the differences in the behavior at every stage. The personas are below.”
- Pain points
If you’ve done the research, you certainly have a list of pain points your customers encounter daily. But is this list complete? Ask ChatGPT to share possible customer experience problems for your persona on its journey with you.
You can even uncover industry-, country-, or regulatory-specific issues.
“Imagine you are a customer of a French insurance company. What customer experience issues do you face throughout your customer journey? Also, list customer experience issues specific to this industry and country.”
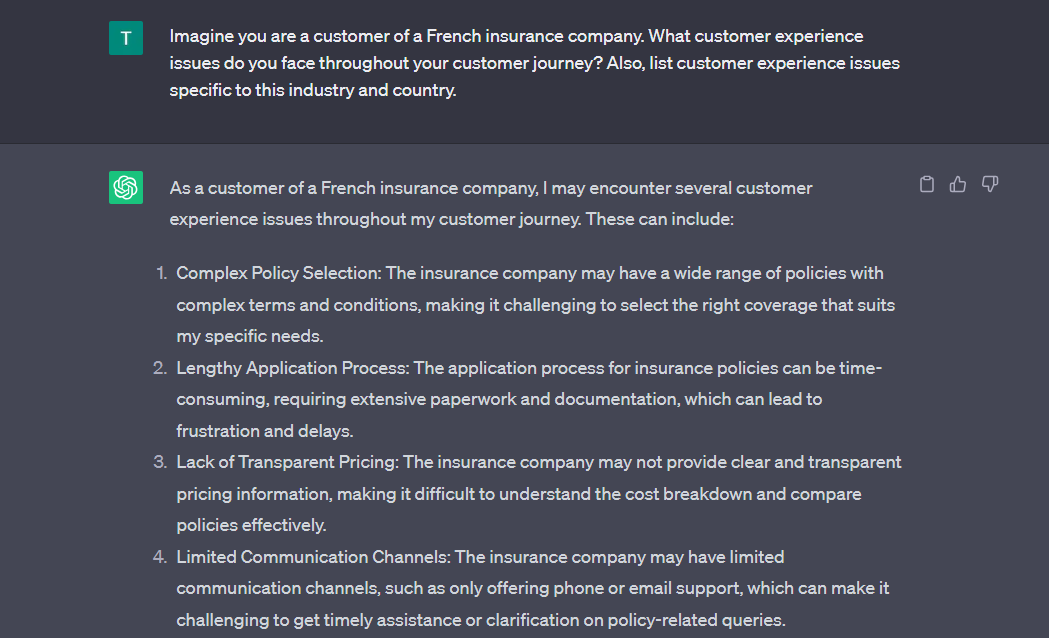
Continue the dialogue with your virtual assistant to get more valuable results.
“Describe the language barriers that insurance clients may face when receiving insurance from a French company.”
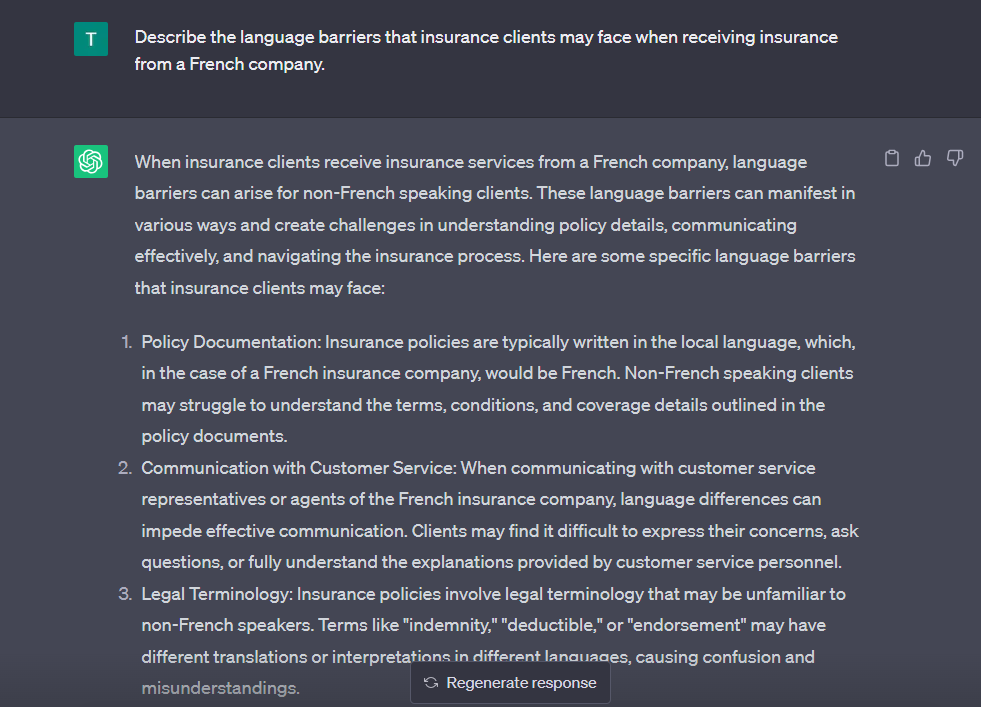
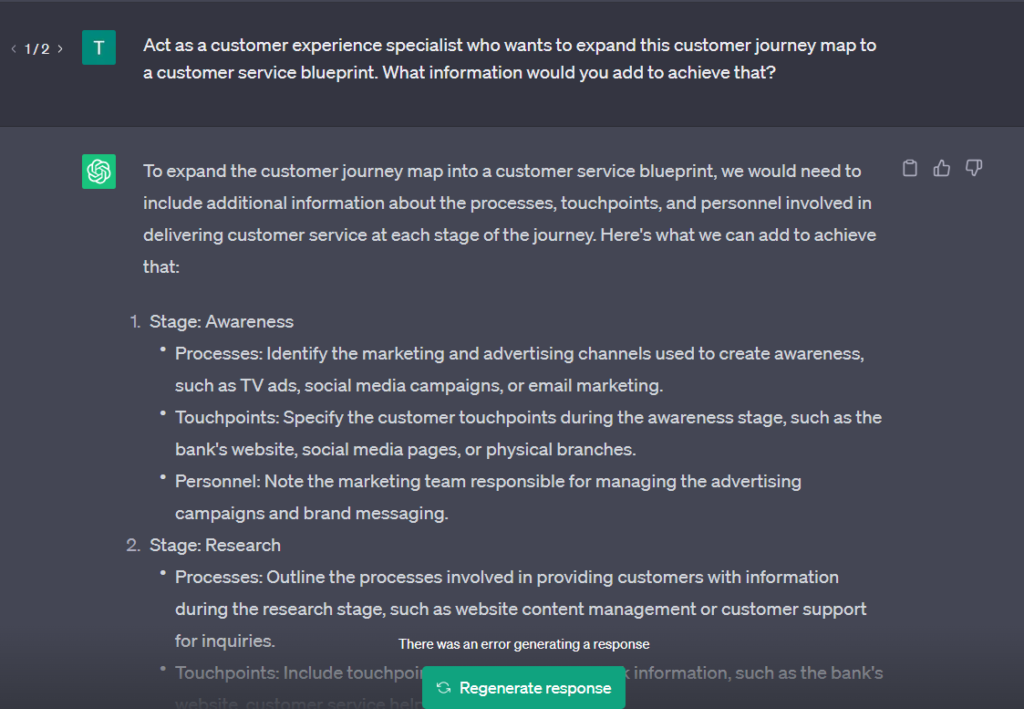
💡 Pro tip: If you are going to extend your map further to, say, create a customer service blueprint, the chatbot can provide you with ideas on what to include in it.
“Act as a customer experience specialist who wants to expand this map to a customer service blueprint. What information would you add to achieve that?”
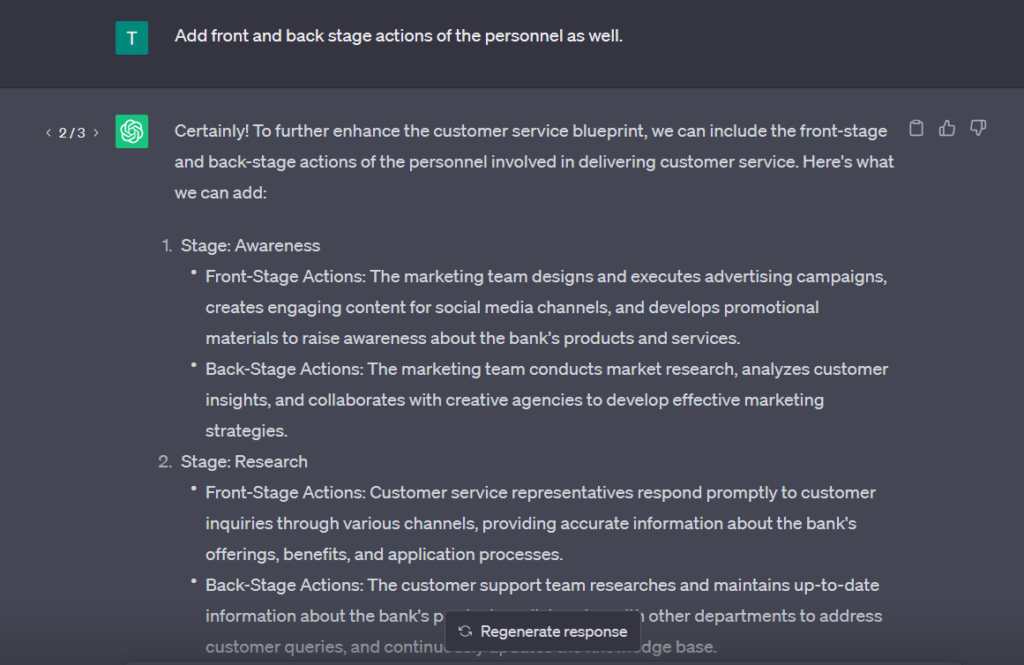
“Add front and back stage actions of the personnel as well.”
Ideas, plans, and actions
When you complete and validate the map, the following steps are coming.
The first one is to generate ideas on how to improve the experience where it’s essential.
People work hard at ideation sessions, developing amazing ideas that can lead to great results. But how to make sure you haven’t missed an important idea? Something that could become a quick win and help you sell other time- and resource-intensive ideas to the management team.
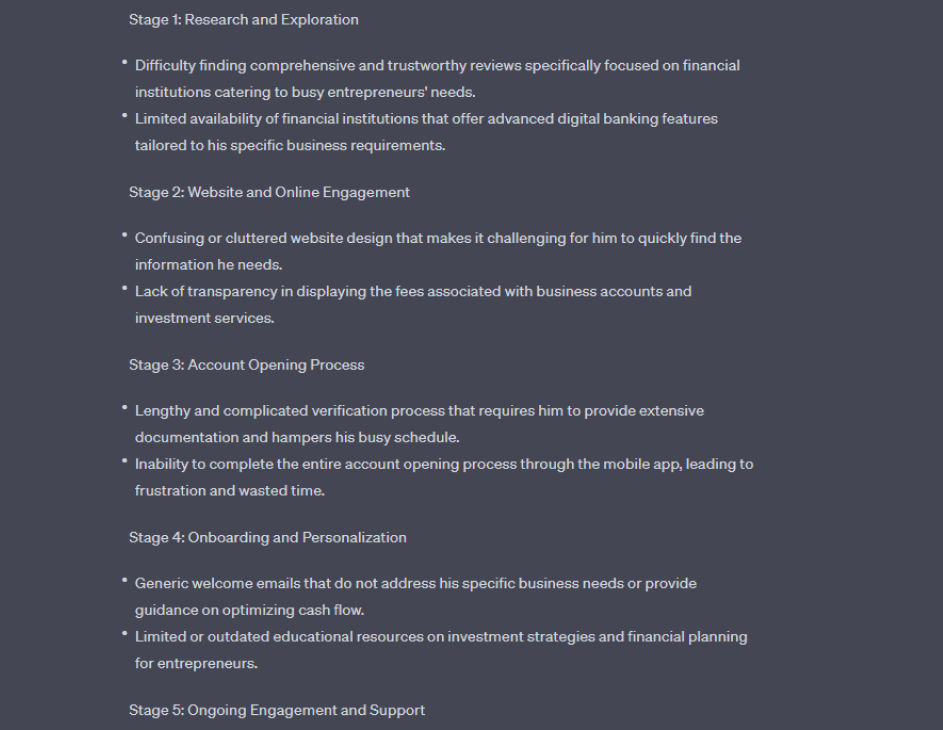
Well, there’s a way to find it out. Share your persona with the chatbot along with its problems and ask ChatGPT to craft ideas on how to solve these problems.
“I have a persona who faces different problems during their customer journey. Generate ideas on how to solve these problems. The persona and the description of the problems are below.”
💡 Pro tip: If you want to get a detached view of your ideas and help you decide which ones should be on your to-do list, the chatbot is an excellent tool for that purpose.
“I have two ideas for improving the persona's customer experience at this stage. [Idea #1: …], [Idea #2: …]. Evaluate these ideas. Which one is better to implement?”
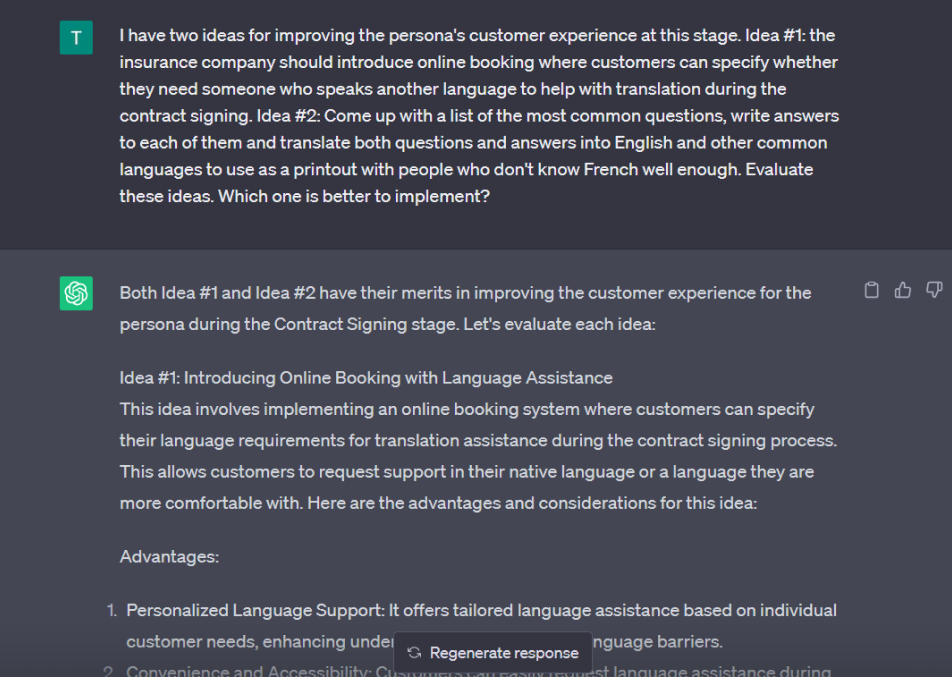
When implementing your action plan, don’t hesitate to make use of ChatGPT, which can be helpful whenever you need to produce some textual content.
For example, suppose you are going to change product descriptions as customers find them confusing and setting wrong expectations. In that case, the "AI head" can generate alternative descriptions for you.
“Write a description of an electric kettle for a website. The description must contain the following details: blue color, built-in thermometer, leak-free, made of premium stainless steel and BPA-free & rust-free. It's important to mention that the warranty is six months, but it can be extended during the purchase, not after it. The client must choose the extended warranty option on the checkout page. The description length is from 300 to 400 words. Tone: friendly, informative.”
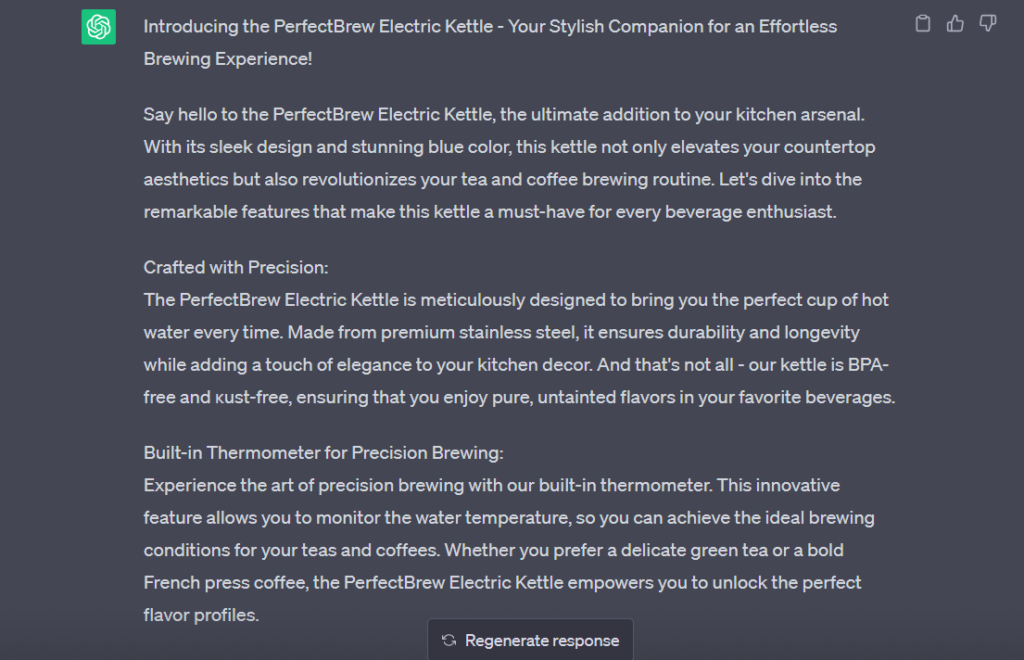
Other use cases would be writing scripts for the customer service team, answers that support agents send to customers, Help Center articles, etc.
Artificial intelligence is not a customer experience enemy. It’s a good friend and self-educated expert. A virtual assistant who keeps on learning and is ready to give you a helping hand in your journey mapping activities at any time of the day or night.
You can quicker do boring or time-consuming tasks like identifying patterns in large datasets and conducting basic research, enrich your persona and journey map with essential data it’s missing (e.g., regulations), get a bunch of inspiration by generating experience enhancement ideas that nobody on your team could think of, and do many other things. And AI will never replace the human touch that a journey map needs to become actionable and deliver results.
In this blog post, you’ve read some customer journey mapping prompts that work well in ChatGPT. Feel free to adjust them to your business case to get the most out of AI-powered customer journey mapping.
Bonus Video
Watch a recording of the webinar, where Noz Urbina , founder of Urbina Consulting , talked about accelerating journey mapping with AI.
Related posts
Rate this post

Keep up the great work! Thank you so much for sharing a great posts.

Step inside a demo session!
Join us for a live tour of UXPressia and see how effortlessly you can create comprehensive customer journey maps and personas with our platform.
REQUEST A DEMO
P.S. We’ve got AI functionality for personas 😉
AI and Customer Journey Mapping: Elevating the CX Strategy
- November 23rd, 2023
Peeking into the future of customer engagement, AI-enhanced customer journey mapping stands out, revolutionizing how businesses interact with consumers. This smart synergy is redefining personalized marketing strategies.
Discover how AI and Customer Journey Mapping go hand in hand to unveil intricate patterns in customer behavior, taking predictive capabilities to new heights. The use of AI forges a clear path in customer journey mapping, providing unprecedented insights that fuel Predictive Analytics in Marketing , and thus, allowing companies to anticipate needs and create hyper-targeted campaigns that resonate with each individual’s journey.
Understanding Customer Journey Mapping in the AI Era
Customer journey mapping is an indispensable tool, a visual representation that traces a customer’s footsteps from initial contact to eventual conversion and beyond. Now, weave in the transformative power of AI, and you get a dynamic process that not only depicts the journey but also breathes life into data, uncovering the rich tapestry of consumer interactions.
The Awareness Stage
Traditionally, the customer journey commences at awareness, where potential customers first encounter a brand. AI escalates this stage by analyzing vast amounts of data to determine how, when, and where a brand should make its grand entrance, maximizing impact. With intelligent AI for brand management , businesses can ensure that the first impression is not just seen but felt.
The Consideration Stage
As customers move into the consideration stage, AI steps in to skillfully guide them. Algorithms analyze past behaviors, preferences, and engagements, delivering personalized content that speaks directly to the heart of each customer’s needs, nurturing their journey with finespun precision.
The Decision Stage
Decision-making is no small feat. Here, AI becomes indispensable, offering predictive analytics to craft proposals that hit the mark. It’s like having a digital crystal ball, illuminating the path to conversion with greater certainty and helping brands to be proactive rather than reactive.
The Retention Stage
Loyalty is the ultimate prize, and AI does not stop at the sale. Machine learning algorithms assess post-purchase behaviors, cueing in on opportunities for upselling, cross-selling, and engaging in ways that turn one-time buyers into brand advocates.
Each moment in a customer’s journey is a chance to connect more deeply, and with AI for Real-Time Marketing Analytics , these connections are made increasingly relevant and timely. It’s a brave new world for customer journey mapping, and AI is the intrepid navigator leading the charge.
Key Benefits of Integrating AI into Customer Journey Mapping
- Enhanced Understanding of Customer Behaviors: AI-driven customer journey mapping allows for the deep analysis of customer behavior, uncovering patterns that are invisible to the human eye. This leads to much more effective targeting and personalization strategies.
- Accurate Predictive Analytics: Leverage AI to forecast customer needs and future behaviors, providing businesses with the power to anticipate rather than react. Engage customers at the perfect moment with the right message, driving conversions.
- Dynamic Personalization: By crunching vast datasets, AI offers on-the-fly personalization, giving each customer a unique experience tailored to their preferences, history, and real-time activity.
- Real-Time Decision Making: With AI, customer journey mapping evolves from a static to a dynamic tool. Business decisions can be made in real-time, responding to ever-changing market conditions and customer interactions.
- Increased Operational Efficiency: Automate routine tasks and analysis within the customer journey, freeing up valuable human resources for creative and strategic initiatives.
- Optimized Marketing Spend: By understanding and predicting customer behaviors, AI helps allocate marketing budgets more effectively, ensuring higher returns on investment.
- Revolutionized Content Delivery: AI’s role in content strategy is transformative, aligning content precisely with the stages of the customer journey for maximum impact and engagement. This is where AI in Video Marketing shines, providing dynamic video content that engages customers at just the right points in their journey.
- SEO Mastery: AI drastically improves search engine optimization, ensuring content surfaces at the top of search results at critical moments in the consumer journey. AI for SEO Optimization brings a competitive edge, making sure a brand is visible when it counts the most.
Top AI Tools for Enhanced Customer Journey Analysis
As we delve deeper into the potential of AI-enhanced customer journey mapping, the right tools can be pivotal. They bring a suite of capabilities that can meticulously dissect, analyze, and interpret consumer data, paving the way for powerful, actionable insights. Here’s a table featuring leading AI tools designed to elevate your customer journey analysis, complete with key features to cater to your strategic needs and respective price points for thoughtful budgeting. Witness firsthand how AI refines marketing automation and sentiment analysis to optimize customer interactions at every touchpoint.
Each of these tools offers a unique set of capabilities to assist marketers in not just mapping but mastering the customer journey with an AI edge. Whether you’re looking for an introductory platform or a more robust enterprise solution, there’s an AI tool out there to help you make data-driven decisions and enhance customer connections at scale.
Real-World Examples of AI-Powered Customer Journey Mapping Success
When theory meets practice, AI-powered customer journey mapping reveals its true potential. Countless companies across the globe are already reaping the lucrative rewards of integrating artificial intelligence into their customer journey analysis. Let’s dive into some compelling case studies that showcase the impact of AI on understanding and enhancing the customer experience.
Zalando: Personalization at Scale
Europe’s leading online fashion platform, Zalando, turned to AI to refine its customer journey mapping. The integration of AI solutions allowed for the creation of highly personalized recommendations, resulting in a surge in customer satisfaction and retention. By implementing AI in their social media marketing , they achieved a 95% accuracy rate in personalized offerings, which increased conversion rates significantly, proving the invaluable influence of AI in understanding and catering to customer preferences.
Netflix: Mastering Engagement with AI
Netflix’s recommendation engine is a triumph of AI-powered customer journey mapping. By analyzing immense datasets on viewing habits, the system offers tailor-made shows and movies, enticing users to binge-watch. The success is clear: customers enjoy highly relevant content, and for Netflix, this meant an impressive retention rate and a marked uptick in membership growth, showcasing how AI can revolutionize entertainment engagement.
Sephora: Revolutionizing Beauty Retail with AI
The beauty giant Sephora embraced AI to enrich its customer journey mapping, leading to a dramatic overhaul of both their in-store and online experiences. AI-backed tools like their Virtual Artist app, which employs facial recognition to allow users to try makeup virtually, have sky-rocketed customer interaction and boosted e-commerce sales. This AI initiative showcases the power of cross-channel marketing , where each touchpoint is an opportunity for enhanced connection with customers.
Each story is a testament to AI’s role in crafting journey mappings that don’t just track but also elevate every step of the consumer’s path. The results — increased engagement, soaring conversion rates, and customer advocacy — are a clear signal that leveraging AI is not just beneficial but essential for modern businesses aiming to excel in customer understanding and service.
How to Implement AI in Your Customer Journey Mapping Strategy
Ready to harness the power of AI in your customer journey mapping? This can seem like a daunting task, but fear not! Here’s a foolproof, step-by-step guide that talks you through the seamless integration of AI technologies with your existing strategies, ensuring you can navigate the complexities with confidence.
- Define Your Goals and Metrics : Begin by knowing what you want to achieve with your customer journey mapping. Is it to improve conversion rates, boost customer satisfaction, or reduce churn? Establish clear metrics to measure the impact of AI on these goals.
- Gather and Integrate Data Sources : Centralize diverse data sources to provide a comprehensive view of the customer journey. AI systems require a plethora of data to analyze and learn from; it’s critical to integrate CRM, social media, purchase history, and any other customer data points.
- Segment Your Audience : Use AI for Customer Segmentation to divide your audience into distinct groups based on their behaviors and preferences. Accurate segmentation is vital for the next steps of personalization and predictive analysis.
- Implement AI Tools : Choose AI tools that align with your business needs. Some platforms specialize in predictive analytics, while others excel in real-time personalization or operational efficiency. Comprehensively test these tools to ensure their compatibility with your data infrastructure.
- Personalize Customer Interactions : Leverage AI to create personalized messages and campaigns for different audience segments. Tailored communication strengthens the bond with customers and guides them smoothly along the purchasing journey.
- Monitor Real-time Customer Behavior : With AI-driven analytics, monitor customer interactions as they happen. This real-time observation helps in quickly identifying patterns or issues that could affect the journey and allows for immediate response.
- Optimize for Voice Search : Ensure your content is discoverable through voice queries by using AI for Voice Search Optimization . As voice-activated devices become more prevalent, accommodating voice search in your customer journey mapping is increasingly important.
- Analyze and Iterate : No AI implementation is perfect from the get-go. Regularly analyze your AI-enhanced customer journey mappings for insights, and refine your strategies and tools based on this data. Embrace a cycle of continuous improvement.
By integrating AI into your customer journey mapping, you unlock a new dimension of customer insights and predictive analysis. Remember, the key is not just to map the customer journey but to enhance it. These steps are iterative and ongoing – evolve your strategy as AI technologies and customer behaviors evolve, ensuring that your journey mappings remain as dynamic and insightful as the customers they represent.
The Future of Customer Experience: Predictions for AI Advancements
As we gaze into the crystal ball of customer experience, AI advancements stand at the forefront of innovation. We’re not just talking about incremental changes; we’re witnessing the dawn of a revolution in the way customer journey mapping is conceptualized and executed. AI is the maestro orchestrating a future where customer interactions are more intuitive, predictive, and satisfying than ever before.
Predictive customer journeys, powered by AI, will likely become even more nuanced and anticipatory. Imagine AI-driven visual marketing strategies so advanced that AI-Driven Visual Marketing tools not only produce content but also predict the types of visuals that will spur customer engagement at different journey stages. With AI’s help, these strategies will be tailored in real-time, based on the customer’s current emotions and behaviors.
Moreover, as AI becomes more ingrained in our lives and businesses, the industry will have to navigate the nuances of Ethical Considerations in AI Marketing . We’ll see a push towards transparent AI — algorithms that not only make decisions but can also explain them in a way that’s understandable to both marketers and customers alike. Privacy concerns and the respectful use of data will be paramount, with AI serving as a steward of consumer trust rather than a threat to personal privacy.
The future of customer journey mapping with AI looks bright, brimming with potential and ethical responsibility. As technology races forward, businesses will be compelled to adapt or be left behind, all the while ensuring that the customer remains at the heart of every AI-enabled experience.
Conclusion: The Synergy between AI and Customer Journey Mapping
Throughout our exploration, it’s become clear that the fusion of AI and customer journey mapping spells a transformative leap forward for customer experience. From the revelation of hidden behavioral patterns to predictive analytics and personalized real-time engagement, AI has supercharged the entire journey mapping process. It’s afforded businesses not just a map, but a GPS, dynamically updating and guiding the customer experience with uncanny precision.
Embracing AI-driven Email Marketing and leveraging AI for Competitive Analysis are just the beginning. Forward-thinking businesses that adopt AI tools are bound to gain a competitive edge through deeper customer insights and more efficient marketing strategies. In this rapidly advancing landscape, integrating AI into journey mapping isn’t just a smart move—it’s an essential step into the future of customer connection and understanding.
Related Content
Latest from the blog, impersonation of president biden highlights election security concerns, sam altman at davos: a vision of ai’s future, from personalization to global impact, game changer: valve’s steam unleashes ai-powered game revolution with new rules, robots are coming for nearly half of our jobs – will yours be next, expert guide on ai and machine learning: comprehensive course insights, new ai tools.

- Book a Demo
- Contact Sales
- There are no suggestions because the search field is empty.
The Impact of AI on Customer Journey Mapping and Management

U nderstanding and optimizing the customer journey is paramount for delivering exceptional customer experiences. With the advent of artificial intelligence (AI), customer journey mapping has evolved significantly, offering new opportunities and challenges. Let's take a look at some of the pros and cons to consider before deciding if, when, and how AI can be beneficial in designing customer experiences.
Pros of Using AI in Customer Journey Mapping:
Data-Driven Insights
AI has the remarkable ability to process and analyze vast amounts of data quickly and accurately. For CXers, the process of aligning unstructured data into a cohesive customer journey map can be a complex and time-consuming task. AI excels in processing vast amounts of unstructured data from various sources, including customer feedback, social media, and user reviews. For CXers, this means the ability to efficiently extract valuable insights from text, audio, and visual data. AI can identify patterns, trends, and hidden opportunities that may not be apparent through manual analysis, a capability that allows CX professionals to gain deeper insights into customer behaviors and preferences. This data-driven approach enables more precise customer journey mapping, helping you tailor your strategies to meet customer expectations.
Personalization at Scale
One of the significant advantages of AI in customer journey mapping is the ability to personalize interactions at scale. AI algorithms can segment customers based on their behaviors, demographics, and preferences, allowing you to deliver tailored content, recommendations, and offers to individual customers. This personalization enhances customer satisfaction and engagement, increasing retention rates and sales.
Predictive Analytics
AI-powered analytics can generate predictive insights by identifying potential pain points, opportunities, or issues in the customer journey. Researchers can use these insights to proactively address customer needs and expectations, ultimately leading to better user experiences.
AI can also predict future customer behavior by analyzing historical data and trends. This is invaluable for CXers, as it enables them to address potential issues and opportunities in the customer journey proactively. Predictive analytics can help to optimize touchpoints, streamline processes, and anticipate customer needs, ultimately leading to better customer experiences.
Pattern Recognition
AI algorithms can identify patterns and trends in unstructured data that might be challenging to discern manually. By recognizing recurring themes and behaviors in customer interactions, researchers can gain a deeper understanding of the customer journey. This enables more accurate and nuanced mapping that can guide improvements in the overall user experience.
Rapid Analysis
AI's ability to process data at high speeds can significantly expedite the research process. CXers can quickly analyze large datasets, saving time and resources. This rapid analysis facilitates timely decision-making and agile adjustments to the customer journey, ensuring that it remains relevant and effective.
Automation of Routine Tasks
AI can automate repetitive and time-consuming tasks, improving CX by quickly and efficiently solving customer issues or questions. For example, chatbots and virtual assistants can handle customer inquiries, ticket routing, and basic problem-solving, improving response times and reducing operational costs. This automation ensures that customers receive prompt assistance and support, enhancing their journey.
Cons To Consider When Using AI in Customer Journey Mapping:
Data Privacy Concerns
AI collects and analyzes customer data, raising concerns about data privacy and security. Customers are becoming more cautious about how their data is used, and any mishandling can lead to trust issues. CX professionals must strike a balance between personalization and respecting customer privacy, complying with data protection regulations like GDPR and CCPA.
Ethical Concerns
AI's ability to analyze large datasets can raise ethical concerns, especially regarding privacy and consent. CXers must be mindful of these concerns and ensure that the use of AI in customer journey mapping aligns with ethical guidelines and regulations.
Lack of Human Touch
While AI can provide efficiency and automation, it may lack the human touch that some customers value. The absence of genuine human interaction can make customers feel disconnected or undervalued, potentially negatively impacting the customer journey. Striking the right balance between automation and human interaction is crucial.
Loss of Context
AI may struggle to capture the nuanced context of customer interactions, particularly when dealing with unstructured data. The human touch is often required to interpret the subtleties, emotions, and non-verbal cues that can profoundly impact the customer journey. AI may miss these critical elements, potentially leading to incomplete or inaccurate journey maps.
Initial Learning Curve
Incorporating AI into the research process can be challenging, especially for researchers who are not familiar with AI technologies. Learning to use AI tools effectively and integrating them into existing workflows can take time and effort. Additionally, AI algorithms need to be given time to “learn,” so results and efficiencies are not instantaneous.
Initial Implementation Challenges
Incorporating AI into customer journey mapping can be challenging, especially during the initial stages. It requires an investment in technology, training, and data infrastructure. CX professionals may encounter resistance from employees who fear job displacement due to automation. A well-thought-out implementation plan and change management strategy are essential to address these challenges.
Dependence on Quality Data
AI is only as good as the data it is trained on. If the input data is biased, incomplete, or inaccurate, the AI's output may be similarly flawed. CX researchers need to ensure that the data they feed into AI systems is of high quality to avoid misinformed decisions based on misleading insights.
Overreliance on AI
While AI can provide valuable insights, CX professionals should be cautious not to over-rely on AI-generated data and recommendations. Combining AI-driven insights with human expertise is essential to make informed decisions. For example, our customer journey management solution JourneyTrack incorporates AI-generated recommendations if requested by users, but users can determine the temperature - meaning how “creative” the generated ideas are, and they ultimately decide whether or not those recommendations and accompanying actions are included in the future state journey map. AI can provide valuable information, but it cannot replace the critical thinking and creativity of CX professionals.
Impact on Customer Journey Management
The incorporation of AI into customer journey mapping has a significant impact on customer journey management. It can lead to more efficient, data-driven, and personalized customer experiences, ultimately resulting in higher customer satisfaction, loyalty, and increased revenue. However, it also introduces challenges related to data privacy, human touch, and initial implementation hurdles.
CX professionals must carefully navigate these pros and cons, ensuring that AI complements their efforts rather than replaces them. An effective approach involves integrating AI as a tool to enhance the customer journey, harnessing its strengths while preserving the human touch and maintaining the highest standards of data security.
In conclusion, AI has the potential to revolutionize customer journey mapping and management, and tools like JourneyTrack can help. For CX professionals, the key lies in harnessing the power of AI while understanding and addressing its limitations, thereby delivering superior customer experiences and staying ahead in the competitive world of customer experience management. For more insights, check out our white paper on the topic .
Never miss an update. Become an Insider today.
Leave a Comment
Related posts, data-driven customer insights: how to leverage data to enhance customer journey management, navigating the future: 2024 trends in customer journey management, evaluating the roi of customer journey management platforms.
- Get started Get started for free
Figma design
Design and prototype in one place

Collaborate with a digital whiteboard

Translate designs into code
Get the desktop, mobile, and font installer apps
See the latest features and releases
- Prototyping
- Design systems
- Wireframing
- Online whiteboard
- Team meetings
- Strategic planning
- Brainstorming
- Diagramming
- Product development
- Web development
- Design handoff
- Product managers
Organizations
Config 2024
Register to attend in person or online — June 26–27

Creator fund
Build and sell what you love
User groups
Join a local Friends of Figma group
Learn best practices at virtual events
Customer stories
Read about leading product teams
Stories about bringing new ideas to life

Get started
- Developer docs
- Best practices
- Reports & insights
- Resource library
- Color Wheel
- Help center
How to create an effective user journey map

No matter what you’re working on, the key to customer satisfaction and business growth is understanding your users. A user journey map helps you uncover pain points, explore the touchpoints from their perspective, and learn how to improve your product.
Imagine you just launched a new ecommerce platform. Shoppers fill their carts with products, but they abandon their carts before checkout. With a user journey map, you can pinpoint where the customer experience is going wrong, and how to enable more successful checkouts.
Read on to find out:
- What is a user journey map, and how it captures user flows and customer touchpoints
- Benefits of user journey mapping to refine UX design and reach business goals
- How to make user journey maps in five steps, using FigJam’s user journey map template
What is a user journey map?
Think about the path a user takes to explore your product or website. How would you design the best way to get there? User journey maps (or user experience maps) help team members and stakeholders align on user needs throughout the design process, starting with user research. As you trace users' steps through your user flows, notice: Where do users get lost, backtrack, or drop off?
User journey maps help you flag pain points and churn, so your team can see where the user experience may be confusing or frustrating for your audience. Then you can use your map to identify key customer touchpoints and find opportunities for optimization.
How to read a user journey map
Most user journey maps are flowcharts or grids showing the user experience from end to end. Consider this real-life journey map example of a freelancing app from Figma's design community. The journey starts with a buyer persona needing freelance services, and a freelancer looking for a gig. Ideally, the journey ends with service delivery and payment—but customer pain points could interrupt the flow.
Start your user journey map with FigJam
5 key user journey map phases.
Take a look at another Figma community user journey template , which uses a simple grid. Columns capture the five key stages of the user journey: awareness, consideration, decision, purchase, and retention (see below). Rows show customer experiences across these stages—their thoughts, feelings, and pain points. These experiences are rated as good, neutral, and bad.
To see how this works, consider a practical example. Suppose a new pet parent wants to learn how to train their puppy and discovers your dog-training app. Here's how you might map out the five key user journey stages:
- Awareness. The user sees a puppy-training video on social media with a link to your product website. They're intrigued—a positive experience.
- Consideration. The user visits your product website to preview your app. If they can't find a video preview easily, this could be a neutral or negative experience.
- Decision. The user clicks on a link to the app store and reads reviews of your app and compares it to others. They might think your app reviews are good, but your price is high—a negative or neutral experience.
- Purchase. The user buys your app and completes the onboarding process. If this process is smooth, it's a positive experience. If not, the customer experience could turn negative at this point.
- Retention. The user receives follow-up emails featuring premium puppy-training services or special offers. Depending on their perception of these emails, the experience can range from good (helpful support) to bad (too much spam).
2 types of user journey maps—and when to use them
User journey maps are helpful across the product design and development process, especially at two crucial moments: during product development and for UX troubleshooting. These scenarios call for different user journey maps: current-state and future-state.
Current-state user journey maps
A current-state user journey map shows existing customer interactions with your product. It gives you a snapshot of what's happening, and pinpoints how to enhance the user experience.
Take the puppy training app, for example. A current-state customer journey map might reveal that users are abandoning their shopping carts before making in-app purchases. Look at it from your customers' point of view: Maybe they aren't convinced their credit cards will be secure or the shipping address workflow takes too long. These pain points show where you might tweak functionality to boost user experience and build customer loyalty.
Future-state user journey maps
A future-state user journey map is like a vision board : it shows the ideal customer journey, supported by exceptional customer experiences. Sketch out your best guesses about user behavior on an ideal journey, then put them to the test with usability testing. Once you've identified your north star, you can explore new product or site features that will optimize user experience.
How to make a user journey map in 5 steps
To start user journey mapping, follow this step-by-step guide.
Step 1: Define user personas and goals.
Gather user research and data like demographics, psychographics, and shopping behavior to create detailed customer personas representing your target audience. In your dog-training app example, one key demographic may be parents. What’s their goal? It isn't necessarily "hire a puppy trainer"—it could be "teach kids how to interact with a puppy."
Step 2: Identify customer touch points.
Locate the points along the user journey where the user encounters or interacts with your product. In the dog training app example, touchpoints might include social media videos, app website, app store category search (e.g., pets), app reviews, app store checkout, in-app onboarding, and app customer support.
Step 3: Visualize journey phases.
Create a visual representation of user journey phases across key touchpoints with user flow diagrams , flowcharts , or storyboards .
Step 4: Capture user actions and responses.
For each journey stage, capture the user story: at this juncture, what are they doing, thinking, and feeling ? This could be simple, such as: "Potential customer feels frustrated when the product image takes too long to load."
Step 5: Validate and iterate.
Finally, show your map to real users. Get honest feedback about what works and what doesn’t with user testing , website metrics , or surveys . To use the dog-training app example, you might ask users: Are they interested in subscribing to premium how-to video content by a professional dog trainer? Apply user feedback to refine your map and ensure it reflects customer needs.
Jumpstart your user journey map with FigJam
Lead your team's user journey mapping effort with FigJam, the online collaborative whiteboard for brainstorming, designing, and idea-sharing. Choose a user journey map template from Figma's design community as your guide. With Figma's drag-and-drop design features, you can quickly produce your own professional, presentation-ready user journey map.
Pro tip: Use a service blueprint template to capture behind-the-scenes processes that support the user journey, bridging the gap between user experience and service delivery.
Ready to improve UX with user journey mapping?
An Ultime Guide to User Journey Mapping

Craig Douglas
- March 28, 2024
TABLE OF CONTENT
Share this post.
User journey mapping is a powerful tool that helps businesses understand and improve the customer experience. By visually representing the customer journey, companies can identify key interactions, or touchpoints, where customers engage with their brand. This process involves detailed user research to gather insights into customer behavior, preferences, and challenges. Customer journey mapping aims to pinpoint pain points—areas where customers may encounter frustration or obstacles. By recognizing these pain points, businesses can work to enhance customer journeys, making them smoother and more enjoyable. This, in turn, can lead to increased customer satisfaction and loyalty. In this guide, we will delve into the essentials of customer journey mapping. Let’s get started!
What is a user journey map?
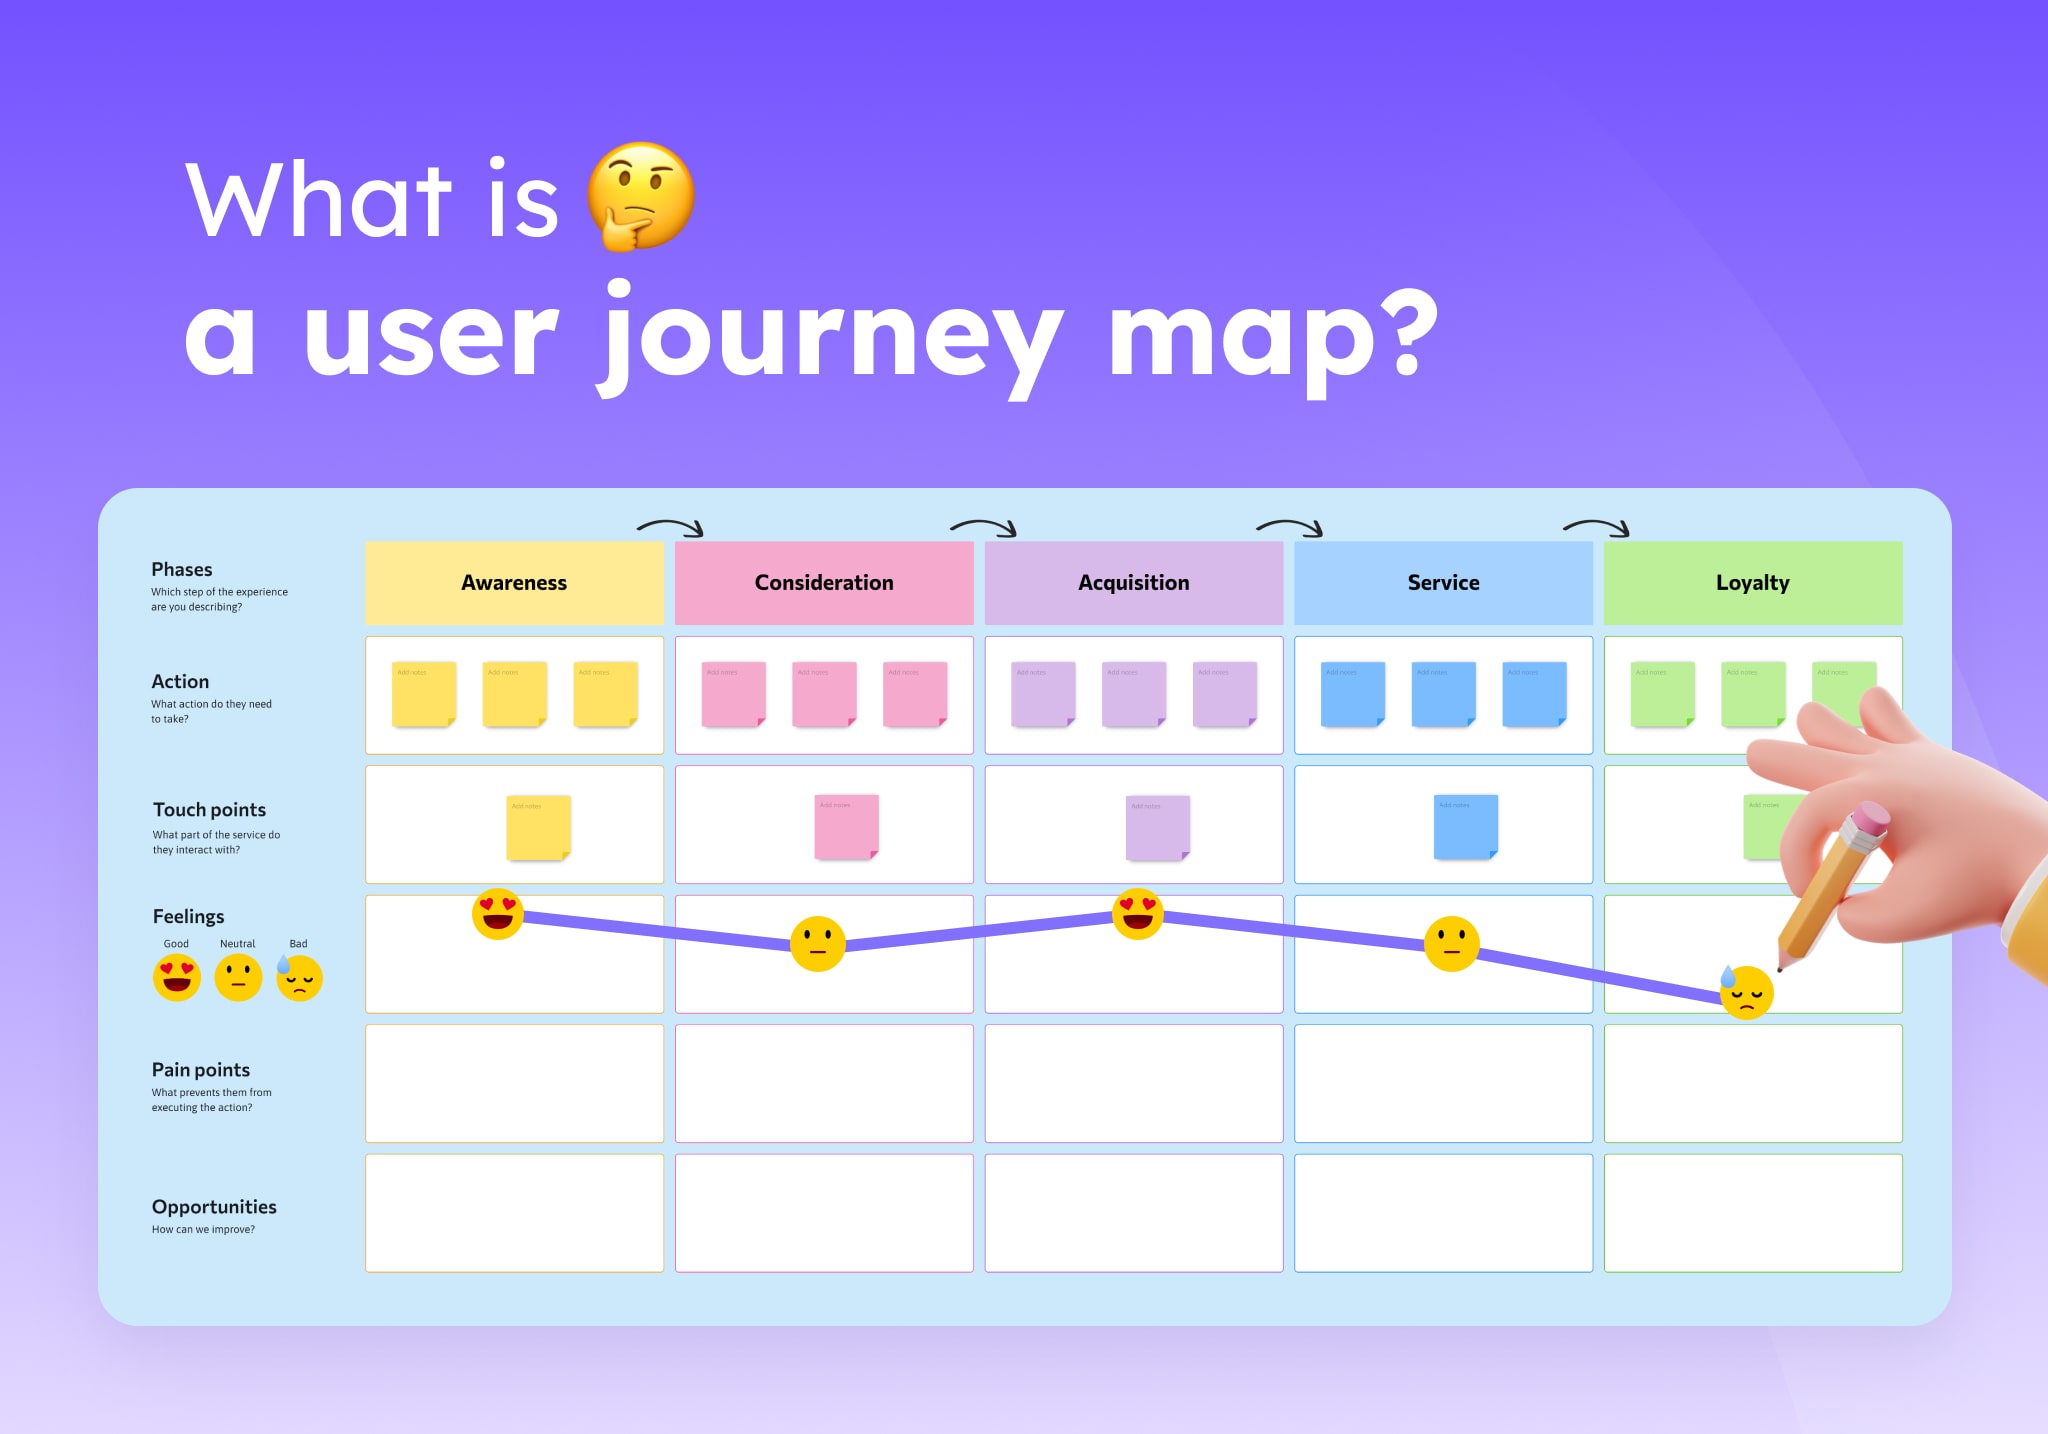
A user journey map is a visual representation of a customer’s experience as they interact with a product, brand, or service. It’s like a roadmap that shows the path of a customer’s experience with a brand, highlighting key touchpoints where they engage with the company’s services or products. These maps are not just simple charts; they are detailed and customer-focused, often created using customer journey map templates to ensure all relevant aspects are included. The process of creating a customer journey map starts with user research and customer interviews. This helps to understand the different stages and journey phases that customers go through. By mapping out these stages, businesses can identify customer pain points and areas where customers might feel frustrated or have a negative experience. Service blueprint maps can also be integrated into the journey map to provide an even deeper understanding of the service teams’ roles in the customer journey. User personas, which represent the different types of customers, are used to tailor the map to specific customer needs and expectations. This ensures that the journey map is relevant to the actual users. UX journey mapping, a subset of customer journey mapping, focuses on digital interactions and user behavior online. Businesses can make informed decisions to improve customer retention, loyalty, and overall success by analyzing the customer’s journey. Whether it’s a physical store or an online platform, a well-crafted customer journey map is a strategic asset in enhancing the customer base’s experience.
Why Create User Journey Maps?
Now, let’s explore the reasons why creating user journey maps is a beneficial practice for businesses aiming to understand and serve their customers better.
Understanding the Digital Customer Experience
In the digital world, a customer journey map provides a clear picture of how customers interact with a product or service online. It lays out the sequence of digital touchpoints and actions that customers take as they aim to fulfill a need or complete a task. Creating user journey maps allows businesses to step into their customers’ shoes and see their products from the user’s perspective, leading to a more empathetic approach to design and service.

Identifying Pain Points and Opportunities
One of the main reasons to create a customer journey map is to identify pain points within the digital experience. These are moments where a user might feel confused, frustrated, or dissatisfied. By pinpointing these areas, a business can focus on making improvements that will have the most significant impact on customer satisfaction and loyalty. Additionally, journey mapping can reveal opportunities to enhance the user experience or introduce new features that meet customer needs.
Improving Customer Success and Retention
A well-designed user journey map helps businesses understand and streamline the journey stages, leading to improved customer success. When users can navigate a digital product with ease and achieve their goals without unnecessary friction, they are more likely to continue using the product and recommend it to others. This can increase customer retention and turn users into advocates for the brand.
Tailoring Experiences with Customer Personas
Customer personas are characters that represent different segments of a business’s customer base. By using personas in journey mapping, companies can create multiple journey maps that cater to the unique needs and expectations of various user groups. This tailored approach ensures that the digital product resonates with a broader audience and meets the diverse requirements of prospective customers.
Planning for the Future with Service Blueprints
Service blueprints are detailed plans that outline the processes and systems needed to deliver a digital product or service. When combined with user journey maps, they provide a comprehensive view of both the customer’s experience and the internal operations that support it. This dual perspective is crucial for planning future enhancements and ensuring that the team has the resources and internal ownership necessary to implement changes effectively.
Collaborating and Communicating Across Teams
Journey mapping is a collaborative initiative that brings together team members from different departments. By visualizing the user’s journey, everyone from designers to service teams can understand their role in shaping the customer experience. This shared understanding fosters better communication and collaboration, leading to a more cohesive and customer-focused approach to product development. Creating user journey maps is a strategic step for any business with a digital product. It provides a deliberate and brief description of the user’s emotional state, actions, and interactions with the product. By using journey maps, businesses can ensure that their digital offerings are not only functional but also enjoyable, leading to a loyal customer base that continues to grow.
What are the Elements of a User Journey Map?
To effectively create a user journey map for a digital product, it’s essential to understand the core elements that make up this strategic tool. Each element plays a crucial role in providing a comprehensive view of the customer’s interaction with the product. Let’s explore these elements in detail.
A persona represents a segment of your user base. It’s a detailed character sketch of an ideal user, based on real data and user research. Personas help you understand who you are designing for and what their specific needs, goals, and behaviors are. When crafting a user journey map, start by selecting a persona to focus on, whether they are current users or a target audience you wish to attract. This will guide the entire mapping process, ensuring that the insights are relevant and actionable.
The scenario outlines the specific interaction or experience you are mapping. It could be a real user interaction that has been observed or an anticipated one that you expect to occur in the future. Scenarios help to set the context for the journey map, defining what the user is trying to achieve and why. For a digital product, scenarios might include signing up for a service, making a purchase, or seeking customer support.
Stages of the Journey
The journey is broken down into high-level phases or stages, which represent the major steps the user goes through in the scenario. These stages might include discovery, consideration, decision, and post-purchase or retention. Each stage is a milestone in the user’s journey with your digital product, and understanding these can help you design a more intuitive and user-friendly experience.
User Actions
Within each stage, identify the specific actions that the user can take. This could be anything from clicking a button, filling out a form, or navigating through different pages of your website or app. By mapping out these actions, you can pinpoint where users might encounter difficulties or where the flow can be optimized for better efficiency.
User Emotions and Thoughts
As users interact with your digital product, they experience a range of emotions and thoughts. Mapping these out can provide valuable insights into the user’s emotional state at each stage of the journey. It helps to identify moments of frustration, confusion, or satisfaction, which can inform how you design the user interface and overall experience.
Opportunities
Opportunities are areas where you can improve the user experience (UX) of your product or create a more effective connection with your customer. By analyzing the journey map, you can uncover gaps in the user experience or features that could be added to meet user needs better. These opportunities are the key to innovating and staying ahead of the competition.
Internal Ownership
Finally, it’s important to assign internal ownership for each part of the journey. This means identifying which team or team member will be responsible for implementing changes and improvements based on the journey map. Having clear ownership ensures that insights from the journey mapping initiative are acted upon, leading to tangible improvements in the customer experience.
How to Create a User Journey Map with Visily
Creating a user journey map is a strategic step in understanding and improving the customer experience with your digital product. Visily is a tool that can help streamline this process. Here’s how you can use Visily to create your own user journey map:
- Sign up for Visily and create your project.
- Once you’re in your project, you can start designing from scratch using Visily’s blank canvas. This gives you the freedom to structure the user journey map exactly how you want it.
- If you prefer to work with a guide, Visily offers a library of templates. These templates are pre-designed maps that you can choose from, saving you time and providing inspiration for your map.
- Whether you’re starting with a blank canvas or a template, you can customize your map using Visily’s smart components and sticky notes. Visily allows you to add details, such as different stages of the journey, and user actions, in an organized and visually appealing way.
After your user journey map is complete, sharing it with team members or stakeholders is easy. Visily allows you to share your map directly from the platform, facilitating collaboration and feedback.
User journey mapping is a crucial step toward enhancing the digital customer experience. It allows businesses to visualize and understand the customer’s path, identify pain points, and uncover opportunities for improvement. By incorporating personas, scenarios, stages, actions, emotions, and internal ownership, journey maps become a blueprint for customer-focused innovation. Visily is an excellent tool for creating user journey maps, offering a user-friendly platform with templates and smart components. Beyond journey mapping, Visily also supports wireframing and prototyping, making it a versatile choice for designing digital products. By using Visily, teams can collaborate effectively, ensuring that every member contributes to a seamless user experience. For businesses looking to improve their digital offerings, Visily is the right place to start. Try Visily today, and take the first step in crafting a digital experience that delights your customers and sets your brand apart.
Visily— AI-Powered Wireframing & Design
Related Articles
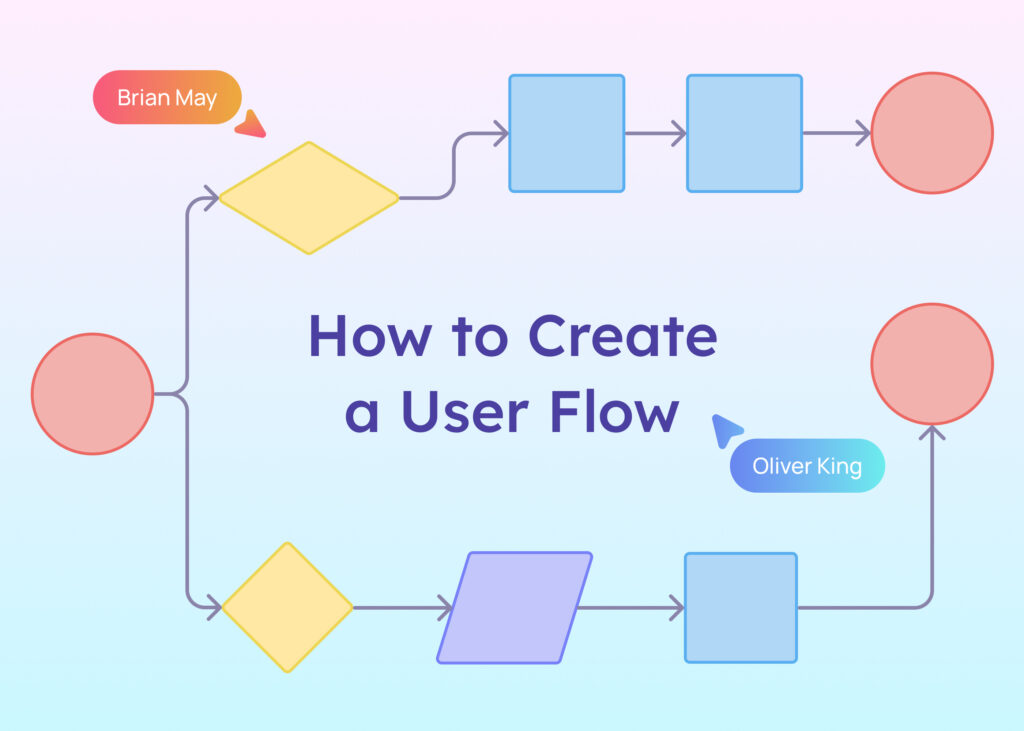
How to Create a User Flow

How To Learn UX Design (A Guide for Beginners)

15 Fundamental UX Design Principles All Designers Should Know

Why is UX Design Important?
![What is a UX Design Strategy? [+ 5 Steps to Make One] What is a UX Design Strategy_ [+ 5 Steps to Make One]](https://www.visily.ai/wp-content/uploads/2024/01/What-is-a-UX-Design-Strategy_-5-Steps-to-Make-One-1024x731.jpg)
What is a UX Design Strategy? [+ 5 Steps to Make One]
Subscribe to Visily now
Don’t miss out on the latest articles to stay a top of UX design and Product management
Thank you for subscribing! You'll be kept updated with our monthly newsletter. Stay tuned!
Hey 👋, check us out
- Wireframing
- Prototyping
- Collaboration
- Brainstorming
- Built-in Templates
- Hi-fidelity Mockups
- Components Library
More about us
- Help Center
- Explore Visily
- Release Notes
- Pressing Room
- Careers Join us!
- Privacy Policy
- Terms Of Service
© 2024 Visily. All rights reserved.
© 2024 Visily, Inc. All rights reserved.

- AI Templates
- Get a demo Sign up for free Log in Log in
How to Use Journey Maps for Ideation

15 Minute Read

When do you use journey maps?
Journey maps are a great way to externalize and communicate the user's behavior and underlying motivation, and as a tool to humanize them. Journey maps help create empathy in teams to ideate against.
A journey map is useful at many stages during the design process to illustrate complicated ideas and processes in a simple, visual way.
- During research, a journey map can be created to represent the existing user experience and identify gaps, unnecessary complexity, and opportunities to simplify.
- During solution definition, a journey map can be a great way to illustrate the new and improved end-to-end experience.
What do you include on a journey map?
Character, setting, and plot.
When creating a journey map, start with information about the persona or user type you are putting through the journey, as well as a scenario to create context.
A good scenario for a journey map occurs over a period of time and includes:
- A realistic setting for people when they're engaging with your product/service.
- A situation that includes multiple touch points with people and technology relating to your product/service.
- A storytelling arc to either highlight a problem or showcase a solution.
Some questions your scenario should answer:
- How does it start?
- What's the rising action?
- What's the peak moment?
- What's the conflict?
- How does it resolve?
Head, Heart, Hand
For each step along the way in the scenario, consider vividly how your persona would respond. Incorporate the information gained from user research during this exercise, using even direct quotes and observations that fit the persona type you are mapping out.
The emphasis along the way should be focused on the human experience rather than the technology.
- Head : What are they thinking?
- Heart : How are they feeling?
- Hand : What are they doing?
Through this, we are representing the interconnectivity between a persons actions, thoughts, and external factors. Our information is making the leap to becoming applied knowledge.
Insights & Recommendations
Summarize the highs and lows in the persona's experience, potentially even probing at why you think they occurred. Offer insights and recommendations to make this summary actionable and thought provoking.
How much detail should a journey map have?
As the designer and person telling the user's story, it's up to you how much you want to zoom in or out. What's the ideal amount of detail needed for the goals of your project? You can choose to zoom in and be very focused and nuanced on this person's experience, or zoom out to provide high level context.
How do you use a journey map?
Now that you've created a journey map, don't let it collect dust in a repository somewhere. Print it out, and hang it up. Pin them in your slack channel. Keep them accessible for reference on a page in your design file.
Using research artifacts like Journey Maps are often a big sticking point for teams. Here are some exercises to get you unstuck:
Exercise 1: Opportunities to go after
Focus in on a high point in the journey map (or across several journey maps) and ask:
- How could we bring it higher in the experience?
- How might we bring it forward in the experience?
Exercise 02: Problems to solve for
Focus in on a low point in the journey map (or across several journey maps) and ask:
- How could it have been avoided altogether?
- How might we help them recover, faster?
Exercise 03: Greatest gifts & threats
Reflect on the journey maps and ask the team to create hypotheses that resolve the following questions:
- What would be the greatest gift to this persona during this experience? Then ideate around ways to give them those gifts.
- What is the greatest threat to this persona's experience? Then ideate around ways to keep this threat at bay.

Create your own AI-powered templates for better, faster research synthesis. Discover new customer insights from data instantly.

The top 10 things Notably shipped in 2023 and themes for 2024.

Introducing Notably + Miro Integration: 3 Tips to Analyze Miro Boards with AI in Notably

5 Steps to turn data into insights with Notably
Give your research synthesis superpowers..
Try Teams for 7 days
Free for 1 project

The Role of Customer Journey Mapping in Conversational AI

Table of Contents
What are Customer Journey Maps?
Customer journey maps are a visualization method to investigate user experiences. They consist of user personas, user flows, and scenarios based on qualitative and quantitative data. This data can help stakeholders and Conversation Design specialists develop empathy for the virtual assistant’s end users.
The practice of mapping creates a deep insight into the industry, brand, competitors, services, products, and users. These dynamic documents need to be updated regularly by engaging stakeholders across the entire enterprise to provide many perspectives. The act of journey mapping demands a shift from multichannel to omnichannel in order for customers to move freely.
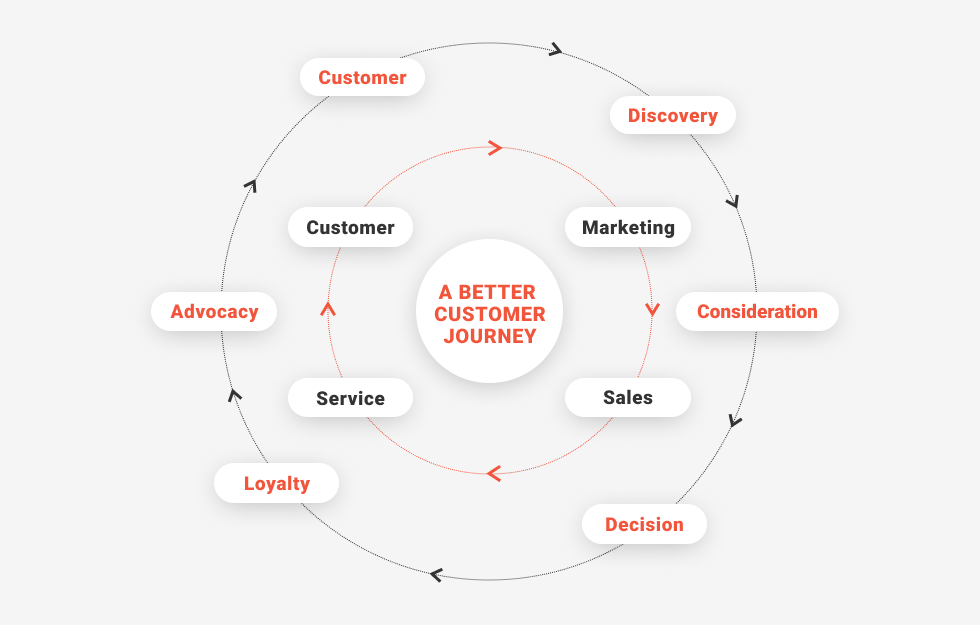
By leveraging these journey maps organizations can understand how customers interact with various touchpoints within their customer-facing channels, from websites to apps to conversational solutions. With better understanding comes opportunities to further optimize lead generation, sales funnels, increased revenue, and customer satisfaction. These documents become a prompt for designers to ensure that every step of a journey needs to flow in a natural, frictionless, and efficient way.
Tips to Utilize When Building Out a Customer Journey Map
The following list is our recommended steps conversation designers should follow when building out your customer journey map:
- Align on project goals before map development.
- Interview a large, diverse set of customers (not just the loyal ones) to understand goals, motivations, pain points, and all steps within the journey.
- Involve internal and external stakeholders to drive changes from journey map analysis and promote buy-in from management.
- The mapping process should result in a list of actionables to drive accountability.
- Leverage collaborative customer journey mapping platforms or templates to add your qualitative and quantitative data. We like UXpressia and Miro .
- Use a prioritization matrix to distribute your resources smartly; start with the most problematic steps in the journey to reduce friction.
- Focus on all stages of interaction (awareness, comparison, purchase, etc.)
- Add key performance indicators to ease the process of decision-making that will inform a conversation designer’s design.
- If optimizing an existing conversational solution, showcase chatbot analytics such as the Net Promoter Score and Customer Satisfaction Scores to identify opportunities for optimization at different stages of each journey.
- Regularly update the journey map with new data.
Also read: Multimodal Conversation Design Tutorial (Part 1): Overview and Key Elements
Example of a customer’s journey ordering a burrito for lunch using an SMS chatbot.
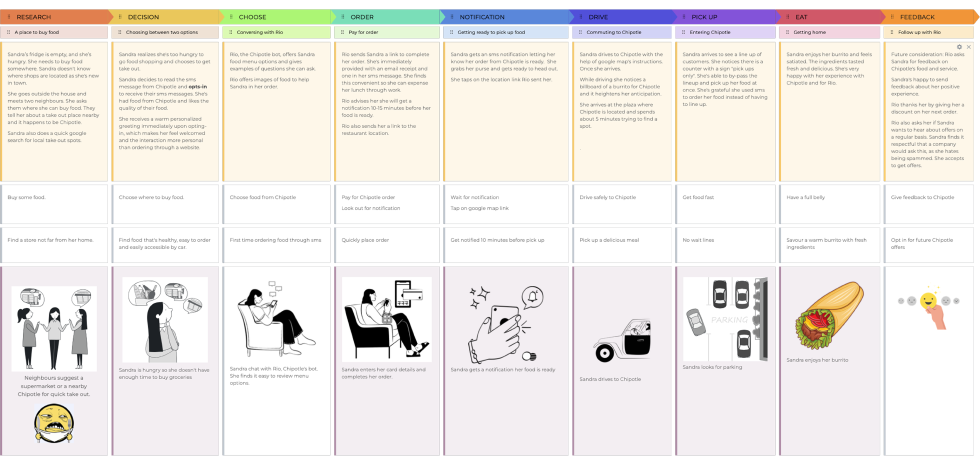
Personalization in Conversational AI
Journey maps also lend themselves well as artifacts used to identify areas for additional personalization in a user experience. Customer data can be captured at different points including personal details, product preferences, questions asked, shopping behavior, and contextual cues from conversations. Everything from utilizing a customer’s name, relaying previous order information, giving real-time updates about account information, or presenting content based on past purchases are all areas where personalization can be leveraged and identified in developing a journey map.
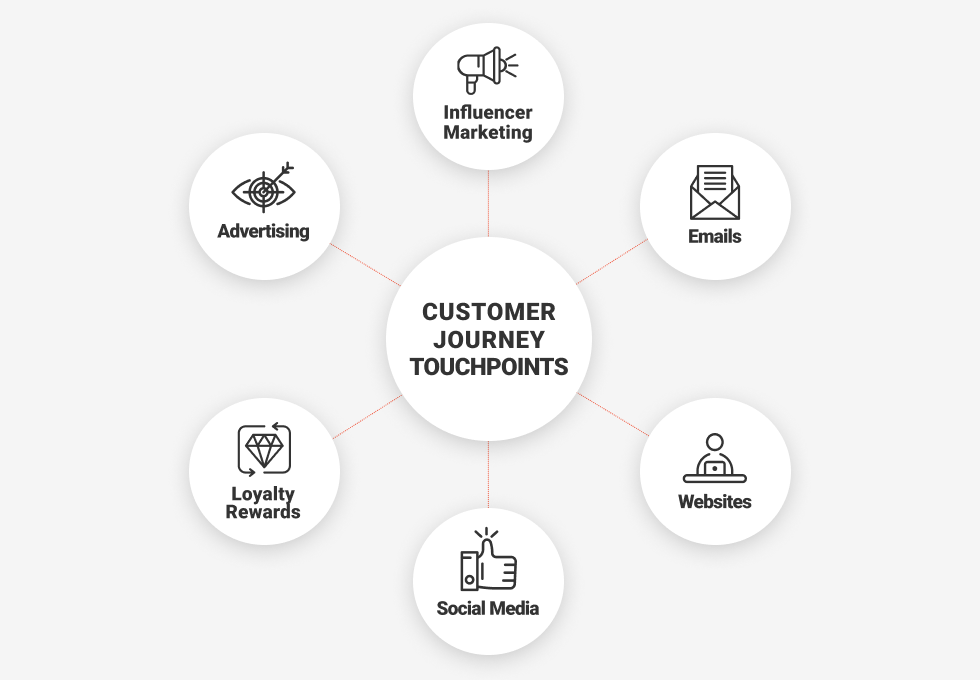
Leveraging Data in Conversational AI
Qualitative research such as user interviews, diary studies, and usability testing deepen understanding of users whereas quantitative research such as data found in analytics and dashboards can help understand customer behavior on existing channels that can be used to inform the design of virtual assistants. Where customers spend their time, on what product or service pages, along with points of dropoff or exits can all inform a journey map and then be used to prioritize use cases for conversational flows . Once a conversational solution is launched, journey mapping must be continued to highlight optimization opportunities.
Final Thoughts
Conversational solutions offer intelligent, personalized, asynchronous experiences that are continuing to gain traction and popularity by consumers. In order for businesses to successfully invest, design, and develop Conversational AI experiences , customer journey mapping must be part of the process. It is these artifacts that will ensure user needs are understood and their experiences are optimized and more efficient than how they interact with the brand today. Reach out to us about your project here .
Upload File Briefly describe your request Send me NDA
By continuing, you're agreeing to the Master of Code Terms of Use and Privacy Policy and Google’s Terms and Privacy Policy

We use cookies to improve your user experience on our site, personalize content and ads, and to analyze our traffic. These cookies are completely safe and secure and will never contain sensitive information. They are used only by Master of Code Global or the trusted partners we work with.
Skip navigation

World Leaders in Research-Based User Experience
Journey mapping 101.

December 9, 2018 2018-12-09
- Email article
- Share on LinkedIn
- Share on Twitter
Journey maps are a common UX tool. They come in all shapes, sizes, and formats. Depending on the context, they can be used in a variety of ways. This article covers the basics: what a journey map is (and is not), related terminology, common variations, and how we can use journey maps.
In This Article:
Definition of a journey map, key components of a journey map, journey-map variations, why use journey maps.
Definition: A journey map is a visualization of the process that a person goes through in order to accomplish a goal.
In its most basic form, journey mapping starts by compiling a series of user actions into a timeline. Next, the timeline is fleshed out with user thoughts and emotions in order to create a narrative. This narrative is condensed and polished, ultimately leading to a visualization.
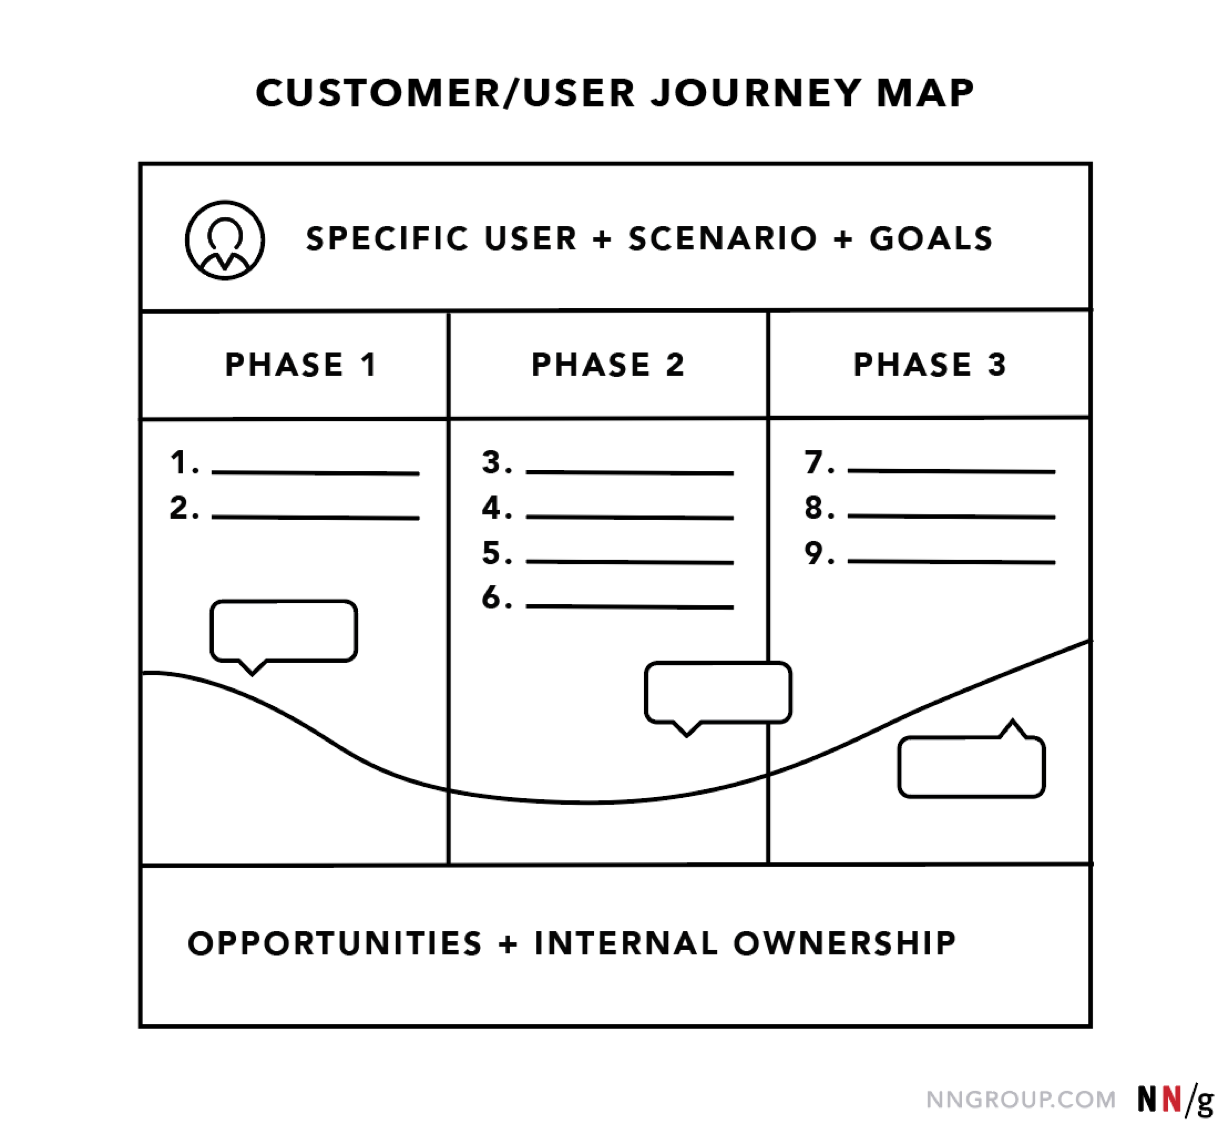
The terms ‘user journey map’ and ‘customer journey map’ can be used interchangeably. Both reference a visualization of a person using your product or service.
While the argument can be made that the term ‘customer’ does a disservice to the method (because, especially for certain business-to-business products, not all of end users are technically customers, i.e., product buyers), alignment on what you call the map is far less important than alignment on the content within the map.
Journey maps come in all shapes and sizes. Regardless of how they look, journey maps have the following 5 key elements in common:
Scenario + Expectations
Journey phases, actions, mindsets, and emotions, opportunities.
The actor is the persona or user who experiences the journey. The actor is who the journey map is about — a point of view. Actors usually align with personas and their actions in the map are rooted in data.
Provide one point of view per map in order to build a strong, clear narrative. For example, a university might choose either a student or a faculty member as actor — each would result in different journeys. (To capture both viewpoints, the university will need to build two separate maps, one for each of the two user types.)
The scenario describes the situation that the journey map addresses and is associated with an actor’s goal or need and specific expectations. For example, one scenario could be switching mobile plans to save money, and expectations for it include to easily find all the information needed to make a decision.
Scenarios can be real (for existing products and services) or anticipated — for products that are yet in the design stage.
Journey maps are best for scenarios that involve a sequence of events (such as shopping or taking a trip), describe a process (thus involve a set of transitions over time), or might involve multiple channels .
Journey phases are the different high-level stages in the journey. They provide organization for the rest of the information in the journey map (actions, thoughts, and emotions). The stages will vary from scenario to scenario; each organization will usually have data to help it determine what these phases are for a given scenario.
Here are some examples:
- For an ecommerce scenario (like buying Bluetooth speakers), the stages can be discover, try, buy, use, seek support.
- For big (or luxury) purchases (like buying a car), the stages can be engagement, education, research, evaluation, justification.
- For a business-to-business scenario (like rolling out an internal tool), the stages could be purchase, adoption, retention, expansion, advocacy.
These are behaviors, thoughts, and feelings the actor has throughout the journey and that are mapped within each of the journey phases.
Actions are the actual behaviors and steps taken by users. This component is not meant to be a granular step-by-step log of every discrete interaction. Rather, it is a narrative of the steps the actor takes during that phase.
Mindsets correspond to users’ thoughts, questions, motivations, and information needs at different stages in the journey. Ideally, these are customer verbatims from research.
Emotions are plotted as single line across the journey phases, literally signaling the emotional “ups” and “downs” of the experience. Think of this line as a contextual layer of emotion that tells us where the user is delighted versus frustrated.
Opportunities (along with additional context such as ownership and metrics) are insights gained from mapping; they speak to how the user experience can be optimized. Insights and opportunities help the team draw knowledge from the map:
- What needs to be done with this knowledge?
- Who owns what change?
- Where are the biggest opportunities?
- How are we going to measure improvements we implement?
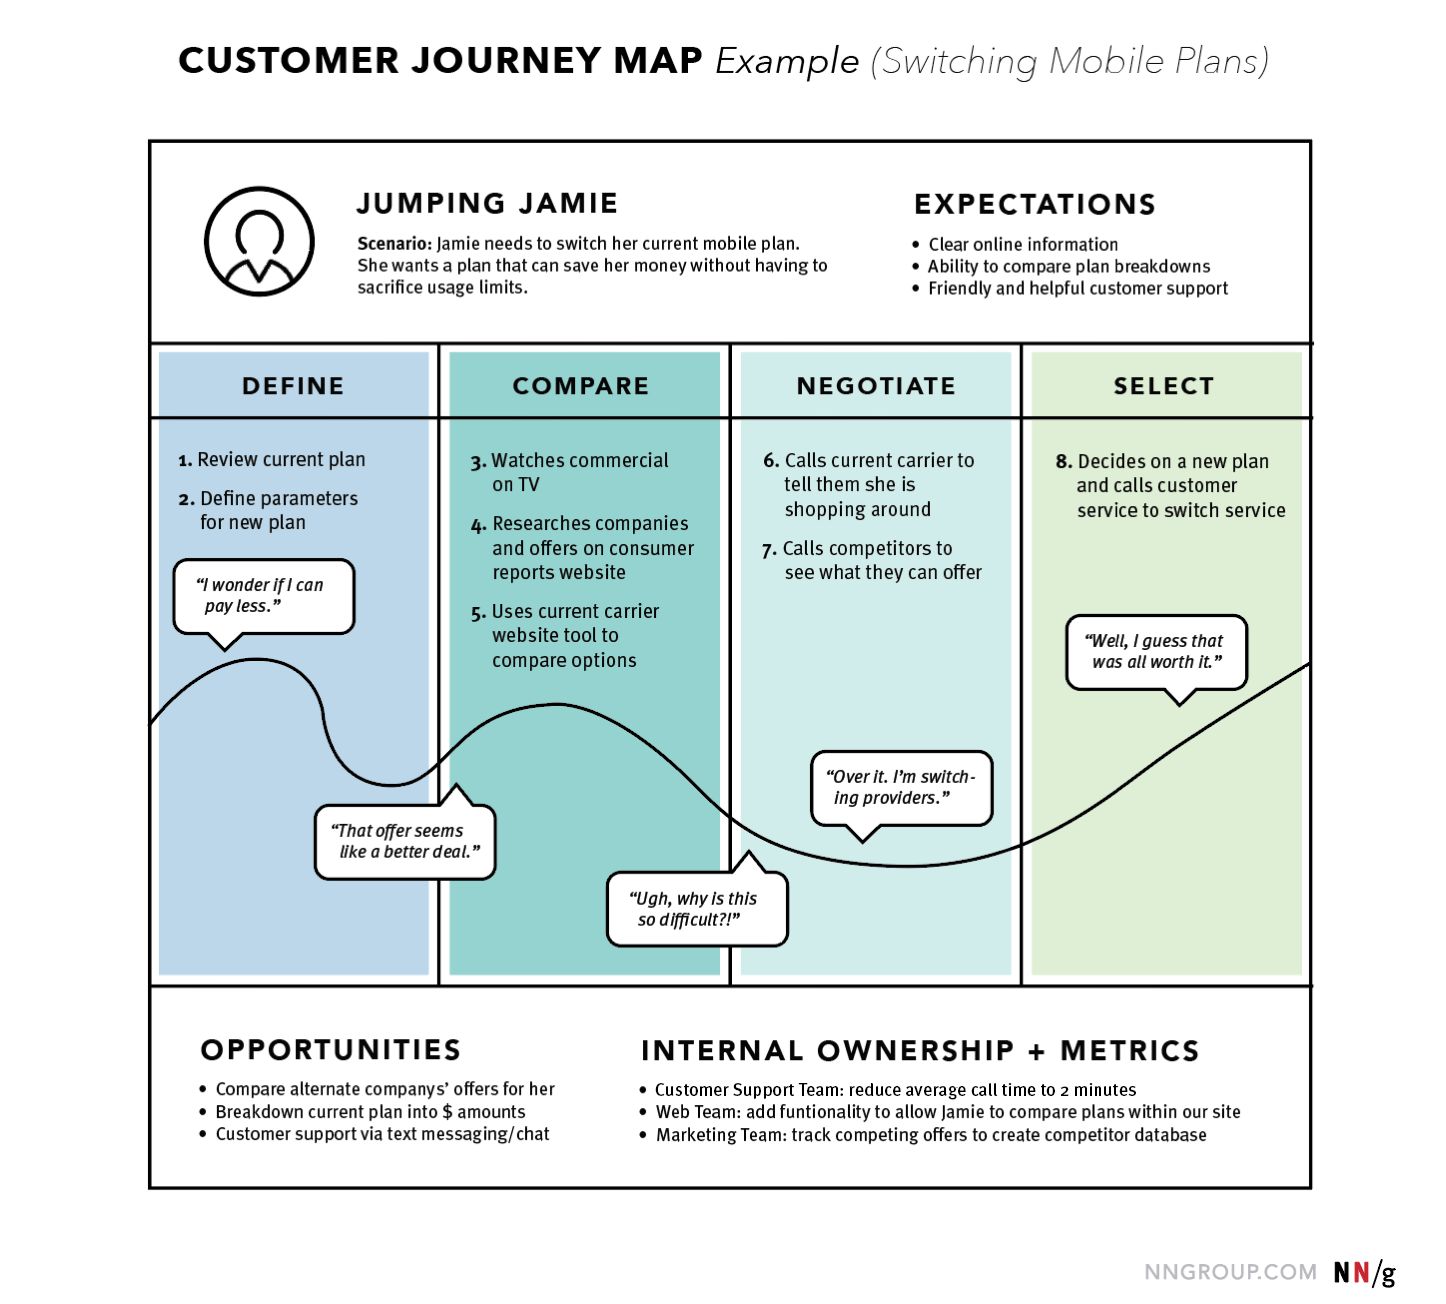
There are several concepts closely related and thus easily confused with journey maps.
It is important to note that this section is only meant to help your personal understanding and clarification of these terms. It is not advised to debate or attempt to shift a whole organization’s language to abide by the definitions stated here. Instead, use these definitions to guide you towards aspects of another method that your team has not previously considered.
Journey Map vs. Experience Map
Think of an experience map as a parent to a journey map. A journey map has a specific actor (a singular customer or user of a product) and specific scenario (of a product or service), while an experience map is broader on both accounts — a generic human undergoing a general human experience.
The experience map is agnostic of a specific business or product. It’s used for understanding a general human behavior; in contrast, a customer journey map is specific and focused on a particular business or product.
For example, imagine the world before the ridesharing market existed (Uber, Lyft, Bird, or Limebike, to name a few). If we were to create an experience map of how a person gets from one place to another, the map would likely include walking, biking, driving, riding with a friend, public transportation, or calling a taxi. Using that experience map we could then isolate pain points: unknown fares, bad weather, unpredictable timing, paying in cash, and so on. Using these pain points, we would then create a future journey map for specific product: how does a particular type of user call a car using the Lyft app?
Journey Map vs. Service Blueprint
If journey maps are the children to experience maps, then service blueprints are the grandchildren. They visualize the relationships between different service components (such as people or processes) at various touchpoints in a specific customer journey.
Think of service blueprints as a part two to customer journey maps. They are extensions of journey maps, but instead of being focused on the user (and taking the user’s viewpoint), they are focused on the business (and take its perspective).
For the Lyft scenario above, we would take the journey map and expand it with what Lyft does internally to support that customer journey. The blueprint could include matching the user to a driver, contacting the driver, calculating fares, and so on.
Journey Map vs. User Story Map
User stories are used in Agile to plan features or functionalities. Each feature is condensed down to a deliberately brief description from a user’s point of view; the description focuses on what the user wants to do, and how that feature will help. The typical format of a user story is a single sentence: “As a [type of user], I want to [goal], so that [benefit].” For example, “As a checking account holder, I want to deposit checks with my mobile device, so that I don’t have to go to the bank.”
A user story map is a visual version of a user story. For example, take the user story above (“As a checking account holder, I want to deposit checks with my mobile device, so that I don’t have to go to the bank.”) and imagine writing out the different steps that the team plans for the user to take when using that functionality. These steps could be: logging in, beginning deposit, taking picture of check, and entering transaction details. For each step, we can document required features: enabling camera access, scanning check and auto filling numbers, and authorizing signature. In a user story map, these features are written on sticky notes, then arranged based on the product release that each functionality will be added to.
While, at a glance, a user story map may look like a journey map, journey maps are meant for discovery and understanding (think big picture), while user story maps are for planning and implementation (think little picture).
Although a journey map and user story map may contain some of the same pieces, they are used at different points of the process. For example, imagine our journey map for Lyft indicated that a pain point appeared when the user was in a large group. To address it, the team may introduce a multicar-call option. We could create a user story map to break this feature (multicar call) into smaller pieces, so a product-development team could plan release cycles and corresponding tasks.
The benefits of journey maps (and most other UX mappings ) are two-fold. First, the process of creating a map forces conversation and an aligned mental model for the whole team. Fragmented understanding is a widespread problem in organizations because success metrics are siloed; it is no one’s responsibility to look at the entire experience from the user’s standpoint. This shared vision is a critical goal of journey mapping, because, without it, agreement on how to improve customer experience would never take place.
Second, the shared artifact resulting from the mapping can be used to communicate an understanding of your user or service to all involved. Journey maps are effective mechanisms for conveying information in a way that is memorable, concise, and that creates a shared vision. The maps can also become the basis for decision making as the team moves forward.
Journey mapping is a process that provides a holistic view of the customer experience by uncovering moments of both frustration and delight throughout a series of interactions. Done successfully, it reveals opportunities to address customers’ pain points, alleviate fragmentation, and, ultimately, create a better experience for your users.
Additional articles are available, discussing:
- When to create customer journey maps
- The 5-step process
- Journey mapping in real life
Free Downloads
Related courses, journey mapping to understand customer needs.
Capture and communicate UX insights across complex interactions
Omnichannel Journeys and Customer Experience
Create a usable and cohesive cross-channel experience by following guidelines to resolve common user pain points in a multi-channel landscape
Interaction
Generating Big Ideas with Design Thinking
Unearthing user pain points to drive breakthrough design concepts
Related Topics
- Customer Journeys Customer Journeys
- Design Process
Learn More:
Please accept marketing cookies to view the embedded video. https://www.youtube.com/watch?v=2W13ext26kQ
Customer Journey Mapping 101

The 3 Competencies of Journey Management
Kim Salazar · 5 min

Journey Mapping: 2 Decisions to Make Before You Begin
Kate Kaplan · 3 min

Scenario Mapping for Design Exploration
Kim Salazar · 3 min
Related Articles:
The 5 Steps of Successful Customer Journey Mapping
Kate Kaplan · 6 min
Parking Lots in UX Meetings and Workshops
Sarah Gibbons · 5 min
When and How to Create Customer Journey Maps
User Experience vs. Customer Experience: What’s The Difference?
Journey Mapping: 9 Frequently Asked Questions
Alita Joyce and Kate Kaplan · 7 min
Luxury Shopping User Groups and Journeys
Kate Moran · 14 min
Thank you for visiting nature.com. You are using a browser version with limited support for CSS. To obtain the best experience, we recommend you use a more up to date browser (or turn off compatibility mode in Internet Explorer). In the meantime, to ensure continued support, we are displaying the site without styles and JavaScript.
- View all journals
- My Account Login
- Explore content
- About the journal
- Publish with us
- Sign up for alerts
- Open access
- Published: 09 April 2024
The algorithm journey map: a tangible approach to implementing AI solutions in healthcare
- William Boag 1 na1 ,
- Alifia Hasan ORCID: orcid.org/0009-0000-1361-3744 1 na1 ,
- Jee Young Kim ORCID: orcid.org/0000-0003-4850-9757 1 ,
- Mike Revoir 1 ,
- Marshall Nichols ORCID: orcid.org/0000-0002-0969-1982 1 ,
- William Ratliff ORCID: orcid.org/0000-0003-4015-3805 1 ,
- Michael Gao 1 ,
- Shira Zilberstein ORCID: orcid.org/0000-0001-7564-727X 1 , 2 ,
- Zainab Samad 3 ,
- Zahra Hoodbhoy 3 ,
- Mushyada Ali 3 ,
- Nida Saddaf Khan 3 ,
- Manesh Patel 4 ,
- Suresh Balu ORCID: orcid.org/0000-0003-4929-9130 1 &
- Mark Sendak ORCID: orcid.org/0000-0001-5828-4497 1
npj Digital Medicine volume 7 , Article number: 87 ( 2024 ) Cite this article
4662 Accesses
20 Altmetric
Metrics details
- Health care
- Translational research
When integrating AI tools in healthcare settings, complex interactions between technologies and primary users are not always fully understood or visible. This deficient and ambiguous understanding hampers attempts by healthcare organizations to adopt AI/ML, and it also creates new challenges for researchers to identify opportunities for simplifying adoption and developing best practices for the use of AI-based solutions. Our study fills this gap by documenting the process of designing, building, and maintaining an AI solution called SepsisWatch at Duke University Health System. We conducted 20 interviews with the team of engineers and scientists that led the multi-year effort to build the tool, integrate it into practice, and maintain the solution. This “Algorithm Journey Map” enumerates all social and technical activities throughout the AI solution’s procurement, development, integration, and full lifecycle management. In addition to mapping the “who?” and “what?” of the adoption of the AI tool, we also show several ‘lessons learned’ throughout the algorithm journey maps including modeling assumptions, stakeholder inclusion, and organizational structure. In doing so, we identify generalizable insights about how to recognize and navigate barriers to AI/ML adoption in healthcare settings. We expect that this effort will further the development of best practices for operationalizing and sustaining ethical principles—in algorithmic systems.
Leverage zones in Responsible AI: towards a systems thinking conceptualization
Artificial intelligence for strengthening healthcare systems in low- and middle-income countries: a systematic scoping review

Autonomous AI systems in the face of liability, regulations and costs
Introduction.
In the realm of healthcare and artificial intelligence, there is an abundance of conversations happening at the abstract level. We frequently discuss the potential 1 , policies 2 , and best practices of AI in a somewhat detached, hypothetical manner. While these discussions are important for shaping the future of healthcare, they often lack the crucial element of real-world grounding 3 . Meanwhile, the number of projects that reach the “clinical integration” stage has been growing; a survey of 95 randomized controlled trials (RCTs) of AI software found mixed results of their clinical impact 4 . Several works have provided high-level summaries about how to build ML models in healthcare, with particular emphasis on initial considerations for deployment 5 , ethical implications and considerations for regulation 6 , post-deployment evaluation criteria for projects 7 , legal and governance guidance 8 . As these case studies have developed, researchers have begun identifying “lessons learned” to help increase the adoption of AI software in health systems, including: how to conduct a silent trial 9 , reliability and fairness audits 10 , clinical workflow 11 , and change management and outcome monitoring 12 .
Moreover, when considering the adoption of new technologies in healthcare, historical examples remind us of the significance of moving beyond theoretical discussions. For instance, during the introduction of electronic health records (EHR), the benefits (e.g., flagging issues in medication orders) were carefully weighed against the hypothetical concern of alarm fatigue. However, it was only through the examination of specific case studies that unforeseen, complex scenarios came to light. A notable incident at UCSF serves as a stark reminder. Here, alert fatigue, coupled with a confusing user interface featuring different units for adult (mg) and pediatric (mg/kg) patients, resulted in a doctor accidentally ordering a 39x overdose, which was subsequently administered to a pediatric patient, nearly proving fatal 13 . Such a scenario is the result of a complex interaction of different decisions; no one could foresee that specific event, thus underscoring the value of studying real-world case studies in order to formulate sensible policies and best practices.
For that reason, it is valuable to create a workflow diagram to document the development of an ML-based tool for predicting sepsis in a hospital. Such a diagram serves as a tangible case study that can bridge the gap between theoretical discussions and practical applications of AI in healthcare. Workflow diagrams can empower stakeholders and function as communication tools for knowledge legitimation and diffusion. Sharing operational knowledge, or knowledge of day-to-day operations, allows stakeholders to navigate the organization and gain agency as they understand the outcomes and goals of their roles 14 . Furthermore, documenting on-the-ground processes creates a stable and tangible basis for knowledge building and legitimation 15 . Sharing and documenting knowledge about the full range of roles critical to technological work matches frameworks such as the Data Feminist 16 principle to “Make Labor Visible.”
This study presents a comprehensive algorithm journey map (a set of workflow diagrams), capturing all social and technical activities involved in the procurement, development, integration, and lifecycle management of a health AI tool. Our contributions are as follows:
We present the algorithm journey map of a Sepsis prediction tool at Duke called SepsisWatch and discuss our findings.
We analyze these findings, particularly with an eye toward lessons learned in modeling assumptions, stakeholder recruitment, and organizational structure.
We discuss limitations and future work.
Although this algorithm journey map is highly specific to the Duke SepsisWatch context, the exercise will be very valuable to other researchers both because it provides a blueprint for how one can build their own algorithm journey map and because even if a different organization doesn’t follow the exact same steps, there will be commonalities in the types of stakeholders, challenges, and enablers (e.g., institutional silos, differences in stakeholder priorities, technical barriers).
How to read the algorithm journey map
The algorithm journey map is organized around four stages based on related work defining algorithm adoption stages 17 . The four lifecycle stages are:
Problem identification : How the organization identified sepsis as a problem that needed to be addressed and why a solution that uses AI is the best approach to address the problem. This stage ends with investing resources to build a sepsis AI tool.
Development : The building of the sepsis AI tool, preparing the clinical environment in which it operates, and designing the user interface and user experience. This stage ends with the decision to integrate the AI tool into clinical care. This stage zooms into two sub-stages, which are:
Model build and validation : building and validating a machine learning model on retrospective data
User interface build and user experience design : defining and developing the user interface and user experience.
Integration : Integrating the sepsis AI tool into the clinical environment and ends with a decision to continue using the sepsis AI tool after initial integration. This stage zooms into two sub-stages, which are:
Technical integration : integrating the technology into legacy systems and creating a way for the sepsis AI tool to run on real-time data
Clinical integration : integrating the sepsis AI tool into the clinical workflow
Lifecycle management : This stage describes post-rollout activities to manage, maintain, evaluate, and update the sepsis AI tool. This stage continues for as long as the AI tool is used in clinical care. It also includes monitoring the appropriate use of the tool and ensuring its decommissioning is initiated if it becomes obsolete or irrelevant.
A full list of stakeholders mentioned throughout the algorithm journey map is identified in Table 1 . We use the traditional event shapes from the swimlane literature—start/stop (oval), action (rectangle), and decision (diamond) using their canonical shapes from process maps 18 —and supplement them with some additional markers, all shown in Fig. 1 . We introduce light bulb icons to denote ‘lessons learned’ that were identified by participants during interviews and dotted gray circles to denote “the path not taken” from each decision point. Due to the complexity of the multi-year effort, some processes are broken down into sub-processes; if a sub-process is complex and distinct enough we represent it with a green box and its own standalone map, whereas if it is small enough then we embed it in the original map but with a dotted blue line border.
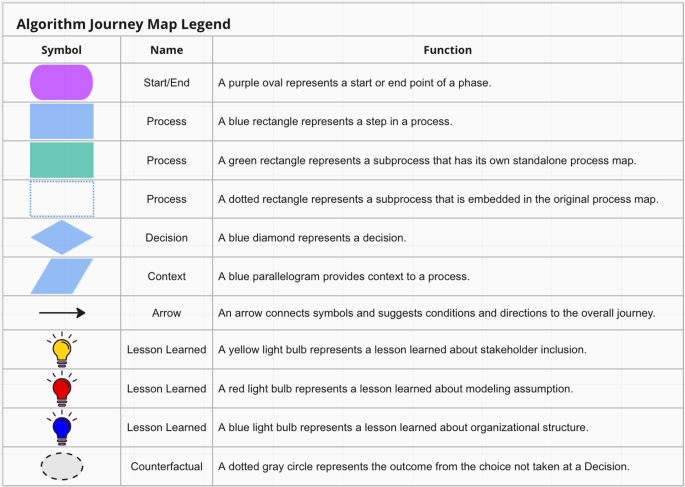
Symbols used in the algorithm journey map.
An explanation of how we created the algorithm journey map below is provided in the “Methods” section later in the paper.
Algorithm journey map
Figure 2 shows the process of identifying and prioritizing the problem that led to the development and adoption of a sepsis AI tool. This process began in the fall of 2015 when health system leaders launched an innovation competition (i.e. the Request for Applications (RFA) process) that featured a strategic priority to reduce inpatient mortality. A small group of clinicians applied to the innovation competition and proposed to use machine learning to predict sepsis.
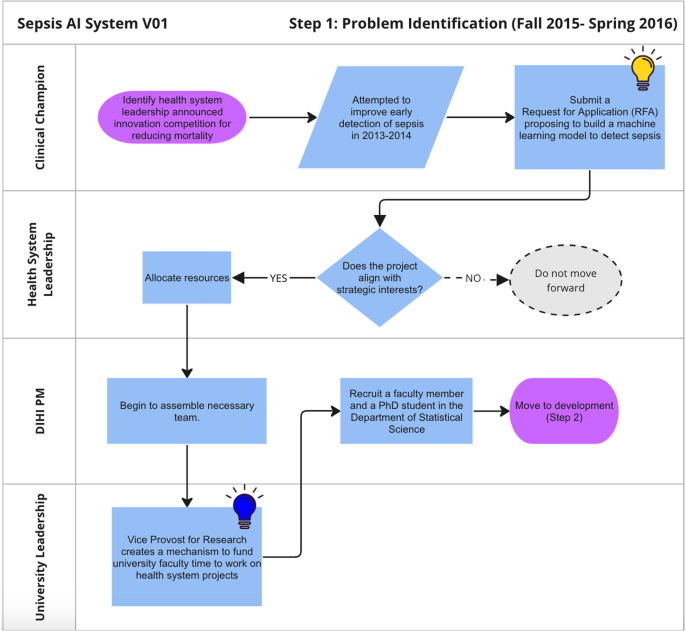
Journey map of problem identification phase.
The proposal to develop a sepsis AI tool was selected by health system leaders for funding. Resources were allocated to pursue the opportunity, and staff from an internal innovation team were embedded in the project. In 2016, machine learning expertise within the school of medicine was limited and there was no mechanism for faculty in quantitative sciences departments to directly collaborate on operational health system projects. Health system leaders worked with the vice provost for research to establish a process whereby a statistics faculty and graduate student could dedicate effort to the sepsis AI tool project. The project team featured clinicians across specialties, project management, and statistics and machine learning expertise.
Figure 3 shows the development stage. The innovation team project manager, in consultation with the clinical champion, guided the project through the many steps. During this stage, the clinical champions defined project goals and requirements, including:
How is sepsis defined (e.g. CDC criteria, CMS criteria, presence of an ICD code)?
What data elements are important for the predictive model?
Who is the user (e.g. attending, resident, bedside nurse, rapid response team)?
Which patients is the model run on (e.g. emergency department, all floors of main hospital, main hospital and regional partner hospital, ICU, non-ICU)?
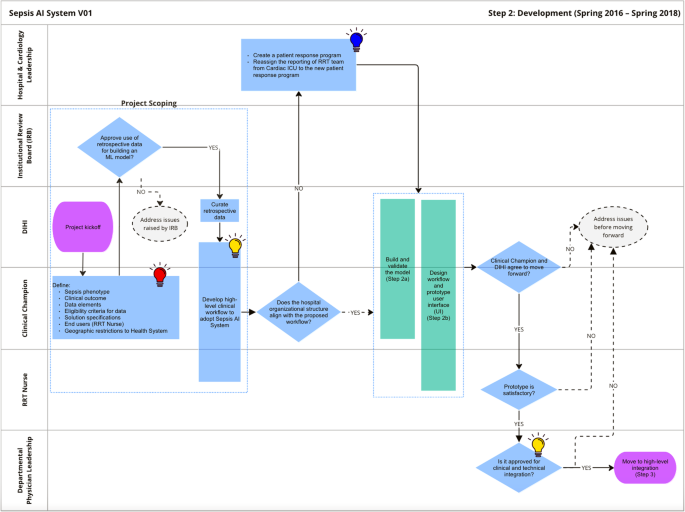
Journey map of the development phase.
The IRB reviewed the project to approve the development of the algorithm on retrospective data and granted a waiver of consent to use patient data for model development.
As will be described in the following sections, the above decisions guided the design and development of the sepsis AI tool and had significant downstream implications. Once it was decided that the rapid response team (RRT) nurse would be the primary user of the tool, the project team needed to ensure that organizational priorities would incentivize the tool to actually be used. RRT nurses were historically cardiac critical care nurses who supported care in the cardiac ICU when not responding to urgent events. These nurses reported to the cardiology service line, which was not primarily responsible for sepsis care quality. The project team worked with hospital leaders to create a new structure–the patient response program–that would house the RRT nurses and become responsible for sepsis care quality. During this restructuring, the clinical champion for the project became the patient response program director. These changes aligned RRT nurse management incentives with the objectives of the sepsis AI tool to improve sepsis care.
Figures 4 and 5 detail the development of the sepsis predictive model and UI design, respectively. These processes are described in more detail below. Once these prototypes were built, department physician leadership reviewed the progress and approved moving forward with the integration process.
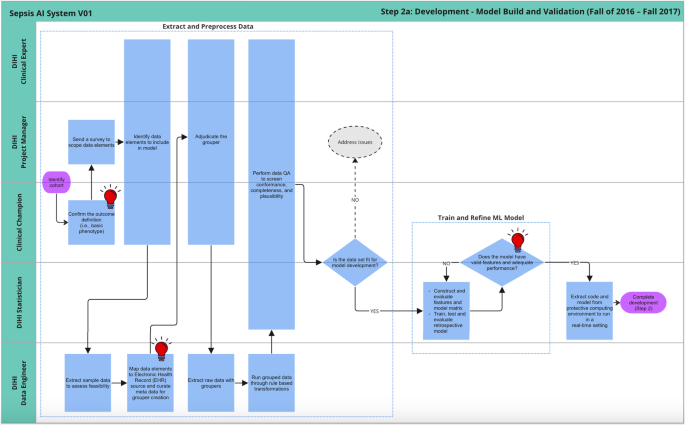
Journey map of model build and validation sub-phase of development.
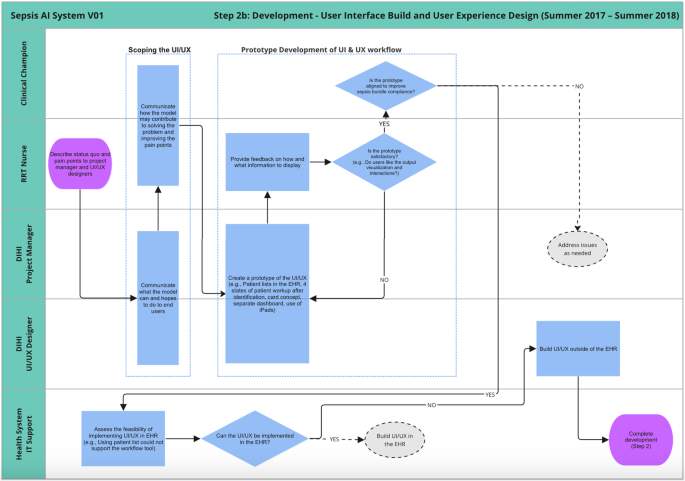
Journey map of the development of user interface and user experience.
Figure 4 details the steps involved in building a machine-learning model on retrospective data. These steps are likely very familiar to machine learning model developers. After the team received cuts of historical data, the project manager worked with the clinical champions to clean the raw data. This included both grouping related raw elements (e.g., arterial blood pressure, blood pressure measured from left arm cuff) and performing quality checks to ensure the data aligns with clinical expectations. The data quality activities conducted for this project in 2016 - 2017 laid the foundation for a data quality assurance framework that was formally validated at a later date 19 .
Once the data engineer grouped and cleaned the data, the statisticians on the team built a machine-learning model, evaluating and refining it until it achieved sufficient performance on unseen data. The statistician then reviewed the output of the model with the clinical champion, both with summary statistics and chart reviews to assess whether the model was ready to move forward.
In parallel to the model building and validation sub-phase, Fig. 5 outlines the development of the UI design. This was an iterative process that began with scoping what the tool can help with based on the status quo workflow for delivery of care (i.e., reacting to sepsis once the patient already starts to deteriorate) and the general capabilities for what the tool can do (i.e., forecast who is at risk for deteriorating in the next N hours).
Next, there was an iterative design process where the UI designer would prototype ideas and discuss them with the end user (RRT nurses) for refinement. For instance, the original goal of the tool was just to flag high-risk patients in a dashboard, but the RRT nurses communicated that it would be even better if the tool helped them not just detect but also manage interventions to treat sepsis. That feedback resulted in reconceptualizing the AI tool as a “workflow tool” and not a dashboard. The UI designer and RRT nurse agreed on a workflow with four patient states (Triage, Screened, Monitoring, and Treatment) and the user would move the patients through the process as sepsis is detected and managed. This functionality could not be implemented in the hospital’s electronic health record at the time, so the team made the decision to develop an initial UI as a custom web application.
Another such example of iterative feedback involved model output visualization. Initially, a given patient’s predicted probability of sepsis was going to be plotted over time (to help remind the user of the patients they were keeping an eye on). However, after some feedback sessions with users, the UI designers began to worry that the users would use the trajectory/trend as an indicator, itself, and begin to over-rely on it. They concluded that such a scenario would require additional training for users to understand how to interpret time-based plots, so instead they focused on point-in-time visualizations to more closely match the setting the model was trained on without as large a risk of user misconceptions.
Once the iterative feedback was incorporated into the design, the prototype was presented to the clinical champion to ensure that the tool would be aligned with the project’s goals. In this case, the goal was both early identification of sepsis as well as timely treatment once identified. Treatment was to be measured based on sepsis bundle compliance as defined by SEP-1 sepsis bundle regulations issued by CMS 20 .
Figure 6 visualizes the next stage, integration. Integration contains two sub-stages, technical integration, and clinical integration, which are described in more detail below.
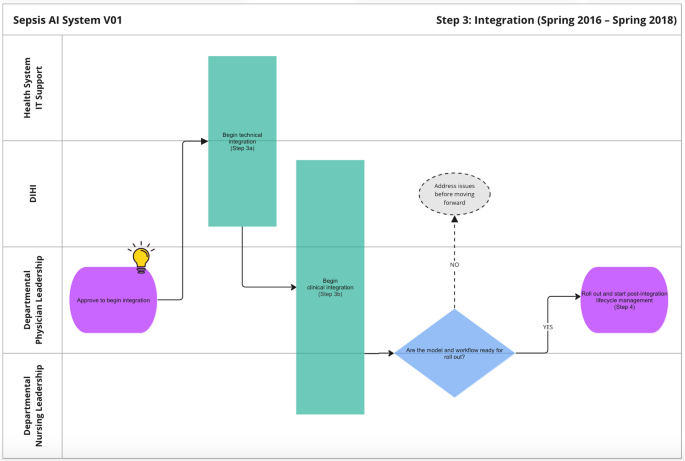
Journey map of the integration phase.
Figure 7 displays the process for technical Integration. It begins with extensive collaboration between the innovation team and the health system IT department. The teams navigated the tension between developing a fully customized solution, which would have higher maintenance and ownership costs and relying fully on existing tools, which would have lower maintenance and ownership costs. A major question that had to be addressed was whether the model could be integrated into Epic via its Cognitive Computing Platform ( https://www.healthcareitnews.com/news/epic-cognitive-computing-platform-primer ). Over a period of 6 months, the two teams conducted due diligence on the Epic solution and determined it was not able to run the sepsis AI tool. The teams agreed to develop a custom solution that extracts data from the EHR, pipes it to a server that runs the model, and sends those predictions to a database that displays results on a custom web application.
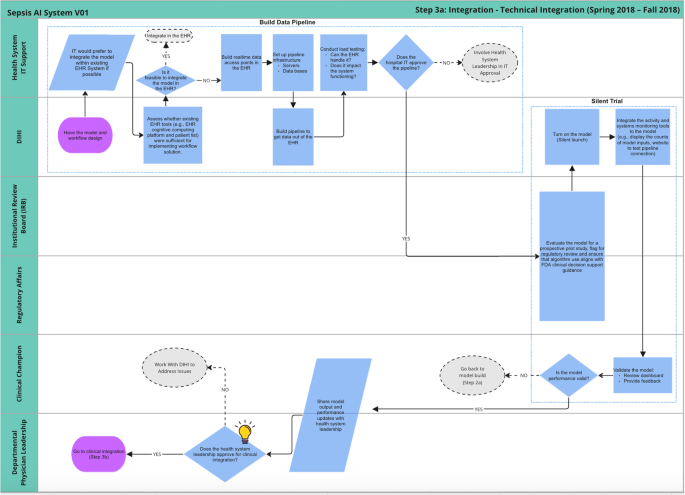
Journey map of technical integration sub-phase.
The IT and innovation teams built a data pipeline to extract data out of Epic’s Chronicles database in real-time. This required IT to build web endpoints to supply Epic data and the innovation team to build a schema for organizing the data that was received. Additionally, there needed to be resources for the server and database. A few months of testing were done to ensure the system could handle the volume of data being extracted, particularly because vitals are collected very frequently. Once IT signed off on the data pipeline, the sepsis AI tool was configured to pull real-time data once every 5 min. In addition, the innovation team built monitoring tools to regularly test the input/output connections and measure the volume of inputs.
Once the data pipeline was functioning, the innovation team submitted another study proposal to run a ‘silent trial’ to enable end-to-end system monitoring and testing. During this IRB review, the innovation team met repeatedly with regulatory affairs leadership to ensure that the sepsis AI tool aligned with the FDA’s definition of clinical decision support (CDS). Specifically, the relevant standards were based on the FDA’s “Clinical and Patient Decision Support Software” draft guidance which was posted in December 2017 ( https://www.regulations.gov/document/FDA-2017-D-6569-0002 ). Because the tool did not make clinical decisions or treatment recommendations and supported independent review by clinicians, regulatory leaders determined that the technology qualified as non-device CDS. Once the ‘silent trial’ was approved, the innovation team conducted user testing to get feedback about the UI and the performance of the model. Once the user was satisfied with the changes, the innovation team presented the functioning tool to department physician leadership for approval. The clinical integration process began after approval.
Figure 8 visualizes the clinical integration process. This involved fine-tuning the workflow and user interface, developing training material, and assembling a governance committee. This began with two parallel processes, one for physicians and one for nurses.
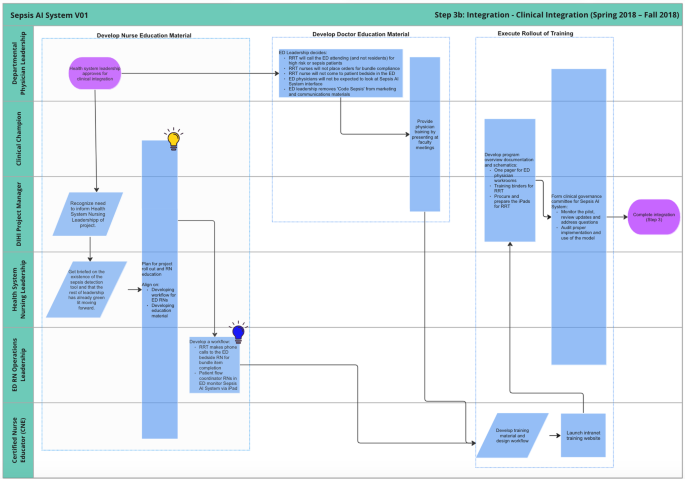
Journey map of clinical integration sub-phase.
The ED physician leadership finalized some decision points that hadn’t been fully specified, such as who the RRT nurse should call when the model predicts a high risk of sepsis (call the attending, not the resident), who will administer treatment (the bedside nurse, not the RRT nurse), etc. Additionally, there were some final suggestions for marketing and communications, such as removing any reference to a “code sepsis.”
At this stage, the innovation team met with the chief nursing officer for the health system to discuss the rollout of the sepsis AI tool. During this initial meeting, it became clear that there were additional stakeholders who needed to be engaged before the AI tool could be launched. Up until this point, the project team had been working primarily with physician leaders at both the hospital and department levels. Unfortunately, this left out nurse leaders at the health system level and within relevant service lines (e.g., emergency department) who needed to deploy resources to support the rollout. To address this lack of communication, the chief nursing officer convened a meeting with the innovation team, hospital nurse leaders, ED nurse leaders, and certified nurse educators (CNEs) to map out steps leading up to roll-out. Working closely with nurse stakeholders, several adaptations were made to the workflow, including direct communication between the RRT nurse and bedside nurses in the ED.
The innovation team worked with CNEs to develop training material, particularly for RRT nurses, to equip new users to appropriately use the sepsis AI tool. Finally, a governance committee was established including stakeholders from both physician and nursing leadership to meet monthly during the initial rollout in order to resolve any emergent issues.
Unlike prior stages, post-rollout lifecycle management is not a linear-flow process. Some tasks are predictable whereas others are responsive to events that occur (e.g., user requests, technical failures, etc). Instead of employing a swimlane-oriented diagram to convey lifecycle management, Fig. 9 shows a variety of different activities, categorized by both type of task (monitoring, updates, and operational management) and frequency (one-off, semi-recurring, recurring, and event-based). These activities also involve many stakeholders, principally driven by the project manager and clinical champion.
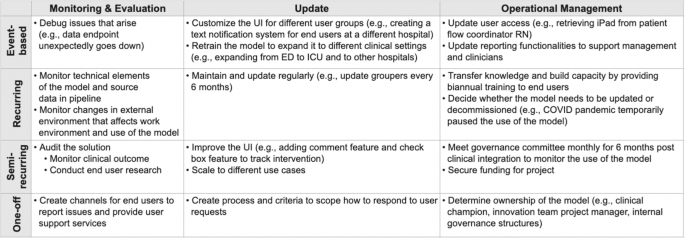
Different tasks that arise throughout post-rollout lifecycle management.
Monitoring involves both regular dev-ops duties (e.g., is the system still up? Were there large changes in data volume?) as well as periodic, thorough data science analysis (e.g., does the model still perform well? Have clinical outcomes improved?). Monitoring and evaluation are a technical component of system audits, assessing model performance as clinical outcomes, and process measures over time. These audits have also involved user research, such as shadowing the RRT nurses who use the tool. Additionally, CMS requires hospitals to conduct external auditing of bundle compliance in order to maintain eligibility for Medicare payments.
Updates are performed both as needed (event-based, semi-regularly) and on a regular schedule (recurring) in order to ensure the robust performance of the sepsis AI tool. An example of a recurring update that occurs every 6 months is a coordinated effort between the innovation team and clinical champions to refresh data element “groupers.” This process ensures that any new medications, vital sign monitors, or laboratory equipment are accounted for in the data pipeline. An example of a one-off update responding to a user request was adding new functionality to automatically identify treatment bundle compliance in real-time. Although there is no formal process, when users request new features, the project team must categorize the feature as either an ‘update to the existing product’ or a ‘new project that needs separate, dedicated effort.’ An example of a task that spun off into a standalone product is the alert notification system that now supports many AI tools.
Operational management involves ongoing ownership and accountability. The sepsis AI tool has 2 “owners”—the clinical champion and the innovation team project manager—who communicate with each other and liaise with additional members to support the sepsis AI tool as needed. They periodically need to secure funding and resources for the project and assess how well the solution is addressing the original objective. The project owners also ensure that existing and new staff are appropriately trained and that training material is maintained to reflect evolving standards of care for sepsis. Additional entities also play an active role, such as how institutional leaders are now seeking input from the FDA to ensure that the use of the tool continues to comply with the intention of non-device CDS in light of the 2022 final CDS guidance (https: // www.fda.gov/regulatory-information/search-fda-guidance-documents ).
Interviewee-identified opportunities for improvement
Throughout the construction of the algorithm journey map, we asked interviewees to identify not just what happened but also what they might have done differently in retrospect. This includes both narrow/technical and broader opportunities, and such reflections were indicated in the algorithm journey maps with lightbulb icons. The icons were separated into three categories: modeling assumptions (red), stakeholder inclusion (yellow), and organizational structure (blue). Below, we highlight specific learnings from the journey map and also abstract generalizable insights that can inform other efforts to develop and integrate AI into clinical care.
Modeling assumptions
There were multiple areas where technical decisions about the model hampered the project. Most of these decisions occurred early in the algorithm journey:
[Development] Scoping the solution : Early on, clinical collaborators at that time felt the sepsis AI tool would not be used in the ICU, so data was thus truncated at the time of ICU transfer. This single decision limited the future ability to expand the use of the sepsis AI tool beyond the ED to general inpatient wards. When a user requested to expand the use of the AI tool to inpatient wards, a new “2.0” project had to be initiated. Generalizable insight: Carefully consider the downstream impact of inclusion and exclusion criteria applied at the level of patients and individual data values. If the use of an AI tool may extend to adjacent use cases, make sure that relevant data is included in model training and evaluation.
[Model Building] Outcome definition : The project team did not initially appreciate the difficulty in finding the “right” definition of sepsis. Physicians had differing opinions about which outcome to use, and the published literature didn’t show consensus. Modeling became easier once the outcome definition was modularized, allowing for easily changing the criteria and retraining the model. Generalizable insight: Do not limit outcome labels to single sets of criteria and develop (and validate) models for multiple types of definitions. Even if there is a professional consensus today on how a disease is defined, anticipate future changes.
[Model Building] Real-time access to model inputs : When determining which data elements to include as inputs for the model, the team had not initially considered that any data for the model needed to not just be captured in the EHR but also available in real-time. Epic’s backend databases involve both a real-time feed of the current day and a historical archive, and access to real-time data requires the IT department to build specific data endpoints for each kind of element. Generalizable insight: Only include data elements in an AI tool if the data is available and robustly captured at the time predictions need to be made.
[Model Building] Environment constraints on model : Initial versions of the model involved a technically complex Multi-task Gaussian Process for data imputation, followed by an LSTM classifier. The plan had been to integrate this model into production, but during technical integration, the team realized this approach required matrix inversion and significant computation. Eventually, the team used fill-forward data imputation for the LSTM, but it should have been knowable at the time that the runtime environment would limit expensive model architectures and decisions. Generalizable insight: Plan for ablation studies that evaluate the impact of removing model components or input features. When building an AI tool for integration, reduce unnecessary complexity.
Stakeholder inclusion
Beyond technical lessons, there was another ‘obvious’ insight from the mapping exercise. Many decision points throughout the process (e.g., problem formulation, workflow design, signing off with integration) were shaped and approved by hospital and department leaders who were physicians, but not nurses. This culminated in the clinical integration stage being nontrivially complex and stressful. This oversight also created tension between different clinical stakeholders that needed to be addressed leading up to a large project launch.
Although the RRT nurse users were included in the early designs, it was not well understood that physicians and nursing leaders within service lines and hospitals manage separate activities. The innovation team needed to be directly engaging leaders across both chains of command, rather than expect communication between the two groups. As a result of this oversight, the clinical integration stage involved meeting many levels of nursing leadership (health system-level, hospital-level, and department-level) as well as directly engaging certified nurse educators to finalize programmatic decisions and develop training material.
The yellow light bulb icons indicate all of the opportunities where nurse leadership could be (or eventually was) involved in the project approval.
The generalizable insight from this lesson is to identify up-front the reporting structures, training requirements, and communication channels for all clinical professions affected by an AI tool put into practice. Even if clinicians across professions appear to work closely together in the same unit, reporting, training, and communication channels may be distinct. Project leaders also cannot assume that information shared with front-line workers or business-unit leaders is shared upwards within reporting structures. Executive leaders need to be informed and have their concerns addressed prior to the integration of new AI tools.
Organizational structure
One final set of learning opportunities comes from identifying commonalities around structures and workflows. These events were not about what should have been done differently in the moment but instead flagged organizational changes that took a great deal of effort and could be streamlined. The following learnings are highlighted with blue lightbulb icons:
[Problem Identification] Recruit statisticians : The innovation team partnered with a faculty and Ph.D. student from the statistics department of our organization’s university. However, there was no mechanism for research faculty to dedicate time to health system projects. The Vice Provost for Research at the university helped facilitate the collaboration. Since that time, the innovation team has grown significant internal machine learning expertise in order to move more quickly on projects. Generalizable insight: Ensure senior-level support to engage perceived outsiders in the development of AI tools used in clinical care. Even if technical expertise exists within the organization, trust must be established between senior technical and clinical leaders.
[Development] Create a patient response program : As discussed in greater depth earlier, the project team needed to ensure that organizational incentives enabled RRT nurses to prioritize the use of the tool. This involved working with hospital leaders to move RRT nurses out of cardiology and into a new structure that became responsible for sepsis care quality. This effort was critical to ensure alignment in organizational priorities because otherwise, busy nurses would likely not consistently be able to make time to use (let alone offer feedback about) the sepsis AI tool. Generalizable insight: Invest time and energy in modernizing the organization to most effectively utilize emerging technologies like AI. In cases where an AI tool does not fit seamlessly within workflows or professional roles, the project team may need to be empowered to drive organizational change.
[Clinical Integration] Workflow burden : During the rollout, iPads were prepared for both the RRT nurses and also patient workflow coordinator (PWC) nurses in the ED. However, after a few months post-clinical integration, the innovation team learned that the patient workflow coordinators were too busy with other duties to be using the sepsis AI tool; the model predictions were not as critical to PWC nurses’ immediate priorities. This process could have been streamlined by having regular check-ins with front-line workers, in addition to managers, to surface friction on the ground. Generalizable insight: Adapt the workflow to the needs of front-line workers and build flexibility into early pilots. Being able to respond to feedback also builds trust among front-line workers.
Three major insights derived from our study can inform future work. First, the algorithm journey map captures an extremely messy process that is far from ideal, and the effort required to surface the process is not scalable. In total, the algorithm journey map included 7 components for 4 stages and a separate table to capture all lifecycle management activities. Numerous interviews and co-development workshops were held with individuals who were involved in various stages of AI adoption and our team had to set bounds on the level of detail included in the journey map. Almost every step in the process could go further into detail to further explicate individual sub-steps. While the current study aimed to advance the understanding of traceability and transparency, we do not recommend that algorithm journey maps accompany every single instance of health AI adoption. This conclusion is different from Model Facts labels or data quality assurance documentation, which are recommended for all adopted health AI projects 21 .
Organizations and settings must then determine when concretization of AI adoption is most valuable. Unfortunately, while other organizations may learn from our experience, we do not expect that the algorithm journey map presented in this study maps well to any other setting or use case. By design, this traceability artifact is extremely enmeshed with our particular use case and setting. Other organizations may consider developing their own algorithm journey maps after completing an AI adoption process. We hope that as more groups publicly disseminate traceability artifacts like the algorithm journey map, organizations can learn from each other how to streamline the process and avoid common pitfalls.
The second major insight is the urgent need to standardize the health AI adoption process. The specific path visualized in the sepsis AI tool algorithm journey map is highly circuitous, confusing, and not meant to ever be repeated. Organizations, including ours, must actively streamline the process and define the most relevant and important decision points throughout the lifecycle stages. While developing the algorithm journey map, we did align the structure with 4 stages that can be adopted by other projects. Future work is needed to further align activities across healthcare delivery settings to define a standard process by which health AI tools can be adopted across settings. Hopefully, as different settings align their processes, the complexity of and effort required to develop algorithm journey maps will significantly decrease.
The third major insight is the immediate opportunity to leverage the concrete algorithm journey map to design traceability and transparency artifacts needed to facilitate the adoption of health AI tools. There’s limited understanding of the specific user, knowledge base, context-of-use, and decision made using information contained in the documentation artifact. With the algorithm journey map, researchers can now tailor documentation and transparency artifacts to specific decision points in a process. The user, use case, and implications become clear. While we do not recommend building out documentation for every single decision point, because many decision points are redundant or inefficient, we do expect that documentation efforts can target a small number of key decision points visualized throughout the process.
There are also three primary limitations of the current study. First, we focus on a single algorithm within a single setting. While many machine learning in healthcare studies seek to develop and validate frameworks across multiple models and settings, our objective was different. Rather than contribute additional documentation artifacts or well-organized processes for developing health AI tools, we address a core limitation of existing work. Our study breaks out of common pitfalls that limit visibility into complex sociotechnical processes, but in doing so we are myopically focused on minute details for a single use case. Our study does not address general questions such as the administrative roles, measures of AI tool viability, and form and frequency of communication required for AI tools to be successfully integrated. We address this limitation by identifying generalizable learnings that surfaced within the algorithm journey map, and we present key insights that are immediately informative to other groups.
Second, and relatedly, algorithm journey maps might emphasize a specific perspective, amplifying existing power structures rather than allowing less-powerful stakeholders to have their experiences properly reflected 22 . Further, a given algorithm journey map might not be able to capture all of the relevant context to scale across locations or time periods. Models of innovation are dependent on political, cultural, and institutional factors, requiring a high degree of contextual specificity in each case study 23 , 24 .
The third limitation is a lack of standardization for the amount of detail to include in a journey map. We scoped the journey map to not include any activities prior to problem selection for the sepsis AI tool, even though previous technologies were used to detect sepsis. We also did not include any new sepsis models developed as separate projects during lifecycle management. Within the steps depicted in the algorithm journey map, we included details relevant to the reader, but some may find the level of detail excessive or insufficient. We hope that as more organizations disseminate traceability artifacts, standards emerge for how to best visualize algorithm journey maps.
We hope that in future work, additional organizations can build upon this approach of making these processes more tangible. As more case studies are fleshed out, it will be easier to normatively discuss the best way to operationalize other ethical principles. For instance, the AI sepsis tool adoption captured by this journey map did not include patients at any step, and – unlike for the cases of nurses—that idea did not even come up during the interviews as an opportunity to reflect on where they should have been included. Many projects in this field also have struggled with this question around patient inclusion; as more projects are more tangible, the field will be able to learn from what methods of patient engagement (and other instantiations of ethical computing principles) are more/less meaningful.
Data collection
In this study, we document the effort required to build and integrate an ML-based sepsis detection algorithm in a large health system. The purpose of this study was to identify the stakeholders and decisions that were made throughout the entire effort in order to develop documentation artifacts that would be helpful for people in those roles for future projects. In order to understand this effort, our algorithm journey map is composed of workflow diagrams to track the pre-deployment efforts because of their mostly linear nature and then a table of the post-deployment efforts due to their concurrent and asynchronous nature.
We interviewed every stakeholder on the innovation team (Duke Institute for Health Innovation) who was involved in the project. Six participants with the roles of a clinical data scientist, an innovation program manager, a data engineer, two solutions architects, and an innovation program director were recruited. In total, we conducted 20 unstructured interviews with them to gather information about each stage featured in the algorithm journey map. Although there was no interview guide, each participant was asked to describe:
Which stakeholders were involved in that part of the project?
What work was done (and by whom) for the parts of the project they worked on?
What decisions were made?
What data/information was used to make those decisions?
What decision points weren’t considered but should have been?
During early interviews, we either took detailed notes or interactively built visual schematics using Microsoft Visio, which is a diagramming and vector graphics application. We then met with the sepsis project leaders multiple times to clarify questions and refine the algorithm journey map.
Process mapping
A process map is an artifact that documents a workflow, allowing decision-makers to identify the steps, stakeholders, and decisions made during a given process or activity. There can be many variants of the concept, such as basic flowcharts, customer journey map 25 , value stream map 26 , and more. A recent systematic review that evaluated 105 process mapping manuscripts found that process maps help to support understanding of complex healthcare systems and can guide improvement efforts within their local context 27 . de Ven articulates how a process map’s narrative presentation is well-suited to show the complexities of a workflow, which can be nonlinear and have unexpected twists and turns 28 . Adopting this awareness is especially important to implementing technologies in organizational settings, which often require changes to workers’ roles, relationships, and authority structures 29 , 30 .
To construct the pre-deployment section of the algorithm journey map, we use a visualization technique from the process map literature, namely swimlane diagrams 18 . Damelio describes a swimlane diagram as “a set and series of interrelated work activities and resources that follow a distinct path as work inputs (resources) get transformed into outputs (items) that customer’s value” and such diagrams are used to delineate the various stakeholders and their interactions 26 .
This study was a quality improvement project with minimal risk to the participants. IRB review and approval was not required according to Duke University policy, because the project is not research that is subject to federal human subjects protection regulations 31 . The activities carried out as part of this project can improve the process for algorithm implementation locally, the project evaluates the current practices of clinicians and staff directly involved in the project, and future patients can benefit from improvements in the process. The project followed the ethical principles of research and the privacy, confidentiality, and autonomy of all participants were respected. All participants were informed about the purpose of the project before contributing the information needed, and no harm was anticipated or reported due to participation. All staff who were interviewed for the project provided consent prior to interviews.
Data availability
Much of the materials or information used to inform this study have been previously published or made available on the Duke Institute for Health Innovation website. Requests for material used in this study that is not currently publicly available can be sent to the corresponding author.
Davenport, T. & Kalakota, R. The potential for artificial intelligence in healthcare. Future Healthc. J. 6 , 94–98 (2019).
Article PubMed PubMed Central Google Scholar
Park, E. The AI Bill of Rights: a step in the right direction. Orange Cty. Lawyer Mag. 65 , 2 (2023).
Google Scholar
Boag, W. Evidence-based AI Ethics . Dissertation, Massachusetts Institute of Technology (2022).
Zhou, Q., Chen, Z.-h, Cao, Y.-h & Peng, S. Clinical impact and quality of randomized controlled trials involving interventions evaluating artificial intelligence prediction tools: a systematic review. NPJ Digit. Med. 4 , 154 (2021).
Chen, P.-H. C., Liu, Y. & Peng, L. How to develop machine learning models for healthcare. Nat. Mater. 18 , 410–414 (2019).
Article CAS PubMed Google Scholar
Wiens, J. et al. Do no harm: a roadmap for responsible machine learning for health care. Nat. Med. 25 , 1337–1340 (2019).
Reddy, S. et al. Evaluation framework to guide implementation of AI systems into healthcare settings. BMJ Health Care Inform. 28 , 1 (2021).
Article Google Scholar
van de Sande, D. et al. Developing, implementing and governing artificial intelligence in medicine: a step-by-step approach to prevent an artificial intelligence winter. BMJ Health Care Inform. 29 , 1 (2022).
Tonekaboni, S. et al. How to validate machine learning models prior to deployment: silent trial protocol for evaluation of real-time models at ICU. In Proc. Conference on Health, Inference, and Learning, PMLR. Vol. 174 (eds Gerardo F., George H C., Tom P., Joyce C H., & Tristan N.) 169–182 (Proceedings of Machine Learning Research (PMLR), 2022).
Lu, J. H. et al. Assessment of adherence to reporting guidelines by commonly used clinical prediction models from a single vendor: a systematic review. JAMA Netw. Open 5 , e2227779 (2022).
Dummett, B. et al. Incorporating an early detection system into routine clinical practice in two community hospitals. J. Hosp. Med. 11 , S25–S31 (2016).
Article PubMed Google Scholar
Sendak, M. P. et al. Real-world integration of a sepsis deep learning technology into routine clinical care: implementation study. JMIR Med. Inform. 8 , e15182 (2020b).
Salber, P. Wachter’s digital doctor explores the dark side of health IT. Mhealth 1 , 18 (2015).
PubMed PubMed Central Google Scholar
Huising, R. Moving off the map: how knowledge of organizational operations empowers and alienates. Organ. Sci. 30 , 1 (2019).
Daston, L. & Galison, P. The image of objectivity. Representations 40 , 81–128 (1992).
D’Ignazio, C. & Klein, L. F. Data Feminism (MIT Press, 2020).
Kim, J. Y. et al. Organizational governance of emerging technologies: AI adoption in healthcare. In 2023 ACM Conference on Fairness, Accountability, Transparency, FAccT ’23 , Chicago, IL, USA (ACM, 2023).
Heher, Y. K. & Chen, Y. Process mapping: a cornerstone of quality improvement. Cancer Cytopathol. 125 , 887–890 (2017).
Sendak, M. et al. Development and validation of ML-DQA–a machine learning data quality assurance framework for healthcare. Machine Learning for Healthcare Conference. PMLR, 741–759 (2022).
Gesten, F. & Evans, L. SEP-1—taking the measure of a measure. JAMA Netw. Open 4 , e2138823 (2021).
Haraway, D. Simians, Cyborgs, and Women: The Reinvention of Nature (Routledge, 1990).
Moser, I. & Law, J. Fluids or flows? Information and qualculation in medical practice. Inf. Technol. People 19 , (2006). https://doi.org/10.1108/09593840610649961 .
Pfotenhauer, S. & Jasanoff, S. Panacea or diagnosis? Imaginaries of innovation and the ‘MIT model’ in three political cultures. Soc. Stud. Sci. 47 , 783–810 (2017).
Sendak, M. P., Gao, M., Brajer, N. & Balu, S. Presenting machine learning model information to clinical end users with model facts labels. NPJ Digit. Med. 3 , 41 (2020).
Richardson, A. Using customer journey maps to improve customer experience. Harv. Bus. Rev. 15 , 2–5 (2010).
Damelio, R. The Basics of Process Mapping (CRC Press, 2011).
Antonacci, G., Lennox, L., Barlow, J., Evans, L. & Reed, J. Process mapping in healthcare: a systematic review. BMC Health Serv. Res. 21 , 342 (2021).
Van de Ven, A. H. The innovation journey: you can’t control it, but you can learn to maneuver it. Innov.-Eur. J. Soc. Sci. Res. 19 , 39–42 (2017).
Kellogg, K. C. Challenging Operations: Medical Reform and Resistance in Surgery (University of Chicago Press, 2011).
Elish, M. C. & Watkins, E. A. Repairing innovation: a study of integrating AI in clinical care. New York: Data & Society Research Institute , 1–62 (2020). https://datasociety.net/library/repairing-innovation/ .
Duke University Institutional Review Board. Quality Improvement or Research Checklist . (Duke University Institutional Review Board, accessed 16 February 2024). https://irb.duhs.duke.edu/sites/default/files/2022-04/qi_policy_and_checklist_4-14-2021.pdf .
Download references
Acknowledgements
We thank the Patrick J. McGovern Foundation for their funding and support of the project. The foundation played no role in the study design, data collection, analysis, and interpretation of data, or the writing of this manuscript. We thank all interview participants for sharing their insights and time with us. We thank Duke Heart Center for helping administer and manage the grant.
Author information
These authors contributed equally: William Boag, Alifia Hasan.
Authors and Affiliations
Duke Institute for Health Innovation, Durham, NC, USA
William Boag, Alifia Hasan, Jee Young Kim, Mike Revoir, Marshall Nichols, William Ratliff, Michael Gao, Shira Zilberstein, Suresh Balu & Mark Sendak
Harvard University, Cambridge, MA, USA
Shira Zilberstein
Aga Khan University, Karachi, Pakistan
Zainab Samad, Zahra Hoodbhoy, Mushyada Ali & Nida Saddaf Khan
Duke University School of Medicine, Durham, NC, USA
Manesh Patel
You can also search for this author in PubMed Google Scholar
Contributions
W.B., A.H. and J.Y.K. designed the study concept, conducted the interviews, collected data, and surfaced the findings; M.R., M.N., W.R. and M.G. provided the data and information needed for the study; S.Z. helped with background and literature review for the study; Z.S., Z.H., M.A. and N.S.K. helped with review and editing of the manuscript critically for important intellectual content; M.P., M.S. and S.B. helped secure the funding for the project; M.S. and S.B. conceived and designed the analysis. All authors were involved in writing and editing the manuscript. All authors approved the final manuscript.
Corresponding author
Correspondence to Mark Sendak .
Ethics declarations
Competing interests.
M.S., S.B., W.R., M.N., M.R. and M.G. reported co-inventing software at Duke University licensed by Duke University to external commercial entities including Clinetic, Cohere Med, Kela Health, and Fullsteam Health. M.S., S.B., M.N., M.R. and M.G. own equity in Clinetic. No other disclosures were reported.
Additional information
Publisher’s note Springer Nature remains neutral with regard to jurisdictional claims in published maps and institutional affiliations.
Rights and permissions
Open Access This article is licensed under a Creative Commons Attribution 4.0 International License, which permits use, sharing, adaptation, distribution and reproduction in any medium or format, as long as you give appropriate credit to the original author(s) and the source, provide a link to the Creative Commons licence, and indicate if changes were made. The images or other third party material in this article are included in the article’s Creative Commons licence, unless indicated otherwise in a credit line to the material. If material is not included in the article’s Creative Commons licence and your intended use is not permitted by statutory regulation or exceeds the permitted use, you will need to obtain permission directly from the copyright holder. To view a copy of this licence, visit http://creativecommons.org/licenses/by/4.0/ .
Reprints and permissions
About this article
Cite this article.
Boag, W., Hasan, A., Kim, J.Y. et al. The algorithm journey map: a tangible approach to implementing AI solutions in healthcare. npj Digit. Med. 7 , 87 (2024). https://doi.org/10.1038/s41746-024-01061-4
Download citation
Received : 21 July 2023
Accepted : 19 February 2024
Published : 09 April 2024
DOI : https://doi.org/10.1038/s41746-024-01061-4
Share this article
Anyone you share the following link with will be able to read this content:
Sorry, a shareable link is not currently available for this article.
Provided by the Springer Nature SharedIt content-sharing initiative
Quick links
- Explore articles by subject
- Guide to authors
- Editorial policies
Sign up for the Nature Briefing: Translational Research newsletter — top stories in biotechnology, drug discovery and pharma.
How to use AI to plan your next vacation and what you should know first

Where should I go on vacation this summer ?
The question is simple enough, but the possibilities are endless.
“Feeling adventurous or more like chilling by the beach with a drink in hand?” Layla replies to narrow the list.
Chilling by the beach sounds nice.
“Alright, for that laid-back beach vibe, how about Santorini with its iconic sunsets or Ao Nang for some Thai beach bliss ? Pick your paradise!” she suggested.
Learn more: Best travel insurance
Only she is not really a “she.” Layla is an AI travel planner whose website launched this year, among a growing number of artificial intelligence-driven tools for travel.
Just over 50% of 1,400 people recently surveyed by Matador Network , a travel publisher and creator of AI travel assistant GuideGeek , said they’re open to using AI for their summer travel. A previous Matador Network survey found 64% of 1,200 travelers surveyed had already used or planned to use AI for trip planning .
Here’s what travelers should know about planning trips with AI.
How common is AI today?
Many people associate AI with large language models like ChatGPT, which can both recognize and generate text, but that’s just one type of AI.
“AI is generally everywhere,” said Yoon Kim, an assistant professor in MIT’s Electrical Engineering and Computer Science Department and Computer Science and Artificial Intelligence Laboratory . “For example, when you search for something – let's say you search for something on TripAdvisor, Hotels.com – there is likely an AI-based system that gives you a list of matches based on your query.”
“Because a lot of the (online travel agencies) have now integrated different types of Gen AI into their platforms … people may be using them without their knowledge,” echoed Matt Soderberg, principal, U.S. airlines leader for Deloitte Consulting, which named AI as a major theme in changing travel in its Facing travel's future report released in early April.
Kayak and Expedia offer AI travel tools. Google has used AI for years for search. Those familiar “People Also Ask” questions are powered by AI. Google Flights uses machine learning , a type of AI. AI also powers Google Maps’ Immersive View , which gives users a navigable fly-over view of 13 cities and more than 500 global landmarks that users can zoom in on like in a video game, with weather and crowd forecasts for different times of day.
Early this year, Google introduced generative AI to multisearch queries made with Google Lens. That allows users to take a photo of something and couple it with text questions like “What kind of flower is this?” or “Who painted this and why?” to get AI-generated answers based on data from across the web and links to additional sources.
How do I plan a trip with AI?
Planning travel with AI is typically free, but travelers may need to create platform-specific accounts to access enhanced features or ask more than a few initial queries.
Google account holders can get generative AI results in text-only search bar searches if they opt in to Search Generative Experience , which is part of Google’s experimental Search Labs . Opting in to SGE allows them to ask things like “Plan me a 2-day solo trip to Grand Teton National Park ” and not only get a suggested itinerary but related photos, reviews and links to other resources.
For Day 1 at Grand Teton, Google suggested a morning hike at Schwabacher Landing “to see the Grand Tetons reflected in the river,” an afternoon visit to U.S. Fish and Wildlife Service’s National Elk Refuge , and dinner at a local Italian restaurant with photos of each destination, links to their websites, pins showing locations on Google Maps, suggestions for where to stay, space for follow up questions, and links to related questions like “Is 2 days enough for Grand Teton National Park?”
Just above the sample itinerary, read a disclaimer: “Generative AI is experimental” and below it: “Trip ideas generated with AI may include inaccurate or misleading information. Confirm info with sources you trust.”
For the same prompt, both ChatGPT and GuideGeek – which can be messaged on social media like a person – offered more suggestions of things to do, as well as reminders to check on trail closures, but no specific recommendations on where to eat or stay, nor photos nor links to find more information on any of the destinations. Layla and Mindtrip, an AI travel planner that launched publicly this week, also included links to various points of interest, hotel suggestions, and the ability to adjust and book different parts of the itinerary through partnerships with third parties. Mindtrip allows multiple people within the same travel party to collaborate on itineraries.
Make travel easy: We tested ChatGPT itineraries in 5 US tourist spots
Can AI be trustworthy?
Asking one AI travel planner for the top 10 snacks at Walt Disney World’s Magic Kingdom, among classics like Dole Whip and Corn Dog Nuggets, it suggested Mickey-shaped beignets. Those would certainly be a top snack if they were sold in the park, like at Disneyland. However Disney World guests have to go to Disney’s Port Orleans Resort - French Quarter for sweet Mickey-shaped pillows of fried dough.
“This phenomena goes under the moniker hallucinations. These generative AI systems are prone to hallucinating plausible-sounding text that’s actually factually incorrect,” MIT’s Kim explained. “This is, I think, going to be sort of an inherent problem with systems that probabilistically generate output over large spaces.”
"If the LLM recommends a restaurant closed down two years ago, you lose all trust immediately," said Mindtrip Founder and CEO Andy Moss. That's why they, and Layla, also rely on human intelligence for recommendations.
Kim noted there are ongoing efforts to mitigate against hallucinations but suggested double-checking AI-generated answers.
“We want to make sure that that information is usable, that it's actionable. It's clear, it's repeatable,” said Will Healy, senior vice president at Booz Allen Hamilton , the largest provider of AI to the federal government. He heads up the company’s recreation work, including Recreaton.gov , the government’s central travel planning site for public lands like national parks.
What can AI be used for?
Currently, most Recreation.gov visitors use progressive search to discover and book things like campsites, checking off boxes and reading information provided by the land manager. However, 25% of randomly selected users are being offered more personalized AI-powered options as part of a beta test with AI.
“What we're beta testing at the moment are things where you can say, ‘Hey, I've got three kids. This is our first time camping. We want to go some place that's fun. My kids love the water. We want to try hiking, and my youngest son likes fishing, but he's not very good at it,’ ” Healy said.
“If you were talking to somebody who knew everything about every campsite, then what answer would they give you? That's what we think artificial intelligence can do,” he added. “And it's not just the data that's in the system, but it's all of the reviews and blogs and everything's out there in the public domain that you can pull different pieces together, put together into a contextual answer.”
If AI is able to understand a traveler’s intent, Healy said it could also suggest alternative destinations or experiences if something a traveler wants is booked up or otherwise not available. He said it could also help make public lands more accessible to more people.
“If you have some sort of impairment – maybe it's sight, hearing, mobility, cognitive, whatever it is – that confidence level (outdoors) might go down, “Healy said. “We want to provide you the right information, so that you can get outside with as much confidence as possible and have an experience that matches your needs .”

IMAGES
VIDEO
COMMENTS
In the ever-evolving landscape of product management and user experience research, the need for speed, accuracy, and innovation is paramount. Introducing a groundbreaking method that harnesses the power of AI to revolutionize the way we create and understand user personas, journey maps, and assumptions while checking for bias and AI risk.
Quick and easy: An AI-powered generator can create a user journey map in minutes, saving you time and effort. Accurate and reliable: AI-powered generators use algorithms to analyze data and create user journey maps. This ensures accuracy and reliability. Customizable: You can customize your user journey map to meet your specific needs and ...
AI-powered tools can analyze vast datasets in real-time, identifying patterns and trends that might be overlooked through manual analysis. This data-driven efficiency allows for more frequent updates, ensuring that User Journey Maps remain reflective of the ever-changing user landscape. 3. Enhanced Accuracy: AI brings a level of accuracy and ...
Teaching AI your methods: Program ChatGPT to understand your journey mapping structure. Using the J stage command, you can prompt the AI to develop a new stage of a journey based on set headings like goals, narrative, questions, and problems. Customizing AI for specific needs: Every new chat with ChatGPT starts with introducing these basic ...
AI-Enhanced Analysis: Utilize AI to gain insights into customer emotions, pain points, and highlights, ensuring a deeply informed journey map. Interactive and Guided Experience: Our template provides prompts and suggestions, with AI to offer data-backed optimizations for your customer journey strategy. Collaborative Possibilities: Work together ...
Or request AI to go strategic and develop a strategy based on the persona (s). To do that, share your persona (s) with ChatGPT and request it to come up with, for example, a marketing strategy. Prompt: "Create a marketing strategy for churn prevention for the persona below.". 1 2 3.
The future of customer journey mapping with AI looks bright, brimming with potential and ethical responsibility. As technology races forward, businesses will be compelled to adapt or be left behind, all the while ensuring that the customer remains at the heart of every AI-enabled experience.
Pros of Using AI in Customer Journey Mapping: Data-Driven Insights. AI has the remarkable ability to process and analyze vast amounts of data quickly and accurately. For CXers, the process of aligning unstructured data into a cohesive customer journey map can be a complex and time-consuming task.
When you think of the journey map, essentially, a journey map involves understanding the entire flow of all the activities involved, before the product is used, during, and after. Let me give you an example. Let's say, you're trying to build a product to predict customer churn. Now from an AI standpoint, you're really building a ...
Columns capture the five key stages of the user journey: awareness, consideration, decision, purchase, and retention (see below). Rows show customer experiences across these stages—their thoughts, feelings, and pain points. These experiences are rated as good, neutral, and bad. To see how this works, consider a practical example.
Craig Douglas. March 28, 2024. User journey mapping is a powerful tool that helps businesses understand and improve the customer experience. By visually representing the customer journey, companies can identify key interactions, or touchpoints, where customers engage with their brand. This process involves detailed user research to gather ...
Journey maps are a great way to externalize and communicate the user's behavior and underlying motivation, and as a tool to humanize them. Journey maps help create empathy in teams to ideate against. A journey map is useful at many stages during the design process to illustrate complicated ideas and processes in a simple, visual way. During ...
AI journey mapping isn't a one-person job, and AI implementation isn't either. As noted above, it's something that needs to be done with a focus on the enterprise, rather than a specific job ...
Customer journey mapping is critical when designing Сonversational AI experiences. When businesses invest in AI, it's often added to new conversational channels, becoming the new, more efficient home for existing use cases that may currently require interactions with multiple websites or GUIs. These use cases need to go beyond reducing wait ...
Definition of a Journey Map. Definition: A journey map is a visualization of the process that a person goes through in order to accomplish a goal. In its most basic form, journey mapping starts by compiling a series of user actions into a timeline. Next, the timeline is fleshed out with user thoughts and emotions in order to create a narrative.
The specific path visualized in the sepsis AI tool algorithm journey map is highly circuitous, confusing, and not meant to ever be repeated. Organizations, including ours, must actively streamline ...
AI insights. AI in customer journey mapping now offers unprecedented levels of personalization and real-time insights, reshaping best practices in the field. Orchestration upgrade. Customer ...
Generate a new journey . Note: Some users must enable Journey AI on their organization's behalf before following the steps below. If we require this step from you, you'll see "Activate Journey AI" in the main dashboard. Click "Map a Journey with AI" from your dashboard. Choose to start with a template or from scratch.
As AI continues to advance, so does its impact on Journey Mapping. The integration of technologies like natural language processing and computer vision promises even richer insights into customer ...
Creating a customer journey map as a team helps bring new perspectives to the table. It's also easier to align with a shared vision of what customers go through and what needs to be improved on. When solutions are formed and planned, it's then easier to assign responsibilities for each touchpoint and channel.
By applying machine learning techniques, AI can uncover hidden insights and map the typical paths customers take during their journeys. This helps businesses understand common touchpoints, behaviors, and the decision-making process of customers. 3. Customer Segmentation.
Geographic data analysis: AI can be used to analyze large geographic data sets to identify patterns, trends and relationships. Data visualization: AI can be used to create visually appealing and informative maps that communicate complex ideas clearly and concisely. Interactive maps: AI can be used to create interactive maps that allow users to explore data and perform queries in real time.
AI also powers Google Maps' Immersive View, which gives users a navigable fly-over view of 13 cities and more than 500 global landmarks that users can zoom in on like in a video game, with ...