- Skip to Main
- Skip to Resources
- Search Regional Data Hub

State Tourism Satellite Account
- Source organisations
The State Tourism Satellite Account (STSA) highlights the importance of tourism to each state and territory's economy. Key data includes consumption, Gross State Product (GSP), and employment.
Data and Resources
The State Tourism Satellite Account (STSA) highlights the importance of...
- More information
- Go to resource
Labour Force
State or territory, additional info.
Australian National Accounts: Tourism Satellite Account
Estimates of tourism’s direct contribution to the economy including GDP, value added, employment and consumption by product and industry
- Australian National Accounts: Tourism Satellite Account Reference Period 2021-22 financial year
- Australian National Accounts: Tourism Satellite Account Reference Period 2020-21 financial year
- Australian National Accounts: Tourism Satellite Account Reference Period 2019-20 financial year
- View all releases
Key statistics
- Tourism gross domestic product (GDP) rose 60.1% to $57.1b in chain volume terms in 2022-23 but remains below the 2018-19 peak of $63.4b.
- Tourism's contribution to economy GDP rose to 2.5% in 2022-23 but remains below the 2018-19 level of 3.1%.
- Domestic tourism consumption rose by $34.9b to $124.9b in 2022-23 while international tourism rose by $17.7b to $23.6b in chain volume terms.
- Tourism filled jobs rose to 626,400 in 2022-23 but remains below the 2018-19 peak of 700,900 filled jobs.
- Download table as CSV
- Download table as XLSX
- Download graph as PNG image
- Download graph as JPG image
- Download graph as SVG Vector image
(a) As the reference period for chain volume measures is 2021-22, chain volume measures and current prices are identical in 2021-22.
Direct tourism
All references to "tourism" are referring to "direct tourism" unless otherwise specified. A direct tourism impact occurs where there is a direct (physical and economic) relationship between the visitor and producer of a good or service. For more information, refer to the Methodology section.
Gross Domestic product
- In current price terms, tourism GDP rose 76.6% to $63.0b in 2022-23 to be above the 2018-19 level of $60.3b. Of this, tourism GVA was $57.2b and tourism net taxes on products $5.7b.
- In chain volume terms, tourism GDP rose 60.1% in 2022-23 but stands at 90.1% of its 2018-19 level.
Consumption
- In purchasers' price terms, domestic consumption increased 53.7% to $138.4b in 2022-23, the highest level in the time series.
- In chain volume terms , domestic consumption increased 38.8% to $124.9b in 2022-23, the highest level in the time series.
- In purchasers' price terms, international consumption increased from $5.9b to $26.1b in 2022-23 but remains well below the 2018-19 level of $39.3b.
- In chain volume terms, international consumption increased from $5.9b to $23.6b in 2022-23 but remains well below the 2018-19 level of $42.5b.
Industry gross value added, current prices
- The accommodation industry's GVA increased to $7.7b in 2022-23 which is 25.5% higher than the 2018-19 level of $6.2b.
- The cafes, restaurants and takeaway food services industry's GVA increased to $7.0b which is 17.6% higher than the 2018-19 level of $5.9b.
- The travel agency and information centre services industry's GVA increased to $6.1b which is 7.8% higher than the 2018-19 level of $5.7b.
- The air, water and other transport industry's GVA increased to $7.1b but remains 9.2% below the 2018-19 level of $7.9b.
- The education and training industry's GVA increased from $1.2b to $3.2b but remains 47.9% below the 2018-19 level of $6.1b.
Tourism employment
- Tourism accounted for 4.1% of the filled jobs in the whole economy in 2022-23 but this is still lower than the 5.1% of filled jobs in 2018-19.
- The greatest increases in filled jobs in 2022-23 occurred in cafes, restaurants and takeaway food services (up 58,100 jobs), retail trade (up 32,500 jobs), accommodation (up 22,900 jobs) and education and training (up 19,600 jobs).
- Increases were recorded in both full-time filled jobs (up 46.0% to 317,600 jobs) and part-time filled jobs (up 37.2% to 308,800 jobs) in 2022-23.
- In 2022-23, filled jobs worked by females increased more than those filled by males with increases of 42.9% to 345,500 jobs and 39.9% to 280,900 jobs respectively.
Key considerations in data interpretation
Tourism estimates.
The International Visitor Survey (IVS) data sourced from Tourism Research Australia (TRA) is one of the key inputs to this account. Due to the COIVD-19 pandemic, IVS interviews were paused from June quarter 2020 to June quarter 2022 and data were imputed. Full sampling interviewing returned from March quarter 2023. Following a review by the TRA of the imputation method and changes to ABS Overseas Arrivals and Departures data used for IVS benchmarking, data for 2021-22 has been revised.
For more information see International Visitor Survey Methodology and Overseas Arrivals and Departures .
Changes in this issue
New process to derive economic measures.
This publication includes a methodological update. This update was undertaken to modernise the processing system and enhance the methodology. Consequently, the estimates for the 2019-20, 2020-21 and 2021-22 periods, which were previously published, have been revised. For an overview of the updated methodology, please refer to the Methodology page.
Status in employment
The term ‘status in employment’ has been changed to full-time and part-time employment to be consistent with Labour Force, Australia .
Updated job distribution in transport
The jobs that were previously reported under rail transport are now included in the air, water, and other transport industry.
Analysis of results
The contribution of tourism to the Australian economy has been measured using the demand generated by visitors and the supply of tourism products by domestic producers.
The diagram below provides a graphical depiction of the flow of tourism consumption through the Australian economy in 2022-23. What the diagram highlights is that, unlike traditional ANZSIC industries in the Australian National Accounts, tourism is not measured by the output of a single industry, but rather from the demand side i.e. the activities of visitors. It is the products that visitors consume that define what the tourism economy produces. The diagram shows how the value of internal tourism consumption (as measured by the sum of international and domestic tourism consumption in purchaser's prices, i.e. the price the visitor pays) is disaggregated to either form part of tourism GVA/tourism GDP, is excluded as it forms part of the "second round" indirect effects of tourism, or is output that was not domestically produced.
Flow of tourism consumption through the Australian Economy (a)(b)(c)
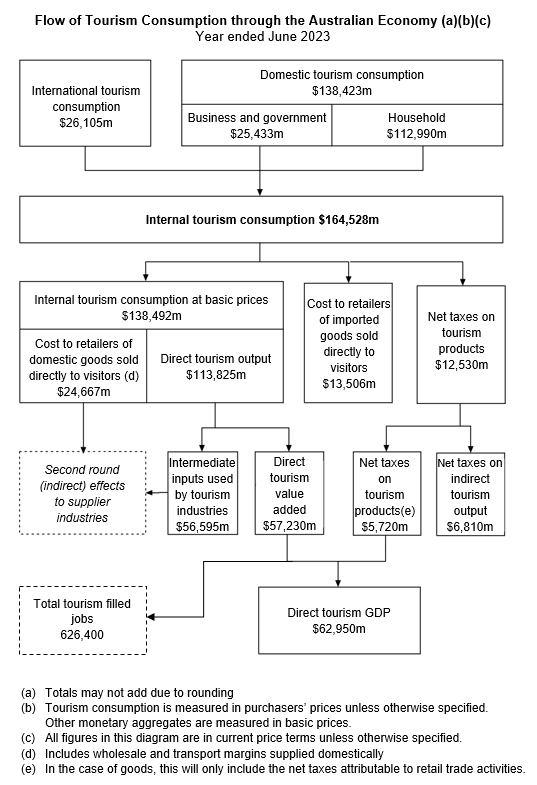
A flow chart representing the flow of tourism consumption through the Australian economy, year ending June 2023. Note, totals may not add due to rounding; tourism consumption is measured in purchasers’ prices unless otherwise specified. Other monetary aggregates are measured in basic prices; all figures in this diagram are in current price terms unless otherwise specified. Domestic tourist consumption to the value of $138,423 million is comprised of business and government, to the value of $25,433 million, and household, to the value of $112,990 million. International tourism consumption, to the value of $26,105 million, combines with domestic tourist consumption to create internal tourism consumption, to the value of $164,528 million. Internal tourism consumption splits into three values; internal tourism consumption at basic prices, to the value of $138,492 million; cost to retailers of imported goods sold directly to visitors, to the value of $13,506 million, and net taxes on tourism products to the value of $12,530 million. Internal tourism consumption at basic prices is comprised of cost to retailers of domestic goods sold directly to visitors, including wholesale and transport margins supplied domestically, to the value of $24,667 million; and direct tourism output, to the value of $113,825 million. Direct tourism output flows into two values; intermediate inputs used by tourism industries, to the value of $56,595 million; and direct tourism value added, to the value of $57,230 million. Cost to retailers of domestic goods sold directly to visitors and intermediate inputs used by tourism industries connect to second round (indirect) effects to supplier industries. Net taxes on tourism products flows into two values; net taxes on tourism products (in the case of goods, this will only include the net taxes attributable to retail trade activities), to the value of $5,720 million; and net taxes on indirect tourism output to the value of $6,810 million. Direct tourism value added and net taxes on tourism products combine to create direct tourism GDP, to the value of $62,950 million. Direct tourism value added is used to estimate total tourism employed persons, to the value of 626,400 tourism filled jobs.
Revisions are a necessary and expected part of accounts compilation as data sources are updated and improved over time. This issue includes revisions to tourism aggregates from 2019-20 to 2021-22. Revisions in the 2022-23 release include:
- Revisions to both domestic and international tourism expenditure as a result of the TSA annual balancing and confrontation process. This is particularly the case for tourism products where the estimates have been modelled using a range of source data.
- Replacing modelled 2021-22 net taxes, imports and margins data with the latest issue of Australian National Accounts: Supply Use Tables (available on a T-1 basis) for 2021-22.
- Revisions related to the new process to derive economic measures.
- Revisions to international tourism consumption due to the incorporation of updated 2021-22 data from Tourism Research Australia and updated data from the Survey of International Trade in Services for 2020-21 and 2021-22.
Please note, the revisions to the chain volume level estimates across the time series are an expected part of re-referencing the indexes to 100 in the reference year.
Data downloads
Australian national accounts: tourism satellite account, create your own tables and visualisations.
ABS provide access to a number of other datasets for you to create your own tables and make visualisations. See what's available in Data Explorer .
Caution: Data in Data Explorer is currently released after the 11:30am release on the ABS website. Please check the reference period when using Data Explorer. For information on Data Explorer and how it works, see the Data Explorer user guide .
For further information about these and related statistics, please contact the Customer Assistance Service via the ABS website Contact Us page. The ABS Privacy Policy outlines how the ABS will handle any personal information that you provide to us.
Previous catalogue number
This release previously used catalogue number 5249.0.
Methodology
Do you need more detailed statistics, request data.
We can provide customised data to meet your requirements
Microdata and TableBuilder
We can provide access to detailed, customisable data on selected topics
An official website of the United States government
- Outdoor Recreation Satellite Account, U.S. and States, 2020
- News Release
- Related Materials
- Additional Information
Outdoor Recreation Satellite Account, U.S. and States, 2020 New statistics for 2020; prior years updated
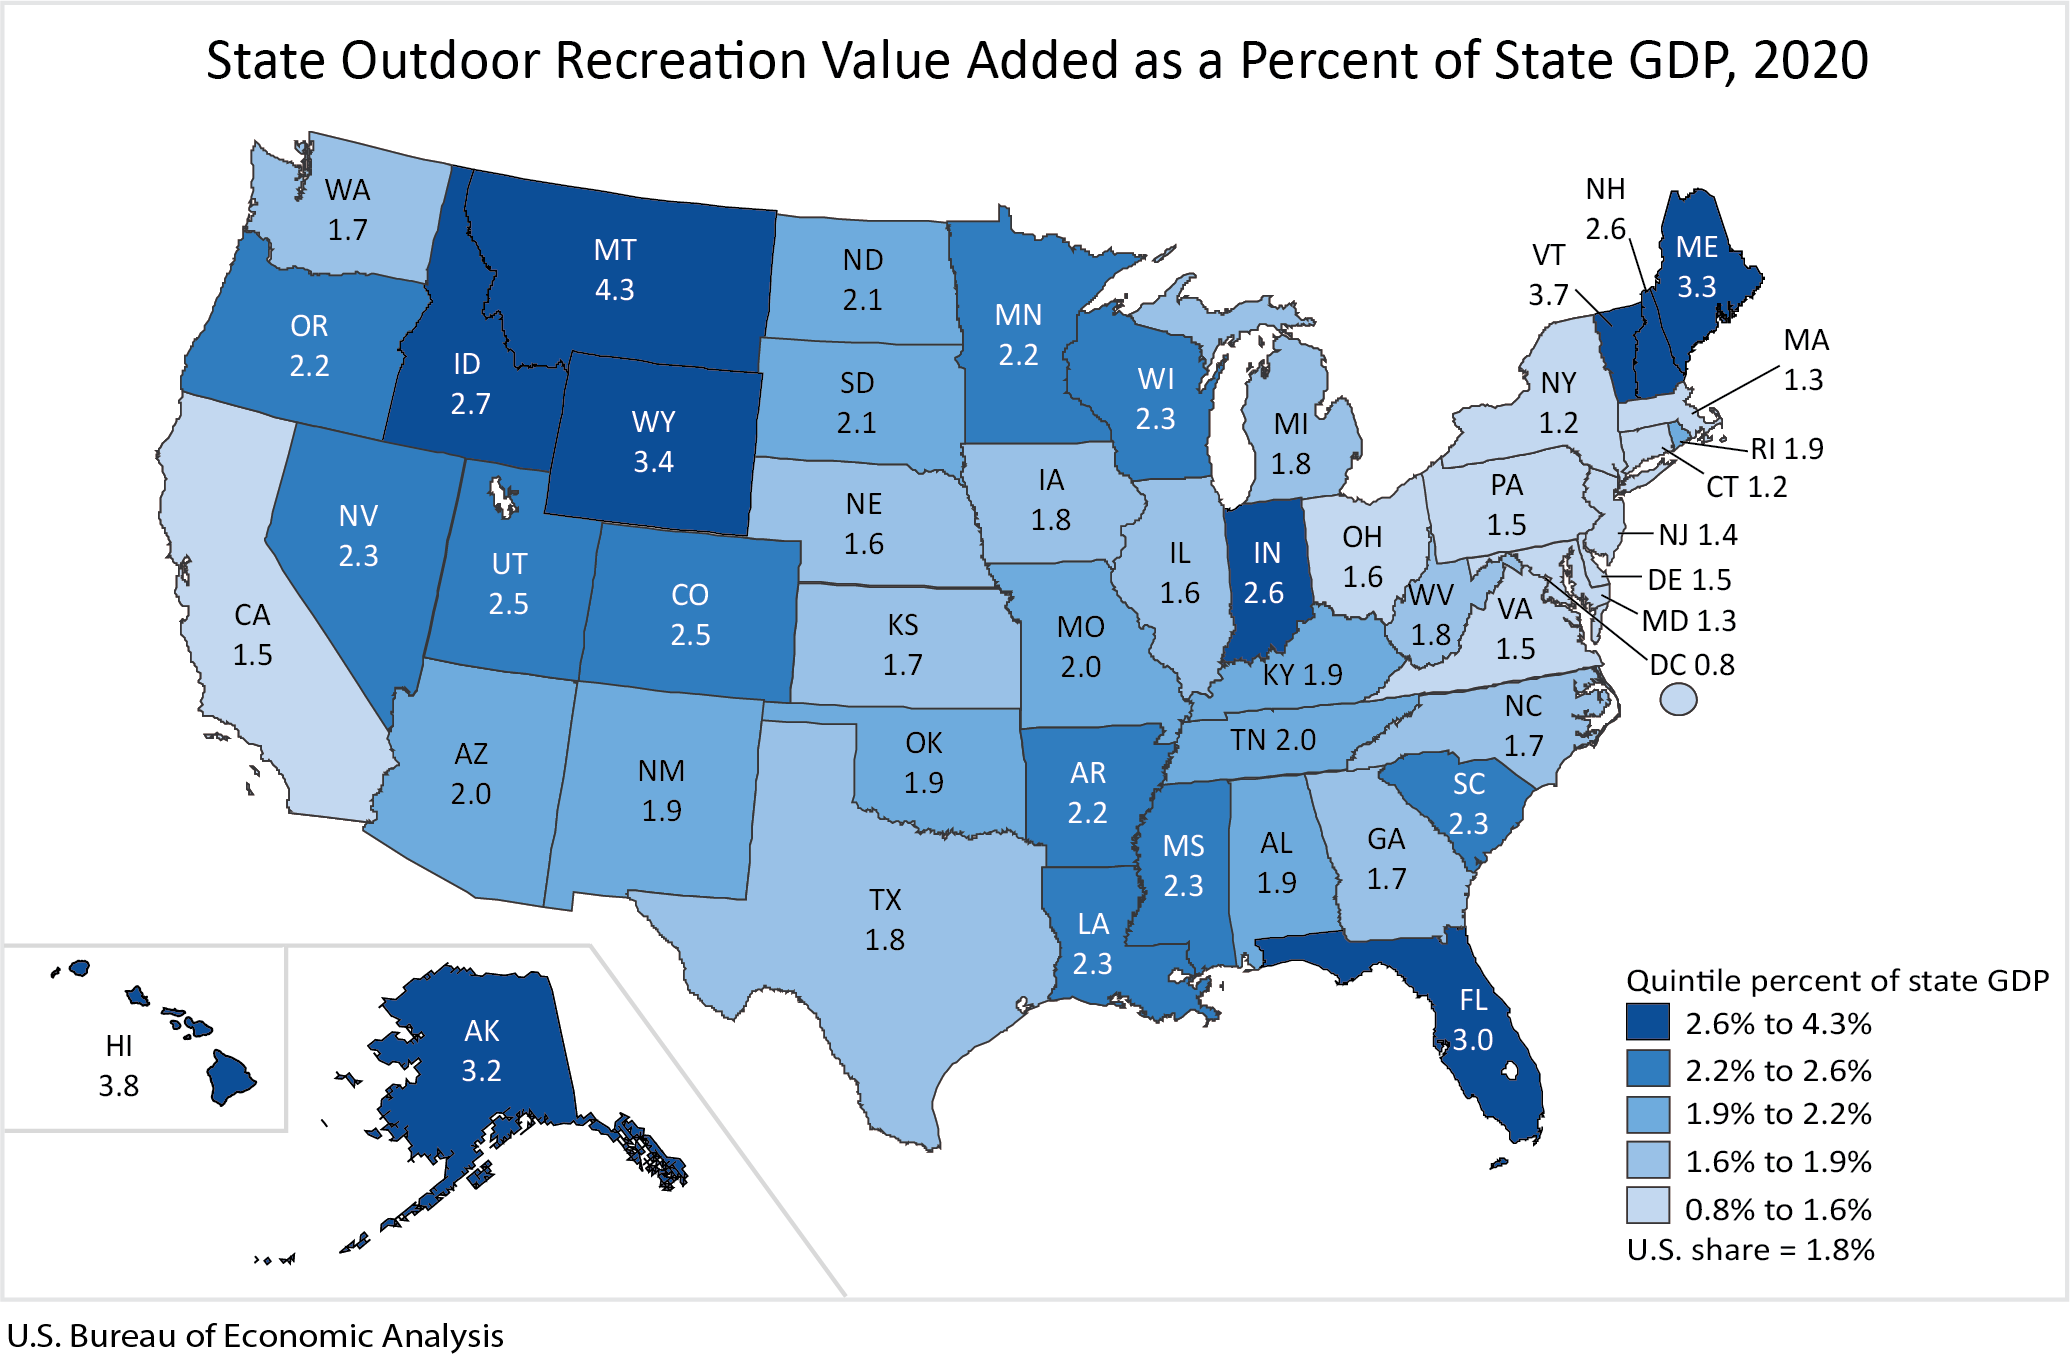
The U.S. Bureau of Economic Analysis (BEA) released statistics today measuring the outdoor recreation economy for the nation, all 50 states, and the District of Columbia. The new U.S. data show that the outdoor recreation economy accounted for 1.8 percent ($374.3 billion) of current-dollar gross domestic product (GDP) for the nation in 2020 (national table 3). At the state level, outdoor recreation value added as a share of state GDP ranged from 4.3 percent in Montana to 1.2 percent in New York and Connecticut. The share was 0.8 percent in the District of Columbia.
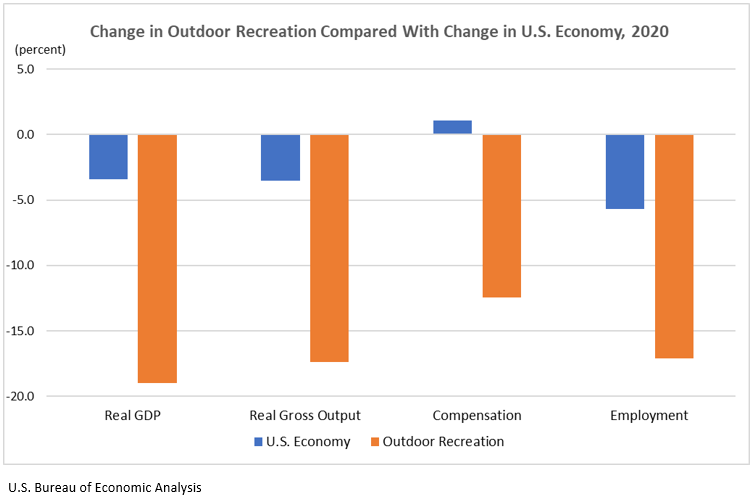
Inflation-adjusted (real) GDP for the outdoor recreation economy decreased 19.0 percent from 2019 to 2020, compared with a 3.4 percent decrease for the overall U.S. economy. Real gross output for the outdoor recreation economy decreased 17.4 percent, while outdoor recreation compensation decreased 12.5 percent and employment decreased 17.1 percent.
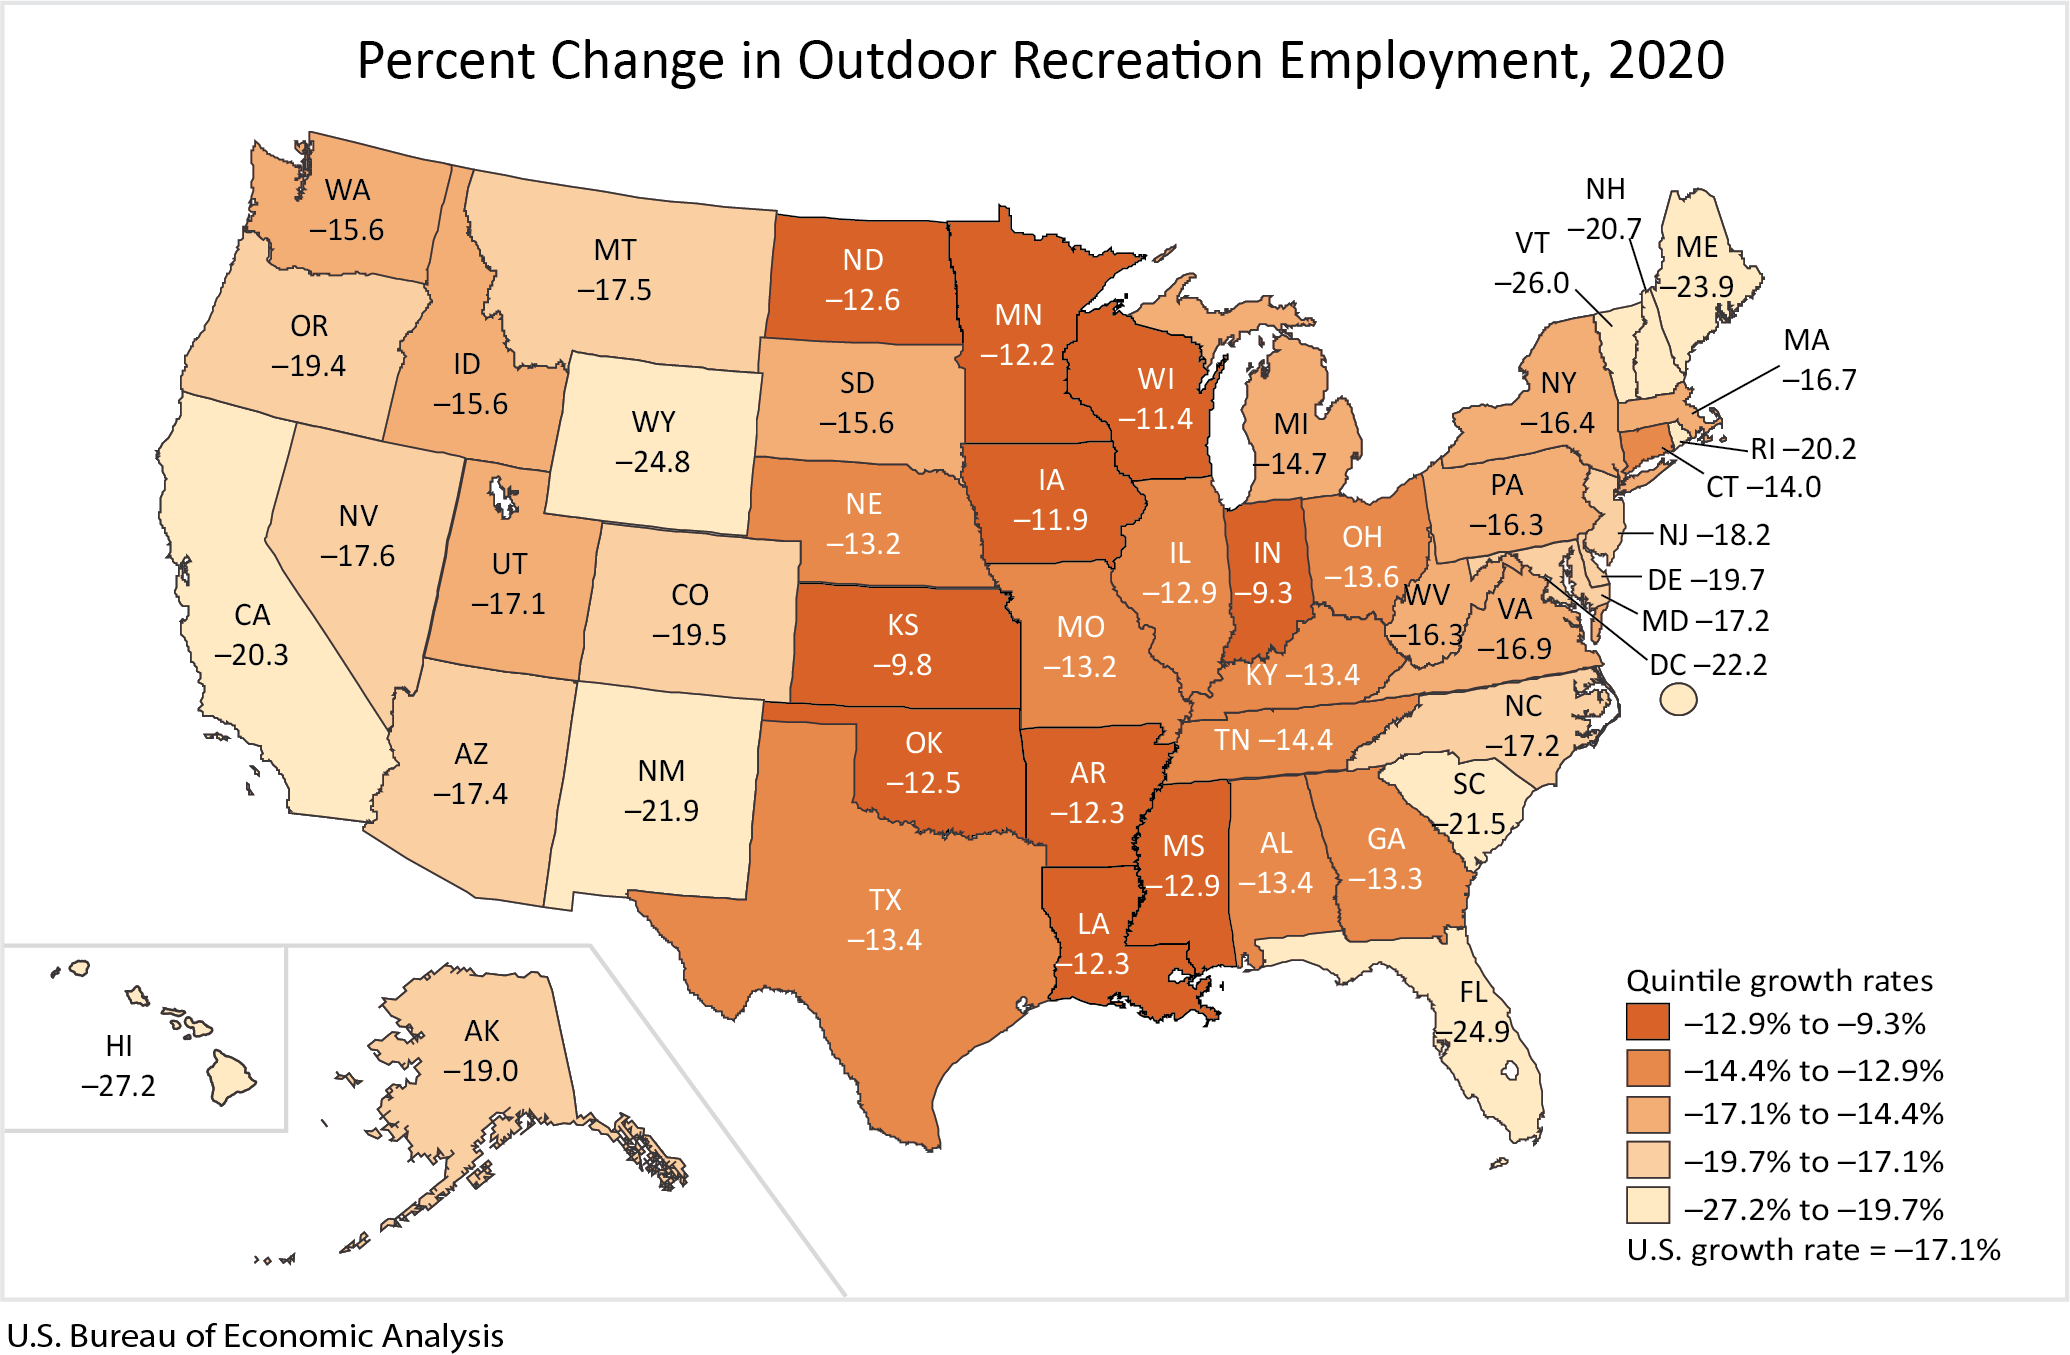
Across all 50 states and the District of Columbia, outdoor recreation employment decreased in 2020, ranging from –9.3 percent in Indiana to –27.2 percent in Hawaii.

Outdoor recreation by activity
Outdoor recreation activities fall into three general categories: conventional activities (such as bicycling, boating, hiking, and hunting); other core activities (such as gardening and outdoor concerts); and supporting activities (such as construction, travel and tourism, local trips, and government expenditures).
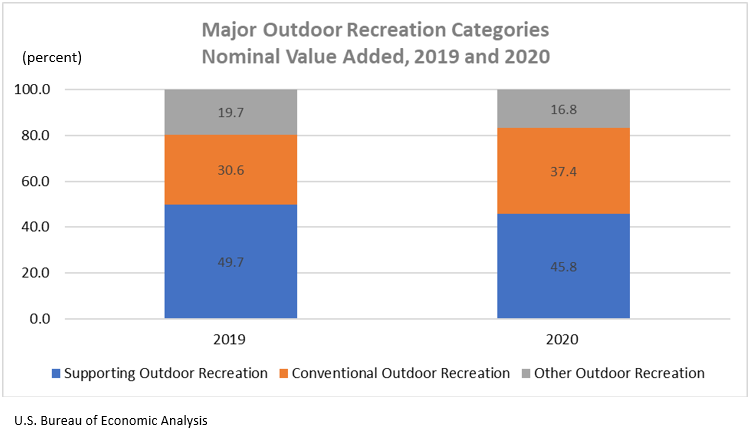
In 2020, conventional outdoor recreation accounted for 37.4 percent of U.S. outdoor recreation value added, compared with 30.6 percent in 2019. The increase was due to higher spending on boating/fishing and RVing. Other outdoor recreation accounted for 16.8 percent of value added in 2020, compared with 19.7 percent in 2019. The decrease was driven by amusement parks/water parks and festivals/sporting events/concerts. Supporting activities accounted for the remaining 45.8 percent of value added in 2020, compared with 49.7 percent in 2019. Supporting activities, particularly travel and tourism-related activities, declined in 2020 during the COVID-19 pandemic as consumers traveled less and reduced spending at hotels and restaurants.
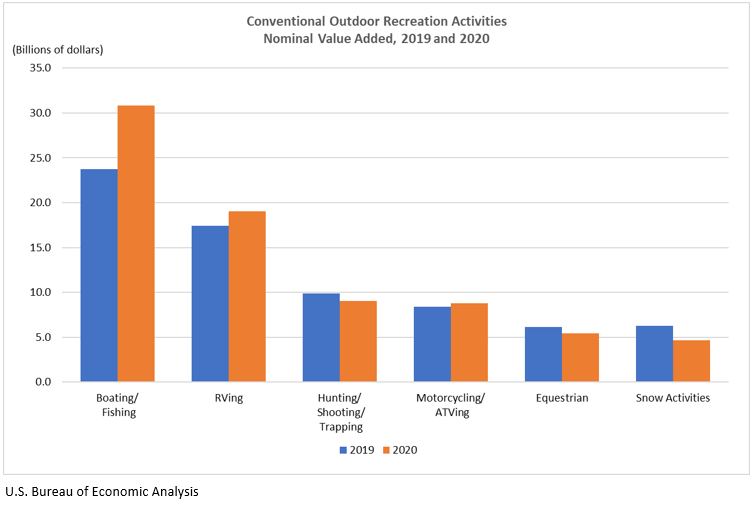
Additional value added by activity highlights for 2020 include:
- Boating/fishing was the largest conventional activity for the nation as a whole at $30.8 billion in current-dollar value added and was the largest conventional activity in 39 states and the District of Columbia. Florida ($3.8 billion), California ($2.8 billion), and Texas ($2.8 billion) were the largest contributors to U.S. value added for the activity (state table 2).
- RVing was the second-largest conventional activity nationally at $19.1 billion in current-dollar value added and was the largest conventional activity in five states. The largest contributors were Indiana ($3.4 billion) and Texas ($1.7 billion).
- Snow activities was the largest conventional activity in Colorado ($1.2 billion), Utah ($468.0 million), Vermont ($191.3 million), and Wyoming ($92.2 million) in current-dollar value added. At the national level, current-dollar value added for snow activities was $4.7 billion.
Outdoor recreation by industry
The outdoor recreation by industry data show the contribution of different industries to the outdoor recreation economy, including their impact on value added, gross output, employment, and compensation.
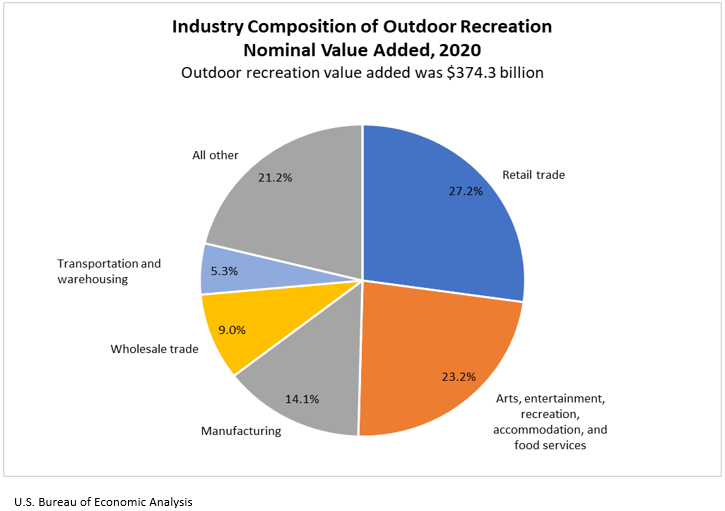
For the nation, the retail trade sector was the largest contributor to U.S. outdoor recreation value added in 2020, accounting for $101.9 billion (national table 6). At the state level, retail trade was the largest contributor to outdoor recreation value added in 35 states. The leading contributors were California ($11.6 billion), Florida ($8.8 billion), and Texas ($8.6 billion) (state table 3).
Additional value added by industry highlights for 2020 include:
- Arts, entertainment, recreation, accommodation, and food services, the second-largest sector, contributed $86.8 billion in current-dollar value added to outdoor recreation nationally. At the state level, this industry was the largest contributor to outdoor recreation in 13 states and the District of Columbia.
- Manufacturing, the third-largest sector, contributed $52.8 billion nationally to the outdoor recreation economy. At the state level, this sector was the largest contributor to the outdoor recreation economy in Indiana ($5.3 billion) and Wisconsin ($1.9 billion).
Full Release & Tables (PDF)
Highlights (pdf), tables - national level (excel), tables - state level (excel), interactive state tables.
- Regional Stanislaw Rzeznik 301-278-9458 [email protected]
- National Patricia Washington 301-278-9114 [email protected]
- Media (BEA) Connie O'Connell 301-278-9003 [email protected]
- Information on COVID-19 and recovery impacts is available on our website .
- Find the latest information on the Outdoor Recreation Satellite Account at BEA's outdoor recreation website .
- Historical time series for these estimates can be accessed in BEA's Interactive Data Application .
- Stay informed about BEA developments by reading The BEA Wire , signing up for BEA's email subscription service , or following BEA on Twitter @BEA_News .
- Access BEA data by registering for BEA's Data Application Programming Interface .
- For more on BEA's statistics, see our monthly online journal, the Survey of Current Business .
- For upcoming economic indicators, see BEA's news release schedule .
- Details on the preparation of BEA's national statistics are in NIPA Handbook: Concepts and Methods of the U.S. National Income and Product Accounts .
- Complete information on the sources and methods for the estimation of BEA's state personal income and employment .
Definitions
Gross domestic product (GDP) or value added is the value of the goods and services produced by the nation's economy less the value of the goods and services used up in production. GDP is also equal to the sum of personal consumption expenditures, gross private domestic investment, net exports of goods and services, and government consumption expenditures and gross investment.
Gross output is the value of the goods and services produced by the nation's economy. It is principally measured using industry sales or receipts, including sales to final users (GDP) and sales to other industries.
Current-dollar estimates are valued in the prices of the period when the transactions occurred–that is, at "market value." Also referred to as "nominal estimates" or as "current-price estimates."
Chained-dollar estimates are calculated by taking the current-dollar level of a series in the base period and multiplying it by the change in the chained-type quantity index number for the series since the base period. Chained-dollar estimates correctly show growth rates for a series but are not additive in periods other than the base period.
ORSA employment consists of all full-time, part-time, and temporary wage-and-salary jobs in which the workers are engaged in the production of outdoor recreation goods and services. Self-employed individuals are excluded from employment totals.
ORSA compensation consists of the pay to employees (including wages and salaries and benefits such as employer contributions to pension and health funds) in return for their outdoor recreation-related work during a given year. Pay to the self-employed is excluded from compensation but included in value added.
ORSA value added (also referred to as GDP) consists of the value of outdoor recreation goods and services produced less the value of expenses incurred for their production. The activity of self-employed individuals is included in value added.
Geography of outdoor recreation
Outdoor recreation is measured by place of production, not residence of consumer. The value of manufactured goods, such as boats, is assigned to the state where they are produced, even if the goods are not ultimately used there. Services, such as sailing lessons, are assigned to the location where they are consumed. The value of services provided by retailers, such as boat dealers, is also assigned to the location of sale. The services of retailers (known as trade margins) are not measured by sales but are most akin to sales less the cost of goods sold. The production of imported goods is excluded from ORSA, but the value of the services of retailers selling the imported goods is included.
Outdoor recreation spending and production are allocated to states by applying state-level data to detailed, underlying national values. The underlying estimates are distributed to states before aggregation to publication levels to provide the most accurate state values possible. Statistics are primarily based on time-series data generated from the Economic Census and Quarterly Census of Employment and Wages. Additional government and nongovernment data sources are used to supplement the census data and to refine and evaluate the statistics.
List of National-Level News Release Tables
Table 1. Real Outdoor Recreation Value Added by Activity
Table 2. Outdoor Recreation Value Added by Activity
Table 3. Outdoor Recreation Value Added by Activity as a Percentage of Gross Domestic Product
Table 4. Outdoor Recreation Value Added by Activity as a Percentage of Total Outdoor Recreation Value Added
Table 5. Real Outdoor Recreation Value Added by Industry
Table 6. Outdoor Recreation Value Added by Industry
Table 7. Real Outdoor Recreation Gross Output by Activity
Table 8. Outdoor Recreation Gross Output by Activity
Table 9. Real Outdoor Recreation Gross Output by Industry
Table 10. Outdoor Recreation Gross Output by Industry
Search by keyword
Tourism satellite accounts in europe – 2023 edition.
Tourism plays an important role in many countries’ economies and labour markets. Tourism Satellite Accounts (TSA) is a framework developed to quantify the importance of tourism. This publication disseminates national results for a set of key TSA indicators for EU and EFTA countries, submitted on a voluntary basis to Eurostat, and is a follow-up of the publication Tourism Satellite Accounts in Europe of 2019. The publication focuses on data for the reference year 2019, but also includes an ad-hoc chapter using partial data for 2020 and giving preliminary insights on the impact of the COVID-19 pandemic on the European tourism sector.
Additional information
- Product code: KS-FT-22-011
- ISBN 978-92-76-60228-6
- ISSN 2529-3222
- doi: 10.2785/7794
- Themes: Industry, trade and services
- Collection: Statistical reports
Previous editions
Tourism Satellite Accounts in Europe — 2019 edition 09‑12‑2019
Tourism Satellite Accounts in Europe 16‑02‑2017
Top Things to Do in Krasnodar - Krasnodar Must-See Attractions
Things to do in krasnodar, explore popular experiences, top attractions in krasnodar.

Other Top Attractions around Krasnodar

What travelers are saying

- Galitskogo Park
- Stadium FC Krasnodar
- Botanical Garden of Professor I. S. Kosenko
- The Solnechny Ostrov (Sunny Island) Park
- Chistyakovskiy Grove Park
- Safari Park
- Monument to Catherine the Great
- Monument Shurik and Lidochka
National Tourism Satellite Account 2020-21
An annual data product examining Australia’s tourism performance through an economic lens.
Main content
The Tourism Satellite Account (TSA) examines Australia’s tourism performance through an economic lens. This summary looks at the 2020-21 financial year and compares performance with earlier years.
Impacts of COVID-19
COVID-19 had severe impacts throughout 2020-21. These included:
- closing Australian borders to almost all international visitors
- state and territory border closures
- widespread lockdowns and travel restrictions
- capacity limits on tourism businesses and venues
- fewer domestic flights
- temporary closures of many hotels, motels and serviced apartments
- travel hesitancy from health or safety concerns.
We use TSA data from the Australian Bureau of Statistics (ABS) to report on the:
- value of goods and services consumed by visitors
- tourism contribution to Gross Domestic Product (GDP), international trade and employment.
Key results
Total tourism consumption fell by 33.1% or $41.3 billion in 2020-21. This is down 45.3% on pre-pandemic levels. This resulted in:
- A 36.7% fall in tourism GDP from $51.2 billion in 2019-20 to $32.4 billion in 2020-21. Tourism GDP was 46.4% lower in 2020-21 than in 2018-19.
- Tourism GDP as a share of the national economy fell from 2.6% in 2019-20 to 1.6% in 2020-21. This compares to a 3.1% share of the national economy in 2018-19.
- Tourism employment fell by 20.3% from 636,200 workers in 2019-20 to 507,000 workers in 2020-21. Since 2018-19, Australia’s tourism workforce has fallen by 24.8%, or 167,400 workers.
- Tourism’s share of the national workforce fell from 5.0% in 2019-20 to 3.9% in 2020-21. In 2018-19 tourism accounted for 5.3% of the Australian workforce or one-in-nineteen jobs.
In 2020-21:
- Tourism exports fell to $1.7 billion. This is down 94.9% from 2019-20. Tourism exports are from international visitors spending money on Australian goods and services.
- Tourism imports fell to $1.5 billion. This is down 96.3% from 2019-20. Tourism imports are the money Australian residents spend when travelling overseas.
Tourism consumption results
Tourism consumption was $83.4 billion in 2020-21. This was 33.1% down (or $41.3 billion) on the previous year. Consumption was down 45.3% ($69.1 billion) from the pre-pandemic level in 2018-19.
These results reflect a fall in visitor spend over the course of the pandemic. TRA’s visitor surveys show that total spend for 2020-21 was down 38.9% ($51.6 billion) on 2018-19. This fall in spend comprised:
- $30.0 billion fall in international spend in Australia (down 97.6%)
- $16.1 billion fall in domestic overnight spend (down 20.8%)
- $5.4 billion fall in daytrip spend (down 22.1%).
Australia’s tourism industry was almost entirely dependent on domestic travel in 2020-21.
The fall in tourism consumption had varying impacts on different parts of Australia’s visitor economy. Figure 1 shows the most severe impacts were for:
- transport - down 45.6% on 2019-20 and down 59.2% on 2018-19
- travel agency and information centre services - down 26.8% on 2019-20 and down 41.6% on 2018-19
- recreation, cultural and gambling - down 29.0% on 2019-20 and down 43.2% on 2018-19
- accommodation and food services - down 16.4% on 2019-20 and down 31.5% on 2018-19
- education services - down 96.4% on 2019-20 and down 96.0% on 2018-19.
help Hover over columns to show consumption data
Source: Australian Bureau of Statistics, Australian National Accounts: Tourism Satellite Account 2020-21 , December 2021
GDP from tourism
GDP from tourism was $32.4 billion in 2020-21. This was a fall of 36.7% on 2019-20 and 46.4% lower than 2018-19. Figure 2 shows it is the lowest tourism GDP result since 2005-06.
National GDP grew by 1.8% in 2019-20. In 2020-21 it grew a further 4.3%. As a result, tourism’s share of all economic activity fell from 3.1% in 2018-19 to 2.6% in 2019-20. It fell to 1.6% in 2020-21.
help Hover on lines and columns to show GDP data
Tourism exports and imports
Due to international travel restrictions, tourism exports and imports in 2020-21 were far lower than at any point in the past 17 years (Figure 3).
Tourism’s export value comes from international visitors spending on Australian goods and services.
The value of tourism exports was $1.7 billion in 2020-21. This was down 94.9% compared with 2019-20. This is consistent with the 97.8% fall in international visitor numbers (overseas arrivals and departures) and 96.8% fall in spend (international visitor survey).
Tourism imports are from Australian residents spending during overseas travel.
The value of tourism imports was $1.5 billion in 2020-21. This was 96.3% lower than the $40.8 billion of imports for 2019-20 and 97.4% lower than the $58.1 billion of imports for 2018-19. This is consistent with a 97.5% fall in outbound travel since 2018-19.
help Hover on lines to show tourism trade data
Source: Australian Bureau of Statistics, Australian National Accounts: Tourism Satellite Account 2020-21 , December 2021
Tourism employment
Tourism employment did not fall as sharply as consumption or GDP. Employers were able to keep workers by accessing support packages and reducing hours. Maintaining and growing the tourism workforce will be a priority as demand for domestic tourism recovers.
There were 507,000 workers employed in tourism in 2020-21. This was 20.3% lower than the 636,200 working in 2019-20. It is approximately the same employment number as for 2009-10 (Figure 4).
help Hover on lines and columns to show employment data
Australia’s workforce grew 1.1%. As a result, tourism’s share of Australian employment in 2020-21 fell from 5.0% to 3.9%. In 2018-19, before the COVID-19 pandemic, tourism employed 674,600 workers, which was 5.3% of Australia’s workforce.
Staff worked fewer hours on average. There was a 26.1% fall in full-time tourism workers in 2020-21 and a 13.7% fall in the part-time workforce.
The employment figure is an average for 2020-21. ABS quarterly tourism labour statistics show:
- tourism jobs peaked at 745,100 jobs in the December quarter 2019
- the number of tourism jobs fell 19% to 606,500 jobs at June 2020
- numbers have since improved with 675,600 tourism jobs at June 2021.
Contact TRA
mail tourism.research@tra.gov.au
Footer content

IMAGES
VIDEO
COMMENTS
The State Tourism Satellite Account (STSA) 2020-21 highlights the importance of tourism to each state and territory economy. COVID-19 caused severe disruptions to tourism in the last quarter of 2019-20 and through all of 2020-21. This 2020-21 edition of the STSA is the first to: describe where the largest impacts occurred.
In 2020-21 there were 37,300 direct tourism jobs in South Australia. This was a decrease of 2,600 jobs compared to the previous period and a total decrease of 3,600 jobs since the pre-COVID period. In 2020-21 there were an additional 19,200 people indirectly employed in tourism. Tourism contributed $2.6 billion to Gross State Product in 2020-21.
Total tourism demand in the form of visitor spend in Australia in 2021-22 was $94.4 billion (Figure 1 below). This was up 17% or $13.5 billion on 2020-21 but down 29% or $38.2 billion on 2018-19 (pre-pandemic): domestic day trip visitor spend was up 8% on 2020-21 but still 16% below the pre-pandemic level.
Tourism Satellite Accounts Data. ... Tourism Satellite Accounts 2020 XLS; Tourism Satellite Accounts 2019 XLS; Tourism Satellite Accounts 2018 XLS; Tourism Satellite Accounts 2017 XLS; Archived files. The following data files are based on Benchmark Supply Use Tables from 2012 and are not directly comparable with data beginning in 2017 to present.
The State Tourism Satellite Account (STSA) 2022-23 highlights the importance of tourism to each state and territory. STSA data tables are useful in understanding: ... Some unwarranted fluctuations observed in the previously published 2021-22 and 2020-21 STSA results. Upon investigation it was found that underlying IVS expenditure ratios used ...
Travel and Tourism Satellite Account for 2018-2022. The travel and tourism industry—as measured by the real output of goods and services sold directly to visitors—increased 21.0 percent in 2022 after increasing 53.6 percent in 2021, according to the most recent statistics from BEA's Travel and Tourism Satellite Account. Read the Article.
The travel and tourism industry—as measured by the real output of goods and services sold directly to visitors—decreased 48.0 percent in 2020 after increasing 1.0 percent in 2019, according to the most recent statistics from the Travel and Tourism Satellite Account (TTSA) of the U.S. Bureau of Economic Analysis (BEA). 1 By comparison, the ...
STATE TOURISM SATELLITE ACCOUNTS 2021-22 SUMMARY Background A National Account is the mechanism by which impact on the economy of a specific industry is measured. Tourism is not a distinct industry such as mining, but rather draws ... (2020-21) and to the pre-COVID year of 2018-19. Note that this data does not include the
The State Tourism Satellite Account (STSA) highlights the importance of tourism to each state and territory's economy. Key data includes consumption, Gross State Product (GSP), and employment.
State Tour ism Satellite Account 2020-21. Topline Results for WA. Prepared by Tourism WA Strategy and Research. March 2021. State Tourism Satellite Account (State TSA) 2020-21. Power BI Desktop. ... State Tourism Satellite Account (State TSA) 2020-21 - FurPower BI Desktop. ther Infor mation.
Australian National Accounts: Tourism Satellite Account Reference Period 2021-22 financial year; Australian National Accounts: ... 2020-21 and 2021-22 periods, which were previously published, have been revised. For an overview of the updated methodology, please refer to the Methodology page. Status in employment.
ACC. AGO. In 2020-21, tourism (direct + indirect) in WA was wor th $6.3 billion by GVA , equivalent to. 1.8% of WA's total GVA. In regional WA , tourism accounts for 2.2% of GVA compared to 1.3% in Destination Per th, demonstrating the impor tance of the tourism industr y in Regional WA. This is par ticularly true.
The Travel and Tourism Satellite Account (TTSA) Top Commodities Supported by Travelers in 2020 . Total output supported by travel demand fell from $1.9 trillion in 2019 to $978 billion in 2020, a decline of 50.1%. The top 10 commodities accounted for 91% of the output supported by travel and tourism in 2020 and 92% of the declin e from 2019.
The travel and tourism industry—as measured by the real output of goods and services sold directly to visitors —increased 64.4 percent in 2021 after decreasing 50.7 percent in 2020, according to the most recent stat istics. from the Travel and Tourism Satellite Account (TTSA) of the U.S. Bureau of Economic Analysis (BEA). By
In 2020, conventional outdoor recreation accounted for 37.4 percent of U.S. outdoor recreation value added, compared with 30.6 percent in 2019. The increase was due to higher spending on boating/fishing and RVing. Other outdoor recreation accounted for 16.8 percent of value added in 2020, compared with 19.7 percent in 2019.
The State Tourism Satellite Account (STSA) highlights the importance of tourism to each state and territory's economy. The 2019-20 edition of the STSA is the first to capture the impacts of the bushfires and the early months of COVID-19 at a state and territory level. It sheds light on where the impacts were felt most deeply.
Tourism Satellite Accounts (TSA) is a framework developed to quantify the importance of tourism. ... The publication focuses on data for the reference year 2019, but also includes an ad-hoc chapter using partial data for 2020 and giving preliminary insights on the impact of the COVID-19 pandemic on the European tourism sector. Additional ...
These are the best places for couples seeking sights & landmarks in Krasnodar: Stadium FC Krasnodar. Monument to Catherine the Great. Monument Shurik and Lidochka. Red Street. Monument A.S. Pushkin. See more sights & landmarks for couples in Krasnodar on Tripadvisor.
The Kovalenko Art Museum of Krasnodar has the longest history among art museums of the Northern Caucasus region. The museum's collection is comprised up to 9 thousand exhibits in such categories as ancient Russian art (icons of XV-XVIII centuries belonging to different art schools), Russian and Soviet art of XVIII - XX centuries, art of Weastern Europe, Asia and Africa.
You can explore summary data by: choosing a state and a tourism region using the drop-down menus. viewing the data for 2020-21 and the change from 2019-20 in the table. hovering over the chart elements to show total result. The Regional Tourism Satellite Accounts present annual data for Australia's tourism regions.
Saratovskaya (rural locality) / 44.70833°N 39.21667°E / 44.70833; 39.21667. Saratovskaya ( Russian: Саратовская) is a rural locality (a stanitsa) under the administrative jurisdiction of the Town of Goryachy Klyuch of Krasnodar Krai, Russia. Population: 6,567 ( 2010 Census); [1] 6,039 ( 2002 Census); [2]
Barrier-free environment as an aspect for the development of accessible ecotourism Dmitry Gura¹*, Nadezhda Kiryunikova¹, Elina Lesovaya¹, and Saida Pshidatok2 ¹ Kuban State Technological University, Moskovskaya Str. 2, 350072, Krasnodar, Russia 2 Kuban State Agrarian University, Kalinina Str. 13, 350044, Krasnodar, Russia Abstract. Nowadays, in the entire palette of famous types of tourism,
The Tourism Satellite Account (TSA) examines Australia's tourism performance through an economic lens. This summary looks at the 2020-21 financial year and compares performance with earlier years. Impacts of COVID-19. COVID-19 had severe impacts throughout 2020-21. These included: closing Australian borders to almost all international visitors