Office for Coastal Management
Tourism and recreation.
Fast Facts / Tourism and Recreation
Tourism and recreation support a wide range of businesses in the nation’s shore-adjacent zip codes, from restaurants, hotels, aquariums, and marinas to boat manufacturers and sporting goods stores. The following facts are based on the latest available economic data 1 (2018).

2.5 Million People
Almost 2.5 million people are employed by ocean-based tourism and recreation.
$66 Billion Earnings
Workers in the ocean-based tourism and recreation sector earned about $65.6 billion in annual wages.
$143 Billion GDP
Ocean-based tourism and recreation contributes approximately $143 billion in gross domestic product to the national economy each year.
An Industry Leader
The ocean-based tourism and recreation sector employs more Americans than the entire real estate industry, as well as more people than building construction and telecommunications combined.
Steady Growth
The industry added 54,000 jobs (2.3 percent growth) from 2017 to 2018—adding jobs at a slightly higher rate than the overall U.S. economy (1.6 percent growth).
In terms of employment, California, Florida, New York, Hawaii, and New Jersey are the five largest contributors to marine-based tourism and recreation, accounting for more than half of this sector’s total employment in 2018. In terms of gross domestic product, New York, California, Florida, Hawaii, and Washington State were the five largest contributors, accounting for more than half the national gross domestic product of this sector in 2018.
Leisure and Hospitality in Coastal Counties
In the larger economic sector of leisure and hospitality*, which includes all hotels and restaurants located in shoreline-adjacent counties, the economic contributions are also substantial. Statistics 2 include the following:
- Employs almost 6.9 million people
- Generates over $196 billion in earnings
- Contributes $427 billion to the gross domestic product
*Note: Economics: National Ocean Watch (ENOW) is a NOAA economics database on the Digital Coast that features time-series data focused on the six economic sectors that are dependent on the oceans and Great Lakes. ENOW's tourism and recreation statistics are good indicators of coastal and ocean tourism because they estimate the ocean-dependent portion of business for hotels and restaurants by including only those establishments located in shore-adjacent zip code areas, and they exclude all forms of sports and entertainment that are not ocean-related.
Statistics for the leisure and hospitality sector, on the other hand, include all hotels and restaurants located anywhere in a shore-adjacent county, many of which are far from the coast and have very little business connected to ocean tourism. These statistics also include activities associated with all forms of sports and entertainment, including sports arenas (e.g., professional baseball and football stadiums), Broadway plays, casinos, and racetracks.

Source: NOAA Office for Coastal Management
1: Economics: National Ocean Watch
2: Total Economy for US Coastal Shoreline Counties
Coastal tourism

EU coastal areas are amongst the most preferred touristic destinations for European and international travellers, making coastal and maritime tourism the biggest, growing sector of the EU Blue Economy in terms of GVA and employment. Coastal tourism comprises recreational activities taking place in the proximity of the sea (such as swimming, sunbathing, coastal walks, and wildlife watching) as well as those taking place in the maritime area, including nautical sports (e.g. sailing, scuba diving, cruising, etc.). Over half of the EU bed capacity is concentrated in regions with a sea border. For the economy of many non-landlocked EU Member States, tourism generates a significant portion of the national revenue. It has a wide-ranging impact on economic growth, employment and social development. Tourism is particularly significant for Southern European countries, such as Spain, Portugal, Italy, Malta and Greece. At the same time, coastal tourism is characterised by high seasonality , with demand concentrated in a limited number of months, usually July and August.
In 2020, Coastal tourism kept generating the largest share of employment and GVA in the EU Blue Economy, with 51% and 26%, respectively. EU Blue Economy Report 2023

The statistics presented in this section originate from the following expenditures by tourists in EU coastal areas: • Accommodation • Transport • Other expenditures (e.g. food, culture, recreational activities, water-sport equipment and clothing).
The sector was hit hard by the COVID-19 pandemic. Because of the COVID-19 pandemic, millions of European citizens suddenly could not travel.
In March 2020, tourism came to a grinding halt, and its turnover did not fully recover until 2022 when the total number of nights spent in EU tourist accommodation reached 2.73 billion (against the pre-pandemic level of 2.88 billion nights in 2019).

In 2022, tourism figures in all months were higher than in 2021, with the fourth quarter of 2022 recording 472 million nights. In total, nights spent went up by 49% compared to 2021 (1.83 billion nights).
In 2020, the GVA generated by the sector amounted to €33.9 billion, down from €81.5 billion registered in 2019, i.e., a year-on-year 58% contraction.
Gross profits, at €3.9 billion, shrunk by more than 85% in 2019.
Click here to read more
While recovering from the Covid-19 pandemic, the Coastal tourism sector has engaged in the sustainability transition with the aim to green its operations, reduce its negative impacts on the marine environment, and strengthen its resilience to exogenous shocks such as commodity and fuel price inflation.
For this purpose, the European Commission has published the Tourism Transition Pathway involving all tourism stakeholders. The updated Industrial Strategy (2021) calls for the acceleration of green and digital transformation to increase the European economy's resilience.
The strategy also identifies 27 initiative areas for the green and digital transition to improve tourism in the EU. These include:
• Regulation and public governance , which includes; improving statistics and indicators for tourism and comprehensive tourism strategies.
• Green and digital transition , which includes; research and innovation projects on circular and climate-friendly tourism and support for digitalisation of tourism SMEs and destinations.
• Resilience , which includes; seamless cross-border travelling, fostering skills in tourism, promoting fairness and equality in tourism jobs, and accessibility.
As part of the EU Sustainable Blue Economy , the coastal and maritime tourism sector has been identified as an area with potential to foster a smart, sustainable and inclusive Europe. The EU's tourism policy aims to keep Europe's position as a leading tourist destination while also maximising the industry's contribution to economic growth and jobs.
![[Bathing boxes on the beach]](https://blue-economy-observatory.ec.europa.eu/sites/default/files/styles/embed_large/public/2022-04/AdobeStock_5838556.jpeg?itok=OihAUMSO "coastal tourism data")
Interaction with other sectors
While European destinations are welcoming tourists at pre-pandemic levels, the rise in tourist numbers and their concentration in attractive touristic destinations may generate issues of over tourism, particularly in coastal areas and small island. Increasing tourism intensity requires long-term solutions .
At the same time, Covid-19 will likely have long-term impacts on EU citizens’ travelling behavior. A recent Eurobarometer survey showed that 82% of EU citizens are ready to change their travel and tourism habits to be more sustainable, for example, by consuming local products (55%), choosing ecological means of transport (36%) or by paying more to protect the natural environment (35%) or to benefit the local community (33%). The survey also found out that 38% of European respondents are expecting more domestic travelling in the future .
One example of a sustainable approach to coastal and maritime tourism is the ECO-CRUISING FU_TOUR .
For many experts in the business, this is a game-changing opportunity that will lead to greater and faster adoption of more sustainable environmental solutions and greater respect for coastal natural and cultural qualities of coastal areas. The European Green Deal and the new EU Sustainable Blue Economy can help in such green transitions, thanks to policy reforms, specific financial mechanism, as well as innovation, digitalisation, education and training.
Share this page
- Ways to Give
- Contact an Expert
- Explore WRI Perspectives
Filter Your Site Experience by Topic
Applying the filters below will filter all articles, data, insights and projects by the topic area you select.
- All Topics Remove filter
- Climate filter site by Climate
- Cities filter site by Cities
- Energy filter site by Energy
- Food filter site by Food
- Forests filter site by Forests
- Freshwater filter site by Freshwater
- Ocean filter site by Ocean
- Business filter site by Business
- Economics filter site by Economics
- Finance filter site by Finance
- Equity & Governance filter site by Equity & Governance
Search WRI.org
Not sure where to find something? Search all of the site's content.
Building a Sustainable Coastal and Marine Tourism Economy
The tourism industry was estimated to become the largest ocean economy by 2030 (OECD), but COVID-19 severely impacted all parts of the tourism value chain. Oceans and coasts are at the heart of tourism, as 80% of all tourism takes place in coastal areas. 183 countries have coastlines, 37% of the world’s population live in coastal communities and most commodities extracted from the ocean come from coastal regions (UNWTO, 2014). The new realities have awakened a new approach to tourism, particularly from island and coastal nations.
In 2020 the High Level Panel for a Sustainable Ocean Economy (Ocean Panel) set a goal of a sustainable tourism economy by 2030: “Coastal and ocean-based tourism is sustainable, resilient, addresses climate change, reduces pollution, supports ecosystem regeneration and biodiversity conservation and invests in local jobs and communities.” This guidance has been taken by government and industry in the approach to a recovery of the tourism sector. The Tourism Action Coalition for a Sustainable Ocean was created in response to the Ocean Panel's call to action and will serve as a knowledge hub and action platform to drive sustainable coastal and ocean-based tourism.
This session will bring together representatives of the Ocean Panel countries, alongside high-level representatives from the Tourism Action Coalition for a Sustainable Ocean to address how the public and private sectors are moving toward a sustainable blue tourism economy that builds a resilient future for tourism destinations and improves the well-being of local communities.
We invite tourism stakeholders and coastal and ocean communities to join this webinar. The event promises to showcase the actions that are being taken by countries and the tourism industry to recover and rebuild after the pandemic. These actions can provide guidance in building resilience to face other health and environmental crises across sectors.
- Jamie Sweeting , CEO , Planeterra (moderator)
- Gloria Fluxa Thienemann , Vice-Chairman and Chief Sustainability Officer , Iberostar Hotels & Resorts
- Daniel Skjeldam, CEO , Hurtigruten Group
- Cesar Daniel Gonzalez Madruga, General Director , SECTUR Mexico
- Louise Twining-Ward , Senior Private Sector Development Specialist , The World Bank
- Rita Marques , Secretary of State of Tourism, Portugal (keynote)
How You Can Help
WRI relies on the generosity of donors like you to turn research into action. You can support our work by making a gift today or exploring other ways to give.
Stay Informed
World Resources Institute 10 G Street NE Suite 800 Washington DC 20002 +1 (202) 729-7600
© 2024 World Resources Institute
Envision a world where everyone can enjoy clean air, walkable cities, vibrant landscapes, nutritious food and affordable energy.
UN Tourism | Bringing the world closer
The first global dashboard for tourism insights.
- UN Tourism Tourism Dashboard
- Language Services
- Publications
share this content
- Share this article on facebook
- Share this article on twitter
- Share this article on linkedin
UN Tourism Data Dashboard
The UN Tourism Data Dashboard – provides statistics and insights on key indicators for inbound and outbound tourism at the global, regional and national levels. Data covers tourist arrivals, tourism share of exports and contribution to GDP, source markets, seasonality and accommodation (data on number of rooms, guest and nights)
Two special modules present data on the impact of COVID 19 on tourism as well as a Policy Tracker on Measures to Support Tourism
The UN Tourism/IATA Destination Tracker
UN Tourism Recovery Tracker

- International tourist arrivals and receipts and export revenues
- International tourism expenditure and departures
- Seasonality
- Tourism Flows
- Accommodation
- Tourism GDP and Employment
- Domestic Tourism

International Tourism and COVID-19
- The pandemic generated a loss of 2.6 billion international arrivals in 2020, 2021 and 2022 combined
- Export revenues from international tourism dropped 62% in 2020 and 59% in 2021, versus 2019 (real terms) and then rebounded in 2022, remaining 34% below pre-pandemic levels.
- The total loss in export revenues from tourism amounts to USD 2.6 trillion for that three-year period.
- International tourist arrivals reached 88% of pre-pandemic levels in January-December 2023
COVID-19: Measures to Support Travel and Tourism
- The Ocean’s Importance
What is the Ocean Panel?
Advisory Network
The Agenda: Transformations
Ocean Wealth
Ocean Health
Ocean Equity
Ocean Knowledge
Ocean Finance
Sustainable Ocean Plans
Progress Reports
Action Groups
Sustainable Coastal & Marine Tourism
- Publications

Opportunities for Transforming Coastal and Marine Tourism: Towards Sustainability, Regeneration and Resilience
While the inherent balancing act of nature-based tourism has always been apparent, the unprecedented pause in global tourism induced by the pandemic has provided a unique opportunity to reassess and reset.

In December 2020, the High Level Panel for a Sustainable Ocean Economy (Ocean Panel) released its ‘Transformations for a Sustainable Ocean Economy: A Vision for Protection, Production and Prosperity’ .
One of the pillars of action within this ambitious roadmap for a sustainable ocean economy was for sustainable ocean-based tourism, establishing the goal that by 2030 “Coastal and ocean-based tourism is sustainable, resilient, addresses climate change, reduces pollution, supports ecosystem regeneration and biodiversity conservation and invests in local jobs and communities.”
To support efforts to deliver on this goal, the Ocean Panel commissioned a body of knowledge on coastal and marine tourism, including this special report.
We’ve seen the devastating impacts that the global pandemic has had on tourism, particularly for small island and coastal communities. We’ve also seen cases where reduced pressure from mass tourism has resulted in recovery of coastal and marine ecosystems. The past few years has made a strong case for change. There is an urgent need to ensure the continued viability of this important sector while at the same time building its resilience to climate change, disasters, pollution, urbanisation and ecosystem degradation. We know that sustainable ocean-based tourism can restore and protect the ocean while delivering jobs and prosperity. However, achieving this ambitious vision requires strategic public and private investments.
This special report outlines an approach for sustainable coastal and marine tourism that increases the focus on regeneration and resilience. It contains inspiring examples of destinations and individual businesses shifting towards a more sustainable approach that helps to restore the local environment on which it depends, supports local economic prosperity, and protects and even revitalises local traditional and heritage.
The coordinating lead author of this report is Eliza Northrop. Contributing authors include Peter Schuhmann, Lauretta Burke, Alan Fyall, Sergio Alvarez, Anna Spenceley, Susanne Becken, Kumi Kato, Joyashree Roy, Shreya Some, Joeli Veitayaki, Anil Markandya, Ibon Galarraga, Patxi Greño, Itziar Ruiz-Gauna, Matt Curnock, Megan Epler Wood, Melody Yue Yin, Sibylle Riedmiller, Eleanor Carter, Rizky Haryanto, Elizabeth Holloway, Robertico Croes, Jorge Ridderstaat and Maksim Godovykh.
Explore the accompanying Sustainable Coastal and Marine Tourism Expert Perspectives .
Accessibility Tools
Privacy overview.
Thank you for visiting nature.com. You are using a browser version with limited support for CSS. To obtain the best experience, we recommend you use a more up to date browser (or turn off compatibility mode in Internet Explorer). In the meantime, to ensure continued support, we are displaying the site without styles and JavaScript.
- View all journals
- My Account Login
- Explore content
- About the journal
- Publish with us
- Sign up for alerts
- Data Descriptor
- Open access
- Published: 26 November 2021
A database of global coastal conditions
- Mariana Castaneda-Guzman ORCID: orcid.org/0000-0001-6106-4284 1 ,
- Gabriel Mantilla-Saltos 2 ,
- Kris A. Murray 3 , 4 ,
- Robert Settlage ORCID: orcid.org/0000-0002-1354-7609 5 &
- Luis E. Escobar ORCID: orcid.org/0000-0001-5735-2750 1 , 6 , 7
Scientific Data volume 8 , Article number: 304 ( 2021 ) Cite this article
5562 Accesses
2 Citations
5 Altmetric
Metrics details
- Biogeography
- Ecological modelling
- Environmental impact
- Physical oceanography
Remote sensing satellite imagery has the potential to monitor and understand dynamic environmental phenomena by retrieving information about Earth’s surface. Marine ecosystems, however, have been studied with less intensity than terrestrial ecosystems due, in part, to data limitations. Data on sea surface temperature (SST) and Chlorophyll- a (Chlo- a ) can provide quantitative information of environmental conditions in coastal regions at a high spatial and temporal resolutions. Using the exclusive economic zone of coastal regions as the study area, we compiled monthly and annual statistics of SST and Chlo- a globally for 2003 to 2020. This ready-to-use dataset aims to reduce the computational time and costs for local-, regional-, continental-, and global-level studies of coastal areas. Data may be of interest to researchers in the areas of ecology, oceanography, biogeography, fisheries, and global change. Target applications of the database include environmental monitoring of biodiversity and marine microorganisms, and environmental anomalies.
Machine-accessible metadata file describing the reported data: https://doi.org/10.6084/m9.figshare.16638235
New capabilities of Sentinel-2A/B satellites combined with in situ data for monitoring small harmful algal blooms in complex coastal waters

Satellite-based time-series of sea-surface temperature since 1981 for climate applications

Unravelling seasonal trends in coastal marine heatwave metrics across global biogeographical realms
Background & summary.
Remote sensing, referring to the acquisition of information about the Earth’s surface through satellite imagery, has become a powerful tool for monitoring the environment and predicting risks associated with environmental changes 1 , 2 , 3 , 4 . From a plethora of applications, remotely sensed data have been used to detect landscape change 5 , 6 , 7 , 8 , assess biodiversity 9 , monitor carbon emissions 10 , 11 , predict infectious diseases 12 , 13 , 14 , and track marine coasts 15 . Marine ecosystems, however, have been studied with less intensity than terrestrial ecosystems due, in part, to data limitations. A limitation in the use of global-level remotely sensed data is how time-consuming it proves to be, given that sometimes complex data compilation, curation, standardization, and storage may require high-performance computational facilities 16 , 17 . An open-access, free-of-cost database of global ocean conditions is instrumental in advancing our understanding of coastal phenomena 12 , 15 .
A significant benefit of satellite-derived information is the historical archives of data 2 , 10 , 12 . Technological advances and innovative design have resulted in new generations of satellite sensors that monitor marine environments, such as the Moderate Resolution Imaging Spectroradiometer (MODIS). MODIS sensors are part of the National Aeronautics and Space Administration’s Earth Observing System onboard the Terra and Aqua satellites and were designed to provide measurements of global dynamics of terrestrial, freshwater, and marine ecosystems 18 , 19 , 20 . MODIS provides the longest standing observational marine time series data, given that both the Aqua and Terra satellites have been in orbit since the early 2000s, and it provides a larger set of marine variables for potential evaluation at the same spatial and temporal scale 18 . Nevertheless, there are other enhanced satellite instruments 21 , such as the Along Track Scanning Radiometer 22 , Suomi National Polar-orbiting Partnership 23 , Visible Infrared Imaging Radiometer Suite 24 , 25 , and Sentinel 26 , which offer opportunities for future multi-sensor marine variables.
Out of the possible marine variables derived from observations of MODIS, sea surface temperature (SST) and Chlorophyll- a (Chlo- a ) have the potential to increase our understanding of abiotic (e.g., temperature) and biotic (e.g., primary productivity) ocean conditions 4 , 20 . SST measured by MODIS infrared radiometers is also referred to as the skin temperature of the ocean. This is because the radiance measured by infrared radiometers originates in the surface thermal skin layer of the ocean and not the water below as measured by in situ thermometers 27 . SST provides fundamental information on the global climate systems, and it is an essential parameter in weather prediction 28 . Chlo- a is a proxy for understanding fluctuations in algae and pigmented bacteria as it can elucidate photosynthetic activity in coastal systems 4 , 20 , 29 . The near-surface concentration of Chlo- a is calculated using an empirical relationship derived from in situ measurements, and the implementation of the standard O’Reilly band ratio OCx (e.g., OC3M, for the MODIS sensor) algorithm merged with the color index algorithm of Hu et al . 30 , 31 . SST and Chlo- a have been crucial in studies to reconstruct environmental phenomena, such as Vibrio cholerae emergence 13 , 32 , 33 , algae blooms 29 , 34 , 35 , El Niño and La Niña dynamics 36 , and coral bleaching 37 .
Satellite-derive data have many limitations given their sensitivity to absorption of solar isolation, heat exchange with the atmosphere, and sub-surface turbulence. Nevertheless, since these conditions are known and common, validation and uncertainty are estimated relative to in situ buoys to correct final datasets 38 , 39 , 40 . Satellite-derived data provide an opportunity to analyze large study areas during extended periods, at the cost of limiting the information to surface level. Complementary approaches may include the addition of more oceanic and atmospheric observations like bathymetry, wind direction, and wind speed 1 . We compiled remotely sensed data of monthly SST and Chlo- a from the exclusive economic zone (EEZ) of coastal areas globally for a 18-year period (2003–2020). Data were used to generate summary statistics at yearly and monthly composites. Code is included to update the database as data are released. This database can be downloaded freely through Figshare 41 .
This section describes the procedures used to generate the individual data records that comprise the SST and Chlo- a databases. Data retrieval and analysis performed during the development of the database were executed using the statistical software R 42 . The SST and Chlo- a databases were developed in four stages: (a) data procurement, (b) preparation, (c) processing, and (d) analysis. The first two stages were associated with input data, while the third stage was applied specific methods to construct the core of each database. The fourth stage included the statistical analyses of the data. The methodological stages are summarized in Fig. 1 and described in detail below.

Workflow diagram. ( a ) Remotely-sensed data were downloaded from the NASA ERDDAP server in the form of NetCDF files. ( b ) Data were then transformed into a raster object. ( c ) Data were then cropped and masked to the exclusive economic zone and imported as GeoTIFF. ( d ) Data were analyzed to include statistical analyses and exported as raster files.
Data procurement
The database is based on satellite observations derived from the MODIS satellite. The Terra and Aqua satellites have been orbiting around the Earth since their launch in 1999 and 2002, respectively, obtaining data of Earth’s surface every one to two days at three spatial resolutions (250, 500, 1000 m) and 36 spectral bands (from 0.405 to 14.385 µm). From the available atmospheric and oceanic observations made available from NASA’s Aqua Spacecraft, Sea Surface Temperature (SST) in °C and Chlorophyll- a (Chlo- a ) in mg*m −3 were selected since they summarize major physical and biological phenomena. SST and Chlo- a are available at a temporal resolution of 1-day, 8-day, and monthly composites and a spatial resolution of ~4 km (Table 1 ).
SST and Chlo- a , among other environmental variables, can be accessed through National Oceanic and Atmospheric Administration’s (NOAA) Coastal Watch Environmental Research Division (ERD) Environmental Research Division Data Access Protocol (ERDDAP) data server, also known as the NOAA’s Coastal Watch. NOAA’s Coastal Watch is a program that provides timely access to near-real-time satellite data to monitor, restore, and manage coastal ocean resources, and the ERDDAP Data Server supports manual downloads through a web application and remote downloads from any computer program (e.g., MATLAB, R, JSONP, Python) of both gridded and tabular data 43 .
Data downloading
The remote request to the ERDDAP Data Server relies on the creation of specially formed URLs to query the server for a specific database. A URL consists of a root, a target, and a constraint expression 43 . To procure the inputs needed to assemble this database especially formed URLs were created through a programming algorithm in R (Auxiliary Materials 44 ).
The root or base URLs that provided the location of the gridded database were obtained from the ERDDAP griddap documentation webpage ( https://coastwatch.pfeg.noaa.gov/erddap/griddap/documentation.html ) and remained constant in all requests for a specific database.
The target is the equivalent to the unique identifier or data set ID previously assigned by the ERDDAP ( https://coastwatch.pfeg.noaa.gov/erddap/griddap ), in conjunction with a specific data file type extension, for this study .nc was selected producing NetCDF-3 binary files with COARDS/CF/ACDD metadata. NetCDF, Network Common Data Form, files are recommended when using software tools to analyze geospatial data as they provide multidimensional scientific data in a standardized manner ( https://coastwatch.pfeg.noaa.gov/erddap/griddap/documentation.html ) 45 , 46 .
The constraint expression (or query) helped define the parameters, which correspond to the study period and spatial coverage. Regarding the first parameter, the study period comprised all available observations from the MODIS instrument aboard the Aqua satellite (i.e., monthly composites from 2003 to 2020). The spatial coverage was defined by the minimum and maximum latitude (i.e., 89.98°S to 89.98°N) and longitude (i.e., 179.98°W to 179.98°E) from the original satellite image for global coverage.
Data preparation
Data within the NetCDF files were imported into R using the RNetCDF package 47 . A NetCDF object contains a list of at least four attributes: time, longitude, latitude, and the values of the variable being measured (i.e., SST and Chlo- a ). The attribute corresponding to the specific variable being measured was extracted from the NetCDF object and transformed into a raster object using the RNetCDF and raster packages in R 48 . A raster object consists of a matrix of cells (i.e., pixels) organized into rows and columns where each cell contains a value representing information (i.e., temperature and pigmentation) and the metadata corresponding to spatial information of object 49 .
As the last piece of the data preparation process, the extent of the raster was verified to match that of the original satellite data. Extent was set to latitude and longitude of 89.98°S to 89.98°N and 179.98°W to 179.98°E, respectively. The coordinate reference system (CRS) was defined to be relative to the WGS84 datum for easy manipulation by the end user.
Data processing
A significant feature of the SST and Chlo- a databases is the addition of the segmentation by the world’s exclusive economic zone (EEZ). EEZ is a marine zone within 200 nautical miles from a country’s coastline where each country claims jurisdiction for economic activities 50 . Given the oceanographic nature of the data, focusing on the 200-mile buffer of EEZ provides a more comprehensive explanation of oceanic changes, with the potential to promote the development of ocean planning initiatives directly influencing human settlements on the coasts. To represent the EEZ, a geospatial vector file in shapefile format was constructed by delimiting a buffer of ~200 miles off coastlines globally.
The EEZ regions were defined using the functions crop and mask from the raster 48 package. The function mask allowed to place the area of interest (i.e., the EEZ) on top of each monthly raster, assigning no value to cells outside of the area of interest, while the function crop ensured that each raster matched the extent of that of the area of interest (Fig. 2 ). The core database included 408 individual rasters cropped and masked to the EEZ of each country.

Data masking and cropping. Example of masking and cropping a raster. ( a ) Raster from original NetCDF. ( b ) Economic Exclusive Zone (solid lines). ( c ) Raster after crop and mask.
Statistical analysis
Complementary to the core database, data were treated as an m by n matrix, where m represents the years and n represents the months and stacked in two distinct ways (1) in yearly composites and (2) monthly composites.
We created the annual and monthly stacks by using stack function in the raster package 48 . The mean, range, maximum, minimum, and standard deviation values were estimated for annual and monthly SST and Chlo- a . We obtained a total of 90 rasters for the yearly composites (18 years, five different statistics) and 60 rasters for the monthly summaries (12 months, five different statistics).
Data Records
Final data are provided in the form of GeoTIFFs for the EEZs boundaries and statistical analysis results 41 . Data can be downloaded based on annually, monthly, or as summary composites of the 18-years period. Data can also be updated using the code included in the Auxiliary Material in Figshare 44 .
Technical Validation
Remotely sensed environmental observations from the MODIS instrument, including SST and Chlo- a , have been validated profusely by the scientific community against a number of models and in situ measurements 51 , 52 , 53 , 54 , 55 , 56 , 57 , 58 and used in a diverse set of studies 13 , 14 , 19 , 59 , 60 , 61 , 62 , 63 , 64 , 65 , 66 , 67 . For instance, validation of the SST observation uses accurate ship-based infrared radiometers and differing and moored buoys with thermometers a meter of depth 38 , 56 , 57 . NASA’s standard processing and distribution of the SST products are performed using software developed by the Ocean Biology Processing Group 18 . SST products are validated internally by NASA using a collocated matchup database of in situ observations that are collected within 30 minutes of an overpass and 10 km of a pixel. MODIS SST observations represent the thermal skin layer of the ocean, which is <1 mm thick and is cooler than the underlying water due to vertical heat flux 68 , 69 . At night or when wind speeds are greater than ~6 m/s, the relationship between the skin temperature and the subsurface are nearly equal. It is under these conditions that validation and uncertainty estimates relative to sub-surface in situ buoys are typically reported 20 , 38 . The estimation vs. observation relationship, however, can be very variable under conditions of low wind speeds and reduced sub-surface turbulence 21 , 70 . Furthermore, NASA MODIS uses a collection of cloud classification algorithms to indicate when a pixel corresponds to clear sky conditions (i.e., no cloud coverage). The most recent cloud-classification method is the Alternating Decision Tress 71 . Other SST observations validations tests include a regional ice test, where reflectance thresholds are determined using the Sentinel-2 MSI calibrated reflectance 72 and correction of dust contamination 73 .
MODIS Chlo- a observations are derived from the O’Reilly OC3M algorithm and the Hu color index 30 , 31 . The algorithm is calculated using an empirical relationship from in situ measurements and remote sensing reflectance in the blue-to-green region of the visible spectrum. Level 3 MODIS data may provide biased minima and maxima values during errors in the observation that, for example, has some cloud contamination or sunlight affecting the value captured by the sensor. Due to potential atmospheric contamination some regions could have a limited number of observations from which to estimate the monthly values, which increases uncertainty. There is an estimated ± 35% nominal uncertainty related to the OC3M algorithm used to derive the global Chlo- a product. Nevertheless, error could increase in optically complex waters like those present in coastal areas 74 , 75 .
We performed a data validation procedure comparing MODIS observation of SST and Chlo- a against gold-standard sensors. More specifically, we compared MODIS data against SST data from Sentinel-3 76 during the year 2020. We found that data from MODIS and Sentinel-3 were statistically indistinguishable with a Pearson correlation coefficient of r = 0.99 for the annual mean, minimum, and maximum composites ( R 2 = 0.99, p < 0.05; Supplementary Fig. S1 ). Additionally, Chlo- a data were evaluated by comparing MODIS data against SeaWiFS 30 observations for the year 2010, when the SeaWiFS satellite ended operations. We found that MODIS Chlo- a data were significantly correlated with SeaWiFS Chlo- a data but with less strength than for SST evaluations. More specifically, correlation was r = 0.83 ( R 2 = 0.67, p < 0.05) for the mean, r = 0.71 ( R 2 = 0.53, p < 0.05) for the maximum, and r = 0.76 ( R 2 = 0.52, p < 0.05) for the minimum Chlo- a composites (Fig. S2 ). Together, these results suggest that MODIS data have a robust representation of environmental conditions in global coastal waters, at least when compared against gold-standard datasets of SST and Chlo- a .
Usage Notes
The proposed use of this dataset is for coarse-scale, regional or global-level studies of coastal environmental conditions. Fine-scale assessments of SST and Chlo- a are warranted to improve accuracy and detail of these variables for local-level applications. The data can be used to identify anomalies for SST and Chlo- a at local, regional, and global levels. The example demonstrates SST and Chlo- a data explorations in tropical and temperate localities, identifying patterns along time (Fig. 3 ). Areas in the mid-Atlantic region of the United States show an increase in mean SST during the month of June to October (Fig. 3a ), while areas in the subtropics of the Americas (i.e., Ecuador and Colombia) reveal cooler temperatures during the same period (Fig. 3b ). Additional exploration of the data in tropical and subtropical zones of different latitude reveal that Chlo- a increases from September to December (Fig. 4b ). Contrarily, in the tropics, Chlo- a concentration increases between March and May (Fig. 4a ).

Sea surface temperature mean monthly values from 2003–2020. ( a ) Temperate zone monthly averages between the years 2003–2020 (east coast of the United States). ( b ) Subtropical zone monthly averages between the years 2003–2020 (coast of Chile).

Chlorophyll- a mean monthly values from 2003–2020. ( a ) Tropical zone monthly averages between the years 2003–2020 (coast of Ecuador and Colombia). ( b ) Subtropical zone monthly averages between the years 2003–2020 (coast of Chile).
Code availability
Code in R language to recreate the database and the figures in the Usage Notes is available on Figshare 41 .
Horning, N., Robinson, J. A., Sterling, E. J., Turner, W. & Spector, S. Remote sensing for ecology and conservation . Techniques in Ecology & Conservation Series (Oxford University Press, 2010).
Li, J. et al . A review of remote sensing for environmental monitoring in China. Remote Sens. 12 , 1130 (2020).
Article ADS Google Scholar
Carter, W. D. & Paulson, R. W. Introduction to monitoring dynamic environmental phenomena of the world using satellite data collection systems . (U.S. Geological Survey, 1979).
Nurdin, S., Mustapha, M. A. & Lihan, T. The relationship between sea surface temperature and chlorophyll- a concentration in fisheries aggregation area in the archipelagic waters of spermonde using satellite images. AIP Conf. Proc. 1571 , 466–472 (2013).
Ward, D., Phinn, S. R. & Murray, A. T. Monitoring growth in rapidly urbanizing areas using remotely sensed data. Prof. Geogr. 52 , 371–386 (2000).
Article Google Scholar
Singh, A. Review article: Digital change detection techniques using remotely-sensed data. Int. J. Remote Sens. 10 , 989–1003 (1989).
Dewan, A. M. & Yamaguchi, Y. Land use and land cover change in Greater Dhaka, Bangladesh: Using remote sensing to promote sustainable urbanization. Appl. Geogr. 29 , 390–401 (2009).
Green, K., Kempka, D. & Lackey, L. Using remote sensing to detect and monitor land-cover and land-use change. Photogramm. Eng. Remote Sens. 60 , 331–337 (1994).
Google Scholar
Nagendra, H. Using remote sensing to assess biodiversity. Int. J. Remote Sens. 22 , 2377–2400 (2001).
Rosenqvist, Å., Milne, A., Lucas, R., Imhoff, M. & Dobson, C. A review of remote sensing technology in support of the Kyoto Protocol. Environ. Sci. Policy 6 , 441–455 (2003).
Liu, J. A process-based boreal ecosystem productivity simulator using remote sensing inputs. Remote Sens. Environ. 62 , 158–175 (1997).
Colwell, R. R. Global climate and infectious disease: The cholera paradigm. Science 274 , 2025–2031 (1996).
Article ADS PubMed CAS Google Scholar
Escobar, L. E. et al . A global map of suitability for coastal Vibrio cholerae under current and future climate conditions. Acta Trop. 149 , 202–211 (2015).
Article PubMed Google Scholar
Watts, N. et al . The 2019 report of The Lancet Countdown on health and climate change: Ensuring that the health of a child born today is not defined by a changing climate. Lancet 394 , 1836–1878 (2019).
Alesheikh, A. A., Ghorbanali, A. & Nouri, N. Coastline change detection using remote sensing. Int. J. Environ. Sci. Technol. 4 , 61–66 (2007).
Specter, C. & Gayle, D. Managing technology transfer for coastal zone development: Caribbean experts identify major issues. Int. J. Remote Sens. 11 , 1729–1740 (1990).
Green, E. P., Mumby, P. J., Edwards, A. J. & Clark, C. D. A review of remote sensing for the assessment and management of tropical coastal resources. Coast. Manag. 24 , 1–40 (1996).
NASA. MODIS (Moderate Resolution Imaging Spectroradiometer). https://modis.gsfc.nasa.gov/about/ (2021).
Kilpatrick, K. A. et al . A decade of sea surface temperature from MODIS. Remote Sens. Environ. 165 , 27–41 (2015).
Esaias, W. E. et al . An overview of MODIS capabilities for ocean science observations. IEEE Trans. Geosci. Remote Sens. 36 , 1250–1265 (1998).
Donlon, C. J. et al . Toward improved validation of satellite SST measurements for climate research. J. Clim. 15 , 353–369 (2002).
Minnett, P. J. Satellite infrared scanning radiometers — AVHRR and ATSR/M. in Microwave Remote Sensing for Oceanographic and Marine Weather-Forecast Models 141–163 (Springer Netherlands, 1990).
Hillger, D. et al . First-Light Imagery from Suomi NPP VIIRS. Bull. Am. Meteorol. Soc. 94 , 1019–1029 (2013).
O’Brien, J. From MODIS to VIIRS - Making the Switch for Air Quality Professionals. NASA Earth Science/Applied Science https://appliedsciences.nasa.gov/our-impact/news/modis-viirs-making-switch-air-quality-professionals (2020).
Minnett, P. J., Evans, R. H., Podestá, G. P. & Kilpatrick, K. A. Sea-surface temperature from Suomi-NPP VIIRS: Algorithm development and uncertainty estimation. in SPIE 9111 , Ocean Sensing and Monitoring VI (eds. Hou, W. W. & Arnone, R. A.) 91110C (2014).
Drusch, M. et al . Sentinel-2: ESA’s Optical High-Resolution Mission for GMES Operational Services. Remote Sens. Environ. 120 , 25–36 (2012).
Donlon, C. et al . The global ocean data assimilation experiment high-resolution sea surface temperature pilot project. Bull. Am. Meteorol. Soc. 88 , 1197–1214 (2007).
NOAA. Ocean Facts: Why do scientists measure sea surface temperature? https://oceanservice.noaa.gov/facts/sea-surface-temperature.html (2020).
Wei, G. F., Tang, D. L. & Wang, S. Distribution of chlorophyll and harmful algal blooms (HABs): A review on space based studies in the coastal environments of Chinese marginal seas. Adv. Sp. Res. 41 , 12–19 (2008).
Article ADS CAS Google Scholar
O’Reilly, J. E. et al . Ocean color chlorophyll algorithms for SeaWiFS. J. Geophys. Res. Ocean. 103 , 24937–24953 (1998).
Hu, C., Lee, Z. & Franz, B. Chlorophyll a algorithms for oligotrophic oceans: A novel approach based on three-band reflectance difference. J. Geophys. Res. Ocean. 117 , C01011 (2012).
Vezzulli, L. et al . Climate influence on Vibrio and associated human diseases during the past half-century in the coastal North Atlantic. Proc. Natl. Acad. Sci. 113 , E5062–E5071 (2016).
Article PubMed PubMed Central CAS Google Scholar
Lipp, E. K., Huq, A. & Colwell, R. R. Effects of global climate on infectious disease: The Cholera model. Clin. Microbiol. Rev. 15 , 757–770 (2002).
Article PubMed PubMed Central Google Scholar
Grimes, J. D. et al . Viewing marine bacteria, their activity and response to environmental drivers from orbit: Satellite remote sensing of bacteria. Microb. Ecol. 67 , 489–500 (2014).
Shen, L., Xu, H. & Guo, X. Satellite remote sensing of harmful algal blooms (HABs) and a potential synthesized framework. Sensors 12 , 7778–803 (2012).
Hayashi, M., Jin, F. & Stuecker, M. F. Dynamics for El Niño-La Niña asymmetry constrain equatorial-Pacific warming pattern. Nat. Commun. 11 , 1–10 (2020).
Hughes, T. P. et al . Spatial and temporal patterns of mass bleaching of corals in the Anthropocene. Science 359 , 80–83 (2018).
Minnett, P. J. et al . Sea-surface temperature measurements from the moderate-resolution imaging spectroradiometer (MODIS) on Aqua and Terra. in IEEE International Geoscience and Remote Sensing Symposium Proceedings. 2004 7 , 4576–4579 (2004).
Minnett, P. J. The validation of sea surface temperature retrievals from spaceborne infrared radiometers. in Oceanography from Space (Springer Netherlands, 2010).
Minnett, P. J. & Corlett, G. K. A pathway to generating climate data records of sea-surface temperature from satellite measurements. Deep Sea Res. Part II Top. Stud. Oceanogr. 77–80 , 44–51 (2012).
Castaneda-Guzman, M., Mantilla-Saltos, G., Murray, K. A., Settlage, R. & Escobar, L. E. A database of global coastal conditions. Figshare https://doi.org/10.6084/m9.figshare.c.5660263.v1 (2021).
R Core Team. R: A Language and Environment for Statistical Computing. (2020).
NOAA. National Oceanic and Atmospheric Administration (NOAA) Coastal Watch. https://coastwatch.pfeg.noaa.gov/erddapinfo/ (2021).
Castaneda-Guzman, M., Mantilla-Saltos, G., Murray, K. A., Settlage, R. & Escobar, L. E. Methods and code. Figshare https://doi.org/10.6084/m9.figshare.13708642.v4 (2021).
Stanford. Best practices for file formats. https://library.stanford.edu/research/data-management-services/data-best-practices/best-practices-file-formats (2021).
UCAR Community Programs. Network Common Data Form (NetCDF). https://www.unidata.ucar.edu/software/netcdf/ (2021).
Michna, P. & Woods, M. RNetCDF: Interface to ‘NetCDF’ Datasets. (2019).
Hijmans, R. J. raster: Geographic Data Analysis and Modeling. (2020).
ArcGIS. What is a raster data? https://desktop.arcgis.com/en/arcmap/10.3/manage-data/raster-and-images/what-is-raster-data.htm (2021).
United Nations. United Nations Convention on the Law of the Sea . 1833 U.N.T.S. 397 (1982).
Tilstone, G. H. et al . Assessment of MODIS-Aqua chlorophyll- a algorithms in coastal and shelf waters of the eastern Arabian Sea. Cont. Shelf Res. 65 , 14–26 (2013).
Hoge, F. E. et al . Validation of Terra-MODIS phytoplankton chlorophyll fluorescence line height. I. Initial airborne Lidar results. Appl. Opt. 42 , 2767-2771 (2003).
Article ADS PubMed Google Scholar
Remer, L. A. Validation of MODIS aerosol retrieval over ocean. Geophys. Res. Lett. 29 , 8008 (2002).
Gentemann, C. L. Three way validation of MODIS and AMSR-E sea surface temperatures. J. Geophys. Res. Ocean. 119 , 2583–2598 (2014).
Fang, H., Wei, S. & Liang, S. Validation of MODIS and CYCLOPES LAI products using global field measurement data. Remote Sens. Environ. 119 , 43–54 (2012).
Hosoda, K., Murakami, H., Sakaida, F. & Kawamura, H. Algorithm and validation of sea surface temperature observation using MODIS sensors aboard terra and aqua in the western North Pacific. J. Oceanogr. 63 , 267–280 (2007).
Hao, Y. et al . Validation of MODIS sea surface temperature product in the coastal waters of the Yellow Sea. IEEE J. Sel. Top. Appl. Earth Obs. Remote Sens. 10 , 1667–1680 (2017).
Sims, D. A. et al . On the use of MODIS EVI to assess gross primary productivity of North American ecosystems. J. Geophys. Res. Biogeosciences 111 (2006).
Miles, T. N. & He, R. Temporal and spatial variability of Chl-a and SST on the South Atlantic Bight: Revisiting with cloud-free reconstructions of MODIS satellite imagery. Cont. Shelf Res. 30 , 1951–1962 (2010).
Ma, S., Zhang, X., Ding, C., Han, W. & Lu, Y. Comparison of the spatiotemporal variation of Chl-a in the East China Sea and Bohai Sea based on long time series satellite data. in 2021 9th International Conference on Agro-Geoinformatics (Agro-Geoinformatics) 1–6 (2021).
Watts, N. et al . The 2020 report of The Lancet Countdown on health and climate change: Responding to converging crises. Lancet 6736 (2020).
Moradi, M. & Kabiri, K. Spatio-temporal variability of SST and Chlorophyll- a from MODIS data in the Persian Gulf. Mar. Pollut. Bull. 98 , 14–25 (2015).
Article PubMed CAS Google Scholar
Golder, M. R. et al . Chlorophyll- a , SST and particulate organic carbon in response to the cyclone Amphan in the Bay of Bengal. J. Earth Syst. Sci. 130 , 157 (2021).
Minnett, P. J., Evans, R. H., Kearns, E. J. & Brown, O. B. Sea-surface temperature measured by the Moderate Resolution Imaging Spectroradiometer (MODIS). in IEEE International Geoscience and Remote Sensing Symposium vol. 2, 1177–1179 (IEEE, 2002).
Qin, H., Chen, G., Wang, W., Wang, D. & Zeng, L. Validation and application of MODIS-derived SST in the South China Sea. Int. J. Remote Sens. 35 , 4315–4328 (2014).
Saulquin, B., Gohin, F. & Garrello, R. Regional Objective Analysis for Merging High-Resolution MERIS, MODIS/Aqua, and SeaWiFS Chlorophyll- a Data From 1998 to 2008 on the European Atlantic Shelf. IEEE Trans. Geosci. Remote Sens. 49 , 143–154 (2011).
Chen, J. & Quan, W. An improved algorithm for retrieving chlorophyll- a from the Yellow River Estuary using MODIS imagery. Environ. Monit. Assess. 185 , 2243–2255 (2013).
Hanafin, J. A. & Minnett, P. J. Thermal profiling of the sea surface skin layer using FTIR measurements. in Gas Transfer at Water Surfaces 161–166 (Blackwell Publishing, 2002).
Wong, E. W. & Minnett, P. J. The response of the ocean thermal skin layer to variations in incident infrared radiation. J. Geophys. Res. Ocean. 123 , 2475–2493 (2018).
Ward, B. Near-surface ocean temperature. J. Geophys. Res. 111 , C02004 (2006).
ADS Google Scholar
Kilpatrick, K. A., Podestá, G. P. & Evans, R. Overview of the NOAA/NASA advanced very high resolution radiometer Pathfinder algorithm for sea surface temperature and associated matchup database. J. Geophys. Res. Ocean. 106 , 9179–9197 (2001).
Hollstein, A., Segl, K., Guanter, L., Brell, M. & Enesco, M. Ready-to-use methods for the detection of clouds, cirrus, snow, shadow, water and clear sky pixels in Sentinel-2 MSI images. Remote Sens. 8 , 666 (2016).
Luo, B., Minnett, P. J., Gentemann, C. & Szczodrak, G. Improving satellite retrieved night-time infrared sea surface temperatures in aerosol contaminated regions. Remote Sens. Environ. 223 , 8–20 (2019).
Moore, T. S., Campbell, J. W. & Dowell, M. D. A class-based approach to characterizing and mapping the uncertainty of the MODIS ocean chlorophyll product. Remote Sens. Environ. 113 , 2424–2430 (2009).
Pieri, M. et al . Assessment of three algorithms for the operational estimation of [CHL] from MODIS data in the Western Mediterranean Sea. Eur. J. Remote Sens. 48 , 383–401 (2015).
Tilstone, G. H. et al . Performance of Ocean Colour Chlorophyll- a algorithms for Sentinel-3 OLCI, MODIS-Aqua and Suomi-VIIRS in open-ocean waters of the Atlantic. Remote Sens. Environ. 260 , 112444 (2021).
Download references
Acknowledgements
LEE was supported by a CeZAP 2020 Interdisciplinary Team-building Pilot Grant. This publication was prepared by Mariana Castaneda-Guzman using Federal funds under award (NOAA award #: NA18OAR4170083), Virginia Sea Grant (VASG) Professional Development Award (VASG project #: R/72152 J), from the National Oceanic and Atmospheric Administration’s (NOAA) National Sea Grant College Program, U.S. Department of Commerce. The statements, findings, conclusions, and recommendations are those of the authors and do not necessarily reflect the views of Virginia Sea Grant, NOAA, or the U.S. Department of Commerce. MCG and LEE were also supported by Virginia Tech Library.
Author information
Authors and affiliations.
Department of Fish and Wildlife Conservation, Virginia Polytechnic Institute and State University, Blacksburg, Virginia, 24061, USA
Mariana Castaneda-Guzman & Luis E. Escobar
Escuela Superior Politécnica del Litoral, ESPOL, Facultad de Ciencias Naturales y Matemáticas, Guayaquil, Ecuador
Gabriel Mantilla-Saltos
MRC Unit The Gambia at London School of Hygiene and Tropical Medicine, Fajara, The Gambia
Kris A. Murray
MRC Centre for Global Infectious Disease Analysis, School of Public Health, Imperial College London, London, UK
Advanced Research Computing at Virginia Tech Carilion, Roanoke, Virginia, USA
Robert Settlage
Global Change Center, Virginia Tech, Blacksburg, VA, USA
Luis E. Escobar
Center for Emerging Zoonotic and Arthropod-borne Pathogens, Virginia Tech, Blacksburg, VA, USA
You can also search for this author in PubMed Google Scholar
Contributions
Conceptualized the project: L.E.E., K.A.M., Created and contributed to the workflow for the project: M.C.G., L.E.E., Contributed to writing the R Scripts: M.C.G., G.M.S., R.S., Contributed to the writing and editing of the manuscript: M.C.G., L.E.E., K.A.M., G.M.S., R.S., Approved final version of the manuscript: L.E.E., K.A.M., M.C.G., G.M.S., R.S.
Corresponding author
Correspondence to Luis E. Escobar .
Ethics declarations
Competing interests.
The authors declare no competing interests.
Additional information
Publisher’s note Springer Nature remains neutral with regard to jurisdictional claims in published maps and institutional affiliations.
Supplementary information
Supplementary material, rights and permissions.
Open Access This article is licensed under a Creative Commons Attribution 4.0 International License, which permits use, sharing, adaptation, distribution and reproduction in any medium or format, as long as you give appropriate credit to the original author(s) and the source, provide a link to the Creative Commons license, and indicate if changes were made. The images or other third party material in this article are included in the article’s Creative Commons license, unless indicated otherwise in a credit line to the material. If material is not included in the article’s Creative Commons license and your intended use is not permitted by statutory regulation or exceeds the permitted use, you will need to obtain permission directly from the copyright holder. To view a copy of this license, visit http://creativecommons.org/licenses/by/4.0/ .
The Creative Commons Public Domain Dedication waiver http://creativecommons.org/publicdomain/zero/1.0/ applies to the metadata files associated with this article.
Reprints and permissions
About this article
Cite this article.
Castaneda-Guzman, M., Mantilla-Saltos, G., Murray, K.A. et al. A database of global coastal conditions. Sci Data 8 , 304 (2021). https://doi.org/10.1038/s41597-021-01081-9
Download citation
Received : 08 February 2021
Accepted : 29 October 2021
Published : 26 November 2021
DOI : https://doi.org/10.1038/s41597-021-01081-9
Share this article
Anyone you share the following link with will be able to read this content:
Sorry, a shareable link is not currently available for this article.
Provided by the Springer Nature SharedIt content-sharing initiative
Quick links
- Explore articles by subject
- Guide to authors
- Editorial policies
Sign up for the Nature Briefing: Anthropocene newsletter — what matters in anthropocene research, free to your inbox weekly.

Coastal Tourism
- Pre-covid-19
10% of all international visitors that arrive in UK go to coast
The Coast comprises a very high rate of SMEs (with less than 3% corporate brands represented)
Coastal Tourism in England is highly seasonal, but change was happening as a result of investment in research, product development and marketing:

Key challenges facing coastal communities:
Seasonality
- Productivity
- Perceptions (consumers, media and government)
Climate Change – coastal storms / flooding Business ownership and investment
- Large number of micro and small businesses – difficult to coordinate and deliver change
- Prior to covid, 28% of businesses said they were “planning to sell / retire in next 5 years”
High dependency on Tourism average 15-20% of employment - but 50%+ in places like St. Ives, Exmoor, Whitby and Newquay
Socio-economic pressures on Coastal Communities Skills Brexit
But there are opportunities:
Addressing seasonality and attracting off peak growth markets
- International visitors
- Domestic visitors - Wellness, Slow tourism, Business Events, Under 35s, Empty nesters (over 55s) and Active Experiences
Wider sector or coastal opportunities…
- England Coast Path
Impact of Covid-19
Pre-COVID spend £13.7bn in England
2020 England – coastal impact of COVID-19
Based on July re-opening, loss of international travel and reduced capacity due to social distancing, November lockdown
Verified with National Business Survey data on capacity and revenue
- 95m trips and day visits
- £7.64bn loss in tourism spend
- Equivalent of circa 131,000 jobs
2021 England – coastal impact of COVID-19
Based on closure Jan-Mar, partial April reopening, very limited international travel, reduced capacity and busy summer
- 44m trips and day visits (-23% on pre-Covid-19)
- £5.15bn loss in tourism spend
- -37% on pre-Covid spend / 41% increase on 2020
Hotel Solutions forecast 20-25% of accommodation in coastal communities will close
Institute of Fiscal Studies - there “is no longer a north-south, or urban-rural divide… coastal areas are notably vulnerable to both the health and economic impacts of the crisis” – especially Isle of Wight, Torquay, Blackpool, Dorset and Northumberland
Other reports highlighting impact on coast
Centre for Towns, The Effect of the COVID-19 Pandemic on our Towns and Cities report 2020 Institute for Employment Studies, Labour Market Statistics June 2020: IES Analysis Social Markets Foundation Report HOPE not hate Charitable Trust, Understanding Community Resilience in Our Towns report 2020 Social Investment Business Group: Covid-19 Coastal Communities The Place Bureau Report
Domestic tourism on the Coast
South west is the most popular region for seaside visits:

Visitor Profile demographics:
Source:GBTS 2019
Socio-economic group
International visitors to the coast
10% visit the English coast at some point during their stay in UK
88% are on break of 4+nights (non coastal visitors = 55% on 4+ night break)

210,000 jobs worth £3.6bn (Sheffield Hallam University 2014) + 1% growth
Higher than average concentration of SMEs in coastal visitor economy
<3% corporate brands on the coast (National Coastal Tourism Academy 2015)
31% of residents work part-time → Net outflow of commuters (ONS 2014)
Contact details
+44(0)1202 093 429 [email protected]
Coastal Tourism Resources
Sea Grant works with coastal communities across the country to promote the safe and sustainable use of ocean, coastal and Great Lakes resources. In 2017, Sea Grant completed intensive thought exercises to focus work on several key topics, including coastal tourism. Check out the fact sheet below, or read the resulting action plan for Sea Grant’s work in coastal tourism.
- Coastal Tourism Fact Sheet (PDF)
- Coastal Tourism Vision Plan (PDF)

Mobile Apps & Websites
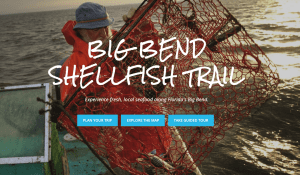
Big Bend Shellfish Trail
The Big Bend Shellfish Trail is where you can learn about Florida shellfish, aquaculture, sustainable environments that protect the waters, where to eat and where to buy (retail) Big Bend shellfish. This effort is sponsored in part by Florida Sea Grant .
Blueways-Greenways in the Charleston, S.C. Region
South Carolina Sea Grant worked with multiple partners to develop an interactive web-mapping app of blueways and greenways in Berkeley, Charleston, and Dorchester counties which allows users to explore features in the area such as land and water trails, water access points, green spaces and historic sites. You can also check the current weather, wind conditions, and stream gauges. For more information: “ How To Guide for Developing Blueways and Greenways in the State of South Carolina ."

Chicago Water Walk
Illinois-Indiana Sea Grant developed the Chicago Water Walk website to help tourists explore the water front areas around Chicago. The website includes an online tour and mobile app download, and allows users to explore the city’s beautiful downtown lake and riverfronts. Along the way, users learn the importance of these resources to the region through fun facts, history, biology, and more.
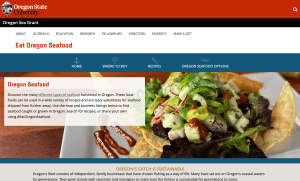
Eat Oregon Seafood
Oregon Sea Grant created this online resource to help people learn how and where to buy Oregon seafood. Find out about the types of seafood harvested in Oregon, see the seafood locator map and try out techniques for cooking and storing seafood here .
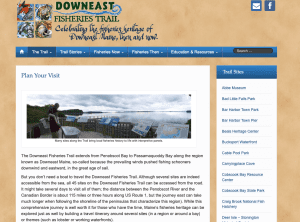
Downeast Fisheries Trail
Maine Sea Grant coordinates the Downeast Fisheries Trail , which celebrates the fishing heritage of Downeast, Maine. The coastal trail is accessible by road, and each stop highlights a story related to fisheries heritage and history in the region. The project is also on Facebook .
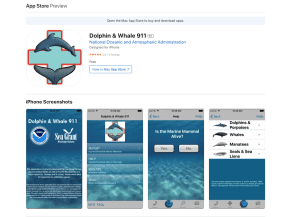
Dolphin and Whale 911
Mississippi-Alabama Sea Grant and NOAA National Marine Fisheries Service partnered to develop Dolphin and Whale 911 . The mobile app allows boaters and others to identify marine mammals and provides a feature to report injured or stranded marine mammals. In addition, the app promotes responsible wildlife viewing from a safe distance.
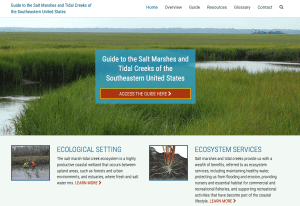
Guide to the Salt Marshes and Tidal Creeks of the Southeastern U.S.
This comprehensive guide , produced in partnership by the South Carolina Department of Natural Resources, South Carolina Sea Grant Consortium and Clemson Extension, provides an overview of salt marsh and tidal creek ecosystems in the southeastern United States. The guide includes information on species identification and classification, ecosystem services and threats, cultural and historical highlights, and stewardship opportunities.

Eat Wisconsin Fish
Wisconsin Sea Grant 's Eat Wisconsin Fish is all about local fish that are available to purchase in Wisconsin. Learn about the different fish types, the people who grow and harvest them, where to purchase and recipes for cooking and preserving.
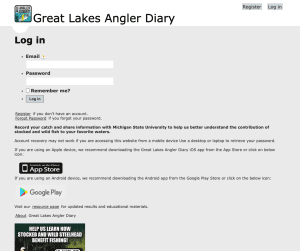
Great Lakes Angler Diary
Michigan Sea Grant developed a mobile app that allows anglers to track their catch and share valuable information with fisheries biologists . The site and app can be found here .
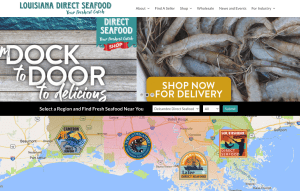
Louisiana Direct Seafood
Louisiana Direct Seafood is a web-based resource to help coastal fishermen connect directly with consumers and build community support for a fresh, local, product ‘straight from the boat’. The site is a partnership effort between Louisiana Sea Grant and LSU Ag Center. In addition to connecting fishermen and consumers, this initiative is also focused on quality business practices, working with fishermen to deliver a superior, sustainable product that meets rigorous standards and preserves fisheries for generations to come.

North Carolina Oyster Trail
North Carolina Sea Grant 's North Carolina Oyster Trail offers unique tourism experiences centered on the state’s tasty oysters. It features shellfish farm tours, seafood markets and restaurants, and education and arts organizations, in addition to oyster-focused festivals and events.
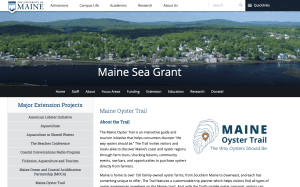
Oyster Trail of Maine
Maine Sea Grant assisted in creating the Oyster Trail of Maine , a map of oyster farms and restaurants that highlights places to learn about and taste a variety of Maine oysters.

Seafood At Your Fingertips
Florida Sea Grant helps consumers choose the best seafood. Market choices are more plentiful than ever, but so are questions. What’s imported and what’s local? Is my choice nutritious and safe to eat? How do I fix the fish I purchased at the grocery? The app is available for iPhone and Android.
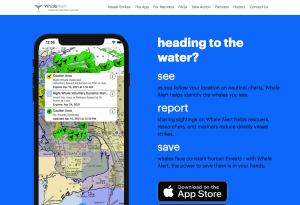
Whale Alert
California Sea Grant State Fellows based at the Channel Islands National Marine Sanctuary worked with partners to develop a whale sighting app to reduce ship strikes. Launched in 2013 and called Spotter, the app was merged with Whale Alert . Follow the project blog .
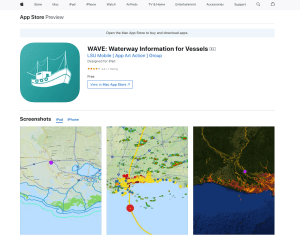
Louisiana Sea Grant and partners developed WAVE to assist boaters with charts, emergency preparedness, current conditions and more. The purpose of the app is to improve emergency preparedness for commercial fishermen and other users of the waterway.
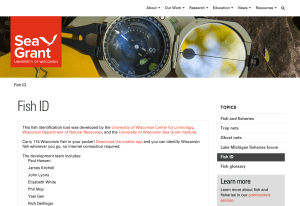
Wisconsin Fish ID
Wisconsin Sea Grant developed a fish identification tool for species found in Wisconsin waters. Serach by name or appearance. Content includes images and descriptions. The mobile app available for both iPhone and Android.

Shoreline Rhode Island
Shoreline Rhode Island provides over 300 public access points on the coast and bays of Rhode Island. The site allows users to search by activity and location. Rhode Island Sea Grant developed Shoreline Rhode Island as an update to a 2004 publication, Public Access to the Rhode Island Coast, which was published by Rhode Island Sea Grant and the URI Coastal Resources Center.
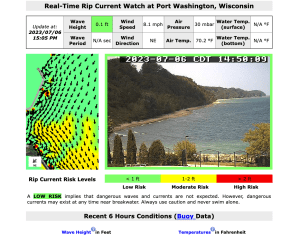
Rip Current Watch
Wisconsin Sea Grant and partners maintain the Rip Current Watch site to provide real-time data and forecasts for rip currents at Port Washington, Wisconsin. The information is also available via a mobile app for Android devices.
Video Guides
Sea grant video guides playlist, sea talk - beach injuries, boat safety: survival kit, 15 second science - the power of waves, increasing safety at sea caves, boat safety: emergency beacons and flares, 15 second science - small item, big issue for our coasts, avoid the trap: what anglers should know about commercial fishing nets, sea talk - catch and release fishing, what is barotrauma, sea talk - proper fishing bait disposal, buying tuna directly from a commercial fisherman, retiree in training: new york sea grant’s dave white (october 2022), nature attracts tourism (part 1), oregon's working waterfront tour trailer - oregon seagrant.
Volusia tourism leaders celebrate 10.1 million visitors in destination 'reset' year

DAYTONA BEACH ― Volusia County attracted 10.1 visitors in 2023, down from a record 10.6 million in 2022 , according to figures from the Daytona Beach Area Convention & Visitors Bureau.
The news was announced at a celebration event to mark National Travel & Tourism Week on Wednesday at Hard Rock Hotel.
Area tourism officials and other local leaders praised the strength of the area’s leading industry as they also acknowledged increasing competition for travelers as the impact of the COVID-19 pandemic continues fade into the past tense.
“That number reflects what we have been calling a ‘reset’ year, so we’re actually very pleased,” said Lori Campbell Baker, executive director of the Daytona Beach Area CVB. “The world has reopened. International travel is booming.”
Volusia's 2023 visitor total surpassed pre-pandemic 2019
As Florida emerged as one of the first states to re-open for tourists in the wake of pandemic-era restrictions, Volusia County’s record-setting 10.6 million visitor total in 2022 was the destination’s highest annual count since logging 10.2 million in 2018.
Although the 2023 visitor total failed to match that record high, Baker pointed out that it was better than the pre-COVID 2019 total of the 9.8 million.
“As always, we’re working to bring that total up,” she said. “Everything we do is geared toward attracting overnight visitors.”
In addition to a decline in visitors, Volusia County’s tourist development tax collections for the fiscal year that concluded on Sept. 30 finished 3.51% below the year-end total for 2021-22, according to figures from the Volusia County Revenue Division.
For the previous fiscal year that concluded on Sept. 30, 2022, record-high overall tourism bed-tax collections of $33.7 million countywide were more than 20% higher than the previous year, which also set a record.
The county collects a 6% tourism tax on hotels and lodges with half of the revenues going to fund the county-run Ocean Center convention complex in Daytona Beach. The other half goes to the county’s three tourism ad authorities to market their respective areas — the Daytona Beach/Halifax area, Southeast Volusia and West Volusia — as tourist and special event destinations.
Tourism trend also evident in statewide visitor total
The trend in Volusia County also is evident in statewide numbers.
In 2023, Florida welcomed an estimated 135 million tourists according to the Visit Florida tourism marketing agency. That's down from 137.4 million the year before, but up from 131.1 million in 2019, the last full year of data before the pandemic.
At Wednesday’s event, the contributions of the area’s tourism industry were heralded by host Bob Davis, president and CEO of the Lodging & Hospitality Association of Volusia County.
After nearly 60 years as a hotelier and tourism leader, Davis emphasized that connection among hotel owners, managers, small businesses, elected officials and educators was essential for success.
“It takes all of us together, working to make Volusia the No. 1 county in Florida,” Davis said. “We’re all in this together. We all have a part to play.”
That theme was echoed in presentations by leaders of the county’s three tourism advertising authorities representing the Halifax area, West Volusia and Southeast Volusia.
In case you missed it: After two record-setting years, Volusia tourism weathers downturn in 2023
There also were updates from Cyrus Callum, director of aviation and economic resources at Daytona Beach International Airport, Ocean Center Director Lynn Flanders and Volusia County Manager George Recktenwald.
Recktenwald offered thanks to county staff members and area businesses for contributing to the recovery from beach damage sustained during back-to-back tropical storms Ian and Nicole in fall 2022.
“The last 18 months touched us like never before,” said Recktenwald, adding that the future still holds the prospect of “significant investment” to ensure the condition of the area’s beaches. Yet he, too, was optimistic.
“The businesses, the hotels and the county’s environmental staff have acted swiftly to repair the damages,” he said. “Things are looking positive.”
10 things to know about tourism along North Carolina's coast

Whether you're looking for sandy beaches or cool mountain streams, North Carolina's got it. That's why the state has become a popular destination for those in the eastern United States.
Each year, Visit North Carolina, the unit of the Economic Development Partnership of North Carolina focused on travel and tourism, examines the data to determine just how much visitors contribute to the state and local economies. While the county breakdowns from 2023 won't be released until later this year, here's a look at data from 2022.
Summer bucket list: 24 things to do in 2024 in the Wilmington area
The state’s rank among U.S. states for domestic visitation.
New Hanover County's rank in visitor spending among North Carolina’s 100 counties.
11.2 million
The number of visitors who traveled to the state’s coastal region.
The number of those visitors who stayed overnight.
The most popular time for travelers to visit the coast.
Average party size for coastal visitors.
The percentage of travel parties that included children under 18.
The average expenditure for parties traveling to the coastal region in 2022.
Where did visitors travel from?
The top states of origin for overnight visitors to the coastal region in 2022 were: North Carolina, Virginia, Pennsylvania, South Carolina, Maryland, New York, New Jersey and Georgia.
The percentage of coastal region visitors in 2022 who were in-state residents.
Data Source: 2022 North Carolina Regional Visitor Profile, a publication of Visit North Carolina, a unit of the Economic Development Partnership of North Carolina. Research staff of Visit North Carolina created this report based on data from TravelTrakAmerica.
- [ May 11, 2024 ] Mother, Daughter Reunite With Health First First Flight Air Ambulance Crew Member 14 Years Later Brevard News
- [ May 11, 2024 ] Dr. Rafael Trespalacios of Tres Vision Group: Your Eyes Need an Arsenal of Antioxidants Brevard News
- [ May 11, 2024 ] WATCH: Cocoa Beach Native Kelly Slater Launches ‘Freaks of Nature’ Sunscreen Brand Brevard News
- [ May 11, 2024 ] WATCH: Cocoa Police Highlight K9 Hasko’s Training Session with Officer Mike Fitzgerald Brevard Crime News
- [ May 11, 2024 ] BREVARD HISTORY: Haulover Canal is Among Most Historic Sites on Merritt Island, Used as Early as 1606 By Indians and Explorers Brevard News
Home » Home » Florida Remains No. 1 Destination for Domestic Tourism in the US, Data Shows
Florida Remains No. 1 Destination for Domestic Tourism in the US, Data Shows
By Space Coast Daily // May 7, 2024
Florida ranks No. 2 for international tourism

TALLAHASSEE, FLORIDA – Governor Ron DeSantis announced that VISIT FLORIDA data shows that Florida has maintained its position as the No. 1 domestic tourist destination in the United States and remained a top destination for international visitors (ranking #2 in the country).
In 2023, Florida’s market share of domestic tourists increased to 14.8%, up from 13.8% in 2022.
This surge in market share represents the largest increase of any state, underscoring Florida’s appeal to travelers from across the country.
“Florida’s world class attractions, hospitality, and unwavering commitment to freedom have solidified our position as the top vacation destination,” said Governor Ron DeSantis. “These figures show that Florida continues to be on the right path, as we have insisted on prioritizing public safety and common-sense leadership.”

While Florida’s domestic market share increased from 2022, other formerly popular destinations saw negative shifts in their shares. California experienced a notable decline, losing 1.2 percentage points, while New York saw a decrease of 0.8 percentage points. With these shifts, Florida now leads the U.S. by a substantial margin, boasting a 2.7 percentage point advantage over California, securing its position as the premier destination for American travelers.
“Florida’s continued ability to attract visitors speaks volumes about the state’s appeal, both domestically and internationally. From our pristine beaches and serene state parks to the thrills of our world-renowned theme parks and vibrant cities, Florida continues to captivate visitors with its unmatched experiences,” said Dana Young, President and CEO of VISIT FLORIDA.
“We look forward to continuing to surpass all expectations and welcoming visitors to our beautiful state.”
Florida saw a noticeable uptick in overseas tourism in 2023. As the recovery of international travel continued, Florida garnered 25.2% of the overseas market share of travelers to the U.S.
In March 2024, overseas visitation to Florida surpassed pre-pandemic levels for the first time, with a 1.7% increase compared to March 2019.
Notably, visitation from key markets such as the UK, Germany, and Mexico saw significant growth, with UK visitation up by 12%, German visitation up by 28%, and Mexican visitation up 61% compared to the same month in 2019.
Similar Stories
Featured stories.

Click Here to Sign Up for Text Alerts
Or Signup Below For Email Alerts!
Assessment of land use and land cover change detection and prediction using deep learning techniques for the southwestern coastal region, Goa, India
- Published: 09 May 2024
- Volume 196 , article number 527 , ( 2024 )
Cite this article

- Nitesh Naik 1 ,
- Kandasamy Chandrasekaran 1 ,
- Venkatesan Meenakshi Sundaram 2 &
- Prabhavathy Panneer 3
17 Accesses
Explore all metrics
Understanding the connections between human activities and the natural environment depends heavily on information about land use and land cover (LULC) in the form of accurate LULC maps. Environmental monitoring using deep learning (DL) is rapidly growing to preserve a sustainable environment in the long term. For establishing effective policies, regulations, and implementation, DL can be a valuable tool for assessing environmental conditions and natural resources that will positively impact the ecosystem. This paper presents the assessment of land use and land cover change detection (LULCCD) and prediction using DL techniques for the southwestern coastal region, Goa, also known as the tourist destination of India. It consists of three components: (i) change detection (CD), (ii) quantification of LULC changes, and (iii) prediction. A new CD assessment framework, Spatio-Temporal Encoder-Decoder Self Attention Network (STEDSAN), is proposed for the LULCCD process. A dual branch encoder-decoder network is constructed using strided convolution with downsampling for the encoder and transpose convolution with upsampling for the decoder to assess the bitemporal images spatially. The self-attention (SA) mechanism captures the complex global spatial-temporal (ST) interactions between individual pixels over space-time to produce more distinct features. Each branch accepts the LULC map of 2 years as one of its inputs to determine binary and multiclass changes among the bitemporal images. The STEDSAN model determines the patterns, trends, and conversion from one LULC type to another for the assessment period from 2005 to 2018. The binary change maps were also compared with the existing state of the art (SOTA) CD methods, with STEDSAN having an overall accuracy of 94.93%. The prediction was made using an recurrent neural network (RNN) known as long short term memory network (LSTM) for the year 2025. Experiments were conducted to determine area-wise changes in several LULC classes, such as built-up (BU), crops (kharif crop (KC), rabi crop (RC), zaid crop (ZC), double/triple (D/T C)), current fallow (CF), plantation (PL), forests (evergreen forest (EF), deciduous forest (DF), degraded/scurb forest (D/SF) ), littoral swamp (LS), grassland (GL), wasteland (WL), waterbodies max (Wmx), and waterbodies min (Wmn). As per the analysis, over the period of 13 years, there has been a net increase in the amount of BU (1.25%), RC (1.17%), and D/TC( 2.42%) and a net decrease in DF (3.29%) and WL(1.44%) being the most dominant classes being changed. These findings will offer a thorough description of identifying trends in coastal areas that may incorporate methodological hints for future studies. This study will also promote handling the spatial and temporal complexity of remotely sensed data employed in categorizing the coastal LULC of a heterogeneous landscape.
This is a preview of subscription content, log in via an institution to check access.
Access this article
Price includes VAT (Russian Federation)
Instant access to the full article PDF.
Rent this article via DeepDyve
Institutional subscriptions
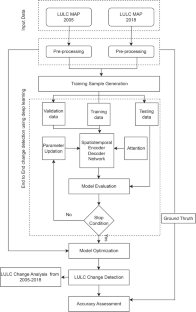
Availability of data and materials
The data that support the findings of this study are available from the National Remote Sensing Centre, ISRO, Government of India, Hyderabad, India, but restrictions apply to the availability of these data, which were used under license for the current study, and so are not publicly available. Data are however available from the authors upon reasonable request and with permission of the National Remote Sensing Centre, ISRO, Government of India, Hyderabad, India.
Code Availability
Not applicable
Abbreviations
Advanced wide field sensor
Cellular automata
Change detection
Current fallow
Convolutional neural network
Degraded/scrub forest
Double/triple crop
Deciduous forest
Decision tree
Deep learning
Deep neural network
Encoder decoder LSTM
Evergreen forest
False negative
False positive
Fully convolutional neural network
Genetic algorithm
Generative adversarial networks
Geographical information systems
Indian Space Research Organization
Kharif crop
Littoral swamp
Long short term memory network
Land use and land cover
Land use and land cover change
Land use and land cover change detection
Markov chain model
Mean intersection over union
Machine learning
Multilayer perceptron
National Remote Sensing Centre
Normalized Difference Built-up Index
Overall accuracy
Producer accuracy
Principal component analysis
Rectified linear unit
Random forest
- Recurrent neural network
Remote sensing
- Self-attention
Satellite image time series
State of the art
Spatial-temporal
Spatio-Temporal Encoder-Decoder Self Attention Network
Support vector machine
True negative
True positive
User accuracy
Waterbodies min
Waterbodies max
Extreme gradient boosting
Abdi, A. M. (2020). Land cover and land use classification performance of machine learning algorithms in a boreal landscape using sentinel-2 data. GIScience & Remote Sensing, 57 (1), 1–20.
Article Google Scholar
Ahmed, S.A., Shankar, B., et al. (2011). Planning for conservation of heritage areas in old Goa: Issues and strategies. IDES_CPS, Civil Engineering Series-Advances in Civil Engineering ACE , Ed., pp. 11–15.
Albert, A., Kaur, J., Gonzalez, M.C. (2017). Using convolutional networks and satellite imagery to identify patterns in urban environments at a large scale. In: Proceedings of the 23rd ACM SIGKDD international conference on knowledge discovery and data mining (pp. 1357–1366).
Al-Usmani, S. M. P. (2011). Impact of mining activities on land and water areas of Goa. Journal of Coastal Environment, 2 (1), 43–54.
Google Scholar
Ansari, Z., Achuthankutty, C., & Dalal, S. (2006). Overexploitation of fishry resources, with particular reference to Goa . India: TERI Press.
Arsanjani, J.J., et al. (2011). Dynamic land use/cover change modelling: Geosimulation and multiagent-based modelling . Springer Science & Business Media.
Bai, X., Sharma, R.C., Tateishi, R., Kondoh, A., Wuliangha, B., & Tana, G. (2017). A detailed and high-resolution land use and land cover change analysis over the past 16 years in the Horqin Sandy Land, inner Mongolia. Mathematical Problems in Engineering .
Bandara, C. Wele Gedara, Patel, V., et al. (2022). A transformer-based Siamese network for change detection. arXiv:2201.01293 .
Borkar, M. (2006). Sacred yet scientific; eco-theological basis of biodiversity conservation in Goa. Multiple dimensions of global environmental change , 182–194.
Bousias Alexakis, E., Armenakis, C., et al. (2021). Performance improvement of encoder/decoder-based CNN architectures for change detection from very high-resolution satellite imagery. Canadian Journal of Remote Sensing, 47 (2), 309–336.
Brauwers, G., Frasincar, F., et al. (2021). A general survey on attention mechanisms in deep learning. IEEE Transactions on Knowledge and Data Engineering .
Briassoulis, H. (2009) Factors influencing land-use and land-cover change. Land cover, land use and the global change, encyclopaedia of life support systems (EOLSS), 1 , 126–146.
Calderón-Loor, M., Hadjikakou, M., & Bryan, B. A. (2021). High-resolution wall-to-wall land-cover mapping and land change assessment for Australia from 1985 to 2015. Remote Sensing of Environment, 252 , 112148.
Campos-Taberner, M., García-Haro, F. J., Martínez, B., Izquierdo-Verdiguier, E., Atzberger, C., Camps-Valls, G., & Gilabert, M. A. (2020). Understanding deep learning in land use classification based on sentinel-2 time series. Scientific Reports, 10 (1), 1–12.
Chen, Z., Zhou, Y., Wang, B., Xu, X., He, N., Jin, S., & Jin, S. (2022). EGDE-NET: A building change detection method for high-resolution remote sensing imagery based on edge guidance and differential enhancement. ISPRS Journal of Photogrammetry and Remote Sensing, 191 , 203–222.
Cheng, H., Wu, H., Zheng, J., Qi, K., & Liu, W. (2021). A hierarchical self-attention augmented Laplacian pyramid expanding network for change detection in high-resolution remote sensing images. ISPRS Journal of Photogrammetry and Remote Sensing, 182 , 52–66.
Choudri, B., Chachadi, A., et al. (2006). Status of groundwater availability and recharge in the mining watersheds of North Goa . Multiple dimensions of global environmental change: TERI Press.
Commission of India, P. (2011). Goa Development Report . https://niti.gov.in/planningcommission.gov.in/docs/plans/stateplan/sdr/sdr_goa1909.pdf . Accessed 17 Oct 2022.
De Sousa, S. (1999). Effect of mining rejects on the nutrient chemistry of Mandovi estuary, Goa.
Du, B., Ru, L., Wu, C., & Zhang, L. (2019). Unsupervised deep slow feature analysis for change detection in multi-temporal remote sensing images. IEEE Transactions on Geoscience and Remote Sensing, 57 (12), 9976–9992.
Ekim, B., Sertel, E., et al. (2021). Deep neural network ensembles for remote sensing land cover and land use classification. International Journal of Digital Earth , 1–14.
gee-assessment-tools (2020). Area estimation and accuracy assessment . https://area2.readthedocs.io/en/latest/background.html/ . Accessed 24 Nov 2022.
Gharbia, R., Khalifa, N.E.M., & Hassanien, A.E. (2020). Land cover classification using deep convolutional neural networks. In: International conference on intelligent systems design and applications (pp. 911–920).
Girap, M. (2006). Remote sensing and application of GIS in natural resources management with reference to land-use/land-cover in the state of Goa. Multiple dimensions of global environmental change , 83.
Giri, C., Long, J., Abbas, S., Murali, R. M., Qamer, F. M., Pengra, B., & Thau, D. (2015). Distribution and dynamics of mangrove forests of South Asia. Journal of Environmental Management, 148 , 101–111.
Glorot, X., Bengio, Y., et al. (2010). Understanding the difficulty of training deep feedforward neural networks. In: Proceedings of the thirteenth international conference on artificial intelligence and statistics (pp. 249–256).
Han, H., Yang, C., & Song, J. (2015). Scenario simulation and the prediction of land use and land cover change in Beijing China. Sustainability, 7 (4), 4260–4279.
He, T., Wang, S., et al. (2021). Multi-spectral remote sensing land-cover classification based on deep learning methods. The Journal of Supercomputing, 77 (3), 2829–2843.
Hochreiter, S., Schmidhuber, J., et al. (1997). Long short-term memory. Neural Computation, 9 (8), 1735–1780.
Article CAS Google Scholar
Hu, Y., Zhen, L., & Zhuang, D. (2019). Assessment of land-use and land-cover change in Guangxi China. Scientific Reports, 9 (1), 1–13.
ISFR (2019). India state of forest report . Ministry of Environment Forest and Climate Change Dehradun.
Jakati, D. M. (2021). Development of mining in Goa and its environmental impacts-a geographical perspective. PalArch’s Journal of Archaeology of Egypt/Egyptology, 18 (7), 2979–2988.
Jamali, A. (2021). Improving land use land cover mapping of a neural network with three optimizers of multi-verse optimizer, genetic algorithm, and derivative-free function. The Egyptian Journal of Remote Sensing and Space Science, 24 (3), 373–390.
Kalinicheva, E., Sublime, J., & Trocan, M. (2020). Unsupervised satellite image time series clustering using object-based approaches and 3D convolutional autoencoder. Remote Sensing, 12 (11), 1816.
Kerins, P., Guzder-Williams, B., Mackres, E., Rashid, T., & Pietraszkiewicz, E. (2021). Mapping urban land use in India and Mexico using remote sensing and machine learning.
Kingma, D.P., Ba, J., et al. (2014) Adam: A method for stochastic optimization. arXiv:1412.6980 .
Kotha, M., Kunte, P., et al. (2013). Land-cover change in Goa–An integrated RS–GIS approach.
Kulkarni, K., Vijaya, P., et al. (2021). NDBI based prediction of land use land cover change. Journal of the Indian Society of Remote Sensing, 49 (10), 2523–2537.
Kunte, P. D., Jauhari, N., Mehrotra, U., Kotha, M., Hursthouse, A. S., & Gagnon, A. S. (2014). Multi-hazards coastal vulnerability assessment of Goa, India, using geospatial techniques. Ocean & Coastal Management, 95 , 264–281.
Lambin, E. F., Turner, B. L., Geist, H. J., Agbola, S. B., Angelsen, A., Bruce, J. W., Coomes, O. T., Dirzo, R., Fischer, G., & Folke, C. (2001). The causes of land-use and land-cover change: Moving beyond the myths. Global Environmental Change, 11 (4), 261–269.
Liang, J., Xu, J., Shen, H., & Fang, L. (2020). Land-use classification via constrained extreme learning classifier based on cascaded deep convolutional neural networks. European Journal of Remote Sensing, 53 (1), 219–232.
Liu, R., Cheng, Z., Zhang, L., & Li, J. (2019). Remote sensing image change detection based on information transmission and attention mechanism. IEEE Access, 7 , 156349–156359.
Lv, Z., Liu, T., Benediktsson, J. A., & Falco, N. (2021). Land cover change detection techniques: Very-high-resolution optical images: A review. IEEE Geoscience and Remote Sensing Magazine, 10 (1), 44–63.
Lyu, H., Lu, H., & Mou, L. (2016). Learning a transferable change rule from a recurrent neural network for land cover change detection. Remote Sensing, 8 (6), 506.
Mahender, K., Kunte, P., et al. (2013). Land cover change in Goa: An integrated RS-GIS approach.
Mascarenhas, A. (1999). The coastal regulation zone of Goa: Oceanographic, environmental and societal perspectives. Current Science, 77 (12), 1598–1605.
Mascarenhas, A. (2009). Some implications of coastal regulation zone (CRZ) legislation for the coast of Goa . Geological Society of Goa, Dhempe College, Miramar, Goa (India).
Misra, A., Vethamony, P., et al. (2015). Assessment of the land use/land cover (LU/LC) and mangrove changes along the Mandovi-Zuari estuarine complex of Goa, India. Arabian Journal of Geosciences, 8 (1), 267–279.
Mnih, V., Heess, N., Graves, A., et al. (2014). Recurrent models of visual attention. Advances in neural information processing systems .
Mou, L., Bruzzone, L., & Zhu, X. X. (2018). Learning spectral-spatial-temporal features via a recurrent convolutional neural network for change detection in multispectral imagery. IEEE Transactions on Geoscience and Remote Sensing, 57 (2), 924–935.
Murali, R.M., Vethamony, P., Saran, A., & Jayakumar, S. (2006). Change detection studies in coastal zone features of Goa, India by remote sensing. Current Science , 816–820.
Nagi, H.M., Rodrigues, R.S., ManiMurali, R., & Jagtap, T. (2014). Using remote sensing and GIS techniques for detecting land cover changes of mangrove habitats in Goa, India.
Nandargi, S., Mulye, S., et al. (2014). Spatio-temporal rainfall variability and rainstorm analysis over the Goa state, India. Studies in Atmospheric Science, 1 , 8–23.
Ngoy, K. I., Qi, F., & Shebitz, D. J. (2021). Analyzing and predicting land use and land cover changes in New Jersey using multi-layer perceptron-Markov chain model. Earth, 2 (4), 845–870.
Noronha, L., Siqueira, A., Sreekesh, S., Qureshy, L., & Kazi, S. (2002). Goa: Tourism, migrations, and ecosystem transformations. AMBIO: A Journal of the Human Environment, 31 (4), 295–302.
NRSC, H. (2010). National land use and land cover mapping using multi-temporal AWiFS data . https://bhuvan-app1.nrsc.gov.in/2dresources/thematic/LULC250/0809.pdf . Accessed 14 Dec 2022.
Olofsson, P., Foody, G. M., Herold, M., Stehman, S. V., Woodcock, C. E., & Wulder, M. A. (2014). Good practices for estimating area and assessing accuracy of land change. Remote Sensing of Environment, 148 , 42–57.
Panandiker, A.P., de Mello, L., Kotha, M., & Chachadi, A. (2021). Examining the temporal change in land cover/land use in five watersheds in Goa, India using a geospatial approach. In: Re-envisioning remote sensing applications (pp. 193–208). CRC Press.
Pandey, P. C., Koutsias, N., Petropoulos, G. P., Srivastava, P. K., & Ben Dor, E. (2021). Land use/land cover in view of earth observation: Data sources, input dimensions, and classifiers-a review of the state of the art. Geocarto International, 36 (9), 957–988.
Panuju, D. R., Paull, D. J., & Griffin, A. L. (2020). Change detection techniques based on multispectral images for investigating land cover dynamics. Remote Sensing, 12 (11), 1781.
Pati, C., Panda, A. K., Tripathy, A. K., Pradhan, S. K., & Patnaik, S. (2020). A novel hybrid machine learning approach for change detection in remote sensing images. Engineering Science and Technology, an International Journal, 23 (5), 973–981.
Pednekar, S.M., Prabhu Matondkar, S., & Kerkar, V. (2012). Spatiotemporal distribution of harmful algal flora in the tropical estuarine complex of Goa, India. The Scientific World Journal, 2012 .
Peng, D., Bruzzone, L., Zhang, Y., Guan, H., Ding, H., & Huang, X. (2020). SemiCDNet: A semisupervised convolutional neural network for change detection in high resolution remote-sensing images. IEEE Transactions on Geoscience and Remote Sensing .
Peng, D., Bruzzone, L., Zhang, Y., Guan, H., & He, P. (2021). SCDNET: A novel convolutional network for semantic change detection in high resolution optical remote sensing imagery. International Journal of Applied Earth Observation and Geoinformation, 103 , 102465.
Rajesh, S., Nisia, T. G., Arivazhagan, S., & Abisekaraj, R. (2020). Land cover/land use mapping of LISS IV imagery using object-based convolutional neural network with deep features. Journal of the Indian Society of Remote Sensing, 48 (1), 145–154.
Ramachandran, P., Parmar, N., Vaswani, A., Bello, I., Levskaya, A., & Shlens, J. (2019). Stand-alone self-attention in vision models. arXiv:1906.05909 .
Ranjan, R. (2018). The role of political-industry nexus in promoting illegal extraction of mineral resources and deforestation: A case of iron ore mining in Goa. Resources Policy, 57 , 122–136.
Riebsame, W., Meyer, W., & Turner, B. (1994). Modeling land use and cover as part of global environmental change. Climatic Change, 28 (1–2), 45–64.
Rousset, G., Despinoy, M., Schindler, K., & Mangeas, M. (2021). Assessment of deep learning techniques for land use land cover classification in southern new Caledonia. Remote Sensing, 13 (12), 2257.
Roy, A., Srivastava, V., et al. (2012). Geospatial approach to identification of potential hotspots of land-use and land-cover change for biodiversity conservation. Current Science , 1174–1180.
Roy, P., Giriraj, A., et al. (2008). Land use and land cover analysis in Indian context. Journal of Applied Sciences, 8 (8), 1346–1353.
Rußwurm, M., Körner, M., et al. (2017). Multi-temporal land cover classification with long short-term memory neural networks. International Archives of the Photogrammetry, Remote Sensing & Spatial Information Sciences, 42 .
Samanta, S., Kunte, P.D., & Mahender, K. (2012). Coastal geomorphology and land use changes along coastal parts of Goa: An RS-GIS approach.
Sampath Kumar, P., Mahtab, A., Roy, A., Srivastava, V., Roy, P., & Isro, D. (2014). Impact of drivers on the land use/land cover change in Goa, India. In: Proceedings of the international symposium, India geospatial forum, hyderabad, India (pp. 5–7).
Santos, L. A., Ferreira, K., Picoli, M., Camara, G., Zurita-Milla, R., & Augustijn, E.-W. (2021). Identifying spatiotemporal patterns in land use and cover samples from satellite image time series. Remote Sensing, 13 (5), 974.
Sarupria, M., Manjare, S. D., & Girap, M. (2019). Environmental impact assessment studies for mining area in Goa, India, using the new approach. Environmental Monitoring and Assessment, 191 (1), 1–17.
Sefrin, O., Riese, F. M., & Keller, S. (2021). Deep learning for land cover change detection. Remote Sensing, 13 (1), 78.
Series, I.R.S.S. (2013). National natural resources management system.
Shi, W., Zhang, M., Zhang, R., Chen, S., & Zhan, Z. (2020). Change detection based on artificial intelligence: State-of-the-art and challenges. Remote Sensing, 12 (10), 1688.
Shirin, C., Yogita, M., & Anuradha, J. (2006). Depletion of fresh water in the mining regions of Goa, India: Gendered impacts and responses. Multiple dimensions of global environmental change, 44 .
Sibanda, S., Ahmed, F., et al. (2021). Modelling historic and future land use/land cover changes and their impact on wetland area in Shashe sub-catchment, Zimbabwe. Modeling Earth Systems and Environment, 7 (1), 57–70.
Silva, S. D., Nielsen, K. B., & Bedi, H. P. (2020). Land use planning, dispossession and contestation in Goa, India. The Journal of Peasant Studies, 47 (6), 1301–1326.
Singh, G., Kamal, R. K., et al. (2015). Assessment of groundwater quality in the mining areas of Goa, India. Indian Journal of Science and Technology, 8 (6), 588.
Singh, I., Singh, S., Kushwaha, S., Ashutosh, S., & Singh, R. (2004). Assessment and monitoring of estuarine mangrove forests of Goa using satellite remote sensing. Journal of the Indian Society of Remote Sensing, 32 (2), 167–174.
Sonak, S., Kazi, S., Sonak, M., & Abraham, M. (2006). Factors affecting land-use and land-cover changes in the coastal wetlands of Goa . Citeseer.
State biodiversity board, G. (2019). State action plan on climate change for the state of Goa. https://gsbb.goa.gov.in/wp-content/uploads/2020/12/Draft-Goa%20SAPCC-for-public-inputs.pdf . Accessed 09 Jan 2023.
Town, Country Planning, G.o.G. (2011). Regional plan Goa 2021 . https://tcp.goa.gov.in/land-use-plan-regional-plan- for-goa-2021/ . Accessed 27 Dec 2022.
Turner, B.L., Clark, W.C., Kates, R.W., Richards, J.F., Mathews, J.T., & Meyer, W.B. (1993). The earth as transformed by human action: Global and regional changes in the biosphere over the past 300 years . Cambridge University Press.
Vaswani, A., Shazeer, N., Parmar, N., Uszkoreit, J., Jones, L., Gomez, A.N., Kaiser, Ł., & Polosukhin, I. (2017). Attention is all you need. Advances in neural information processing systems, 30 .
Vaz, E., Taubenböck, H., Kotha, M., & Arsanjani, J. J. (2017). Urban change in Goa, India. Habitat International, 68 , 24–29.
Verma, D., Jana, A., et al. (2019). LULC classification methodology based on simple convolutional neural network to map complex urban forms at finer scale: Evidence from Mumbai. arXiv:1909.09774 .
Wang, D., Chen, X., Jiang, M., Du, S., Xu, B., & Wang, J. (2021). ADS-NET: An attention-based deeply supervised network for remote sensing image change detection. International Journal of Applied Earth Observation and Geoinformation, 101 , 102348.
Wang, X., Girshick, R., Gupta, A., & He, K. (2018). Non-local neural networks. In: Proceedings of the IEEE conference on computer vision and pattern recognition (pp. 7794–7803).
Wilson, D. (1997). Paradoxes of tourism in Goa. Annals of Tourism Research, 24 (1), 52–75.
Yang, X. (2020). An overview of the attention mechanisms in computer vision. In: Journal of physics: Conference series (vol. 1693, pp 012173).
Yedage, A., Harmalkar, S., et al. (2017). S. analysis and simulation of land use/land cover change in the Quepem Tehsil Goa, India. Journal of Advances in Remote Sensing and GIS, 5 (1), 67–76.
Yedage, A., Sawant, N., & Malave, V. (2015). Change detection analysis using geo-spatial technique: A case study of south Goa. Studies, 10 , 11.
You, Y., Cao, J., & Zhou, W. (2020). A survey of change detection methods based on remote sensing images for multi-source and multi-objective scenarios. Remote Sensing, 12 (15), 2460.
Zhang, C., Yue, P., Tapete, D., Jiang, L., Shangguan, B., Huang, L., & Liu, G. (2020). A deeply supervised image fusion network for change detection in high resolution bi-temporal remote sensing images. ISPRS Journal of Photogrammetry and Remote Sensing, 166 , 183–200.
Zheng, Z., Zhong, Y., Tian, S., Ma, A., & Zhang, L. (2022). ChangeMask: Deep multi-task encoder-transformer-decoder architecture for semantic change detection. ISPRS Journal of Photogrammetry and Remote Sensing, 183 , 228–239.
Zhu, Q., Guo, X., Deng, W., Guan, Q., Zhong, Y., Zhang, L., & Li, D. (2022). Land-use/land-cover change detection based on a Siamese global learning framework for high spatial resolution remote sensing imagery. ISPRS Journal of Photogrammetry and Remote Sensing, 184 , 63–78.
Download references
Acknowledgements
The authors would like to thank the National Remote Sensing Centre, Indian Space Research Organization (ISRO), Government of India, Hyderabad, India, for providing time series data in form of LULC maps from 2005–06 to 2017–18 for the Goa Region.
Author information
Authors and affiliations.
Department of Computer Science and Engineering, National Institute of Technology, Surathkal, Mangalore, 575025, Karnataka, India
Nitesh Naik & Kandasamy Chandrasekaran
Department of Computer Science and Engineering, National Institute of Technology, Puducherry, Karaikal, 609609, Puducherry, India
Venkatesan Meenakshi Sundaram
School of Information Technology and Engineering, Vellore Insitute of Technology, Katpadi, Vellore, 632014, TamilNadu, India
Prabhavathy Panneer
You can also search for this author in PubMed Google Scholar
Contributions
All authors contributed to the study conception and design. Material preparation, data collection, and analysis were performed by Nitesh Naik, Kandasamy Chandrasekaran, Meenakshi Venkatesan Sundaram, and Prabhavathy Panneer. The first draft of the manuscript was written by Nitesh Naik, and all authors commented on previous versions of the manuscript. All authors read and approved the final manuscript.
Corresponding author
Correspondence to Nitesh Naik .
Ethics declarations
Ethical approval, consent to participate, conflict of interest.
The authors declare no competing interests.
Additional information
Publisher's note.
Springer Nature remains neutral with regard to jurisdictional claims in published maps and institutional affiliations.
Rights and permissions
Springer Nature or its licensor (e.g. a society or other partner) holds exclusive rights to this article under a publishing agreement with the author(s) or other rightsholder(s); author self-archiving of the accepted manuscript version of this article is solely governed by the terms of such publishing agreement and applicable law.
Reprints and permissions
About this article
Naik, N., Chandrasekaran, K., Meenakshi Sundaram, V. et al. Assessment of land use and land cover change detection and prediction using deep learning techniques for the southwestern coastal region, Goa, India. Environ Monit Assess 196 , 527 (2024). https://doi.org/10.1007/s10661-024-12598-y
Download citation
Received : 30 March 2022
Accepted : 29 March 2024
Published : 09 May 2024
DOI : https://doi.org/10.1007/s10661-024-12598-y
Share this article
Anyone you share the following link with will be able to read this content:
Sorry, a shareable link is not currently available for this article.
Provided by the Springer Nature SharedIt content-sharing initiative
- Encoder-decoder
- Find a journal
- Publish with us
- Track your research
IMAGES
COMMENTS
Tourism and Recreation. Tourism and recreation support a wide range of businesses in the nation's shore-adjacent zip codes, from restaurants, hotels, aquariums, and marinas to boat manufacturers and sporting goods stores. The following facts are based on the latest available economic data 1 (2018).
The global coastal and maritime tourism market size was estimated at USD 2.9 trillion in 2021 and is expected to expand at a CAGR of 5.7% from 2022 to 2030, according to Grand View Research, Inc ... Historical data. 2017 - 2020. Forecast period. 2022 - 2030. Quantitative units. Revenue in USD billion and CAGR from 2022 to 2030.
Coastal and marine tourism constitutes approximately 50 percent of all global tourism, equal to US$4.6 trillion or 5.2 percent of global gross domestic product (GDP). It is a vital component of the economy of small islands and coastal communities.
1.0 Executive Summary: Key Findings. The Center for Ecotourism and Sustainable Development (CESD), a policy oriented research institute committed to providing analysis and tools for sustainable tourism development, was commissioned by the World Wildlife Fund (WWF) to assess the current trends and drivers behind coastal and cruise tourism. This ...
Inventory of Coastal Recreation and Tourism Data 1.0 INTRODUCTION The nation's coasts are host to a multitude of travel, tourism, and recreation activities, which have the potential to generate social and economic benefits as well as impact the coastal environment.
UN Tourism systematically collects tourism statistics from countries and territories around the world in an extensive database that provides the most comprehensive repository of statistical information available on the tourism sector. This database consists mainly of more than 145 tourism indicators that are updated regularly. You can explore the data available through the UNWTO database below:
Coastal tourism comprises recreational activities taking place in the proximity of the sea (such as swimming, sunbathing, coastal walks, and wildlife watching) as well as those taking place in the maritime area, including nautical sports (e.g. sailing, scuba diving, cruising, etc.). Over half of the EU bed capacity is concentrated in regions ...
Data: Coastal Tourism GDP data was taken from NOAA's Office of Coastal Management Economics National Ocean Watch custom report building tool, with contextual data taken from the 2019 NOAA Report on the U.S. Ocean and Great Lakes Economy: Regional and State Profiles. Growth was estimated by subtracting the previous year's Coastal Tourism GDP ...
The new realities have awakened a new approach to tourism, particularly from island and coastal nations. In 2020 the High Level Panel for a Sustainable Ocean Economy (Ocean Panel) set a goal of a sustainable tourism economy by 2030: "Coastal and ocean-based tourism is sustainable, resilient, addresses climate change, reduces pollution ...
International Tourism and COVID-19. Export revenues from international tourism dropped 62% in 2020 and 59% in 2021, versus 2019 (real terms) and then rebounded in 2022, remaining 34% below pre-pandemic levels. The total loss in export revenues from tourism amounts to USD 2.6 trillion for that three-year period. Go to Dashboard.
Social media data are an accurate and extensive proxy for nature-based tourism and recreation across a broad expanse of natural systems 2,7,8,9,10,11,12, including for on-reef and overall coastal ...
More than half of all tourism involves a coastal or marine destination, and blue tourism annually accounts for 4.6 trillion US dollar or 5.2% of the global gross domestic product 1.Coastal ...
In 2019, travel and tourism contributed more than 10% of the world's GDP and employed some 333 million people—one in every eleven jobs. About 80% of all tourism is concentrated in coastal areas, beach holidays and activities like diving, sports fishing, and cruising make up a significant part of the blue economy worldwide.
We know that sustainable ocean-based tourism can restore and protect the ocean while delivering jobs and prosperity. However, achieving this ambitious vision requires strategic public and private investments. This special report outlines an approach for sustainable coastal and marine tourism that increases the focus on regeneration and resilience.
Climate is an essential component in the sustainability of tourism cities. Coastal tourism cities face unprecedented challenges under a changing climate. The complexity of the tourism-climate interface predicates the need for tools that can assess the weather and climate accurately. Tourism climate indices have been widely developed to evaluate the temporal and spatial distribution of ...
The socioeconomics of the Anthropocene is exposing coastal regions to multiple pressures, including climate change hazards, resource degradation, urban development and inequality. Tourism is often raised as either a panacea to, or exacerbator of, such threats to ecosystems and sustainable livelihoods. To better understand the impacts of tourism ...
Firstly, we used "plastic pollution, marine tourism" and "plastic pollution, coastal tourism" to search data. Initially, a total of 203 documents were retrieved from the search. Secondly, for getting high-quality results only research articles were included in the data set in this study (Zhang & Quoquab, 2022). Therefore, proceedings ...
Coastal tourism is gradually becoming an important branch of tourism activities (Honey and Krantz, 2007; Hall, 2001). In China and other countries worldwide, sunshine, beaches and seafood are the most attractive aspects of coastal tourism. ... meteorological data, soil property data, data elevation model (DEM) and socioeconomic data. The data ...
We compiled remotely sensed data of monthly SST and Chlo- a from the exclusive economic zone (EEZ) of coastal areas globally for a 18-year period (2003-2020). Data were used to generate summary ...
For example, in the BE data set, there were 13 non-English papers out of 476 research papers that were analyzed (four Chinese, three Russian, three Spanish, two Italian, and one Portuguese). The same was observed in the coastal tourism data set, where out of 46 research papers, there were only three non-English papers (two Chinese and one Russian).
Therefore, tourism blog data provides a new channel for studying experiencescape in coastal tourism destinations. A weighted aggregation of awareness, popularity, and size rankings was used to identify the three best Chinese travel sites: Ctrip, Mafengwo, and Qunar ( Qu et al., 2022 ).
Coastal Tourism in Great Britain: Generated £17.1bn tourism spend. 27m overnight visits, 217m day visits. Supported 285,000 tourism related jobs. 10% of all international visitors that arrive in UK go to coast. The Coast comprises a very high rate of SMEs (with less than 3% corporate brands represented) Coastal Tourism in England is highly ...
Louisiana Direct Seafood. Louisiana Direct Seafood is a web-based resource to help coastal fishermen connect directly with consumers and build community support for a fresh, local, product 'straight from the boat'.The site is a partnership effort between Louisiana Sea Grant and LSU Ag Center. In addition to connecting fishermen and consumers, this initiative is also focused on quality ...
Tourism trend also evident in statewide visitor total. ... That's down from 137.4 million the year before, but up from 131.1 million in 2019, the last full year of data before the pandemic.
7th. New Hanover County's rank in visitor spending among North Carolina's 100 counties. 11.2 million. The number of visitors who traveled to the state's coastal region.
Florida ranks No. 2 for international tourism Governor Ron DeSantis announced that VISIT FLORIDA data shows that Florida has maintained its position as the No. 1 domestic tourist destination in ...
These findings will offer a thorough description of identifying trends in coastal areas that may incorporate methodological hints for future studies. This study will also promote handling the spatial and temporal complexity of remotely sensed data employed in categorizing the coastal LULC of a heterogeneous landscape. ... population and tourism ...