- AI Marketing
- App Store Optimization
- Apple Search Ads
- Growth Marketing
- Mobile Marketing
- Mobile Game Marketing
- Performance Marketing
- Customer Engagement
- Marketing Automation
- In-app Messaging
- iOS Push Notifications
- Android Push Notifications
- SMS Marketing
- Mobile Attribution
- Mobile Measurement Partners
- Crash Reporting
- App Monitoring
- A/B Testing
- Mobile Game Monetization
- Subscription Platforms
- Paywall Platforms
- App Investors
- Social Media Marketing
- TikTok Marketing
- Mobile Ad Networks
- CTV Advertising
- In-game Advertising
- Ad Exchanges
- Ad Fraud Tools
- Mobile Ad Analytics
- Mobile DSPs
- Retargeting
- App Installs
- Browse all Categories
- Content Lock
- Incentivized Ads
- Interstitial
- Offer Walls
- Rewarded Video
- Browse all Ad Formats
- Pay Per Call
- Programmatic
- Real Time Bidding
- Self Service
- Augmented Reality
- Browse all Platforms
- Los Angeles
- San Francisco
- App Builders
- Mobile Games
- Entertainment
- Browse all Offer Types
- Lead Generation
- Sweepstakes
- App Marketing
- User Acquisition
- App Engagement
- App Development
- App Revenue
- App Analytics
- Subscriptions
- App Benchmarks
- App Sectors
- App Reports
- App Rankings
- App Growth Awards
- News & Announcements
- App Leaders


Travel App Revenue and Usage Statistics (2024)
Updated: May 16, 2024
The online travel booking industry was one of the hardest hit by the coronavirus pandemic, with some apps reporting more than 70 percent less traffic and bookings than 2019.
It took two years for most online travel agencies, hotels, and airlines to see a return to form, although for some the levels of revenue and occupancy are still below 2019 figures.

Fire Up Your Growth!
Moburst propelled leading brands like Google, Reddit, and Uber to the next level. Let’s ignite your Success journey today!
One of the ways Booking.com and Expedia have managed to maintain their market share is through the acquisition of competitor websites and apps. Booking owns Priceline.com, KAYAK, and Agoda, while Expedia Group has Orbitz, Travelocity, and Vrbo in its portfolio.
Another way the duopoly has continued is through an expansion to services offered. Both Booking and Expedia have branched out into flights, car rental, experiences, taxis, and cruises. The model is similar across both platforms, with the OTA receiving a small commission for each booking.
The aim is to be a one-stop destination for a holiday, similar to how a travel agency pre-internet would organise the flight, transport, hotel, and events in a packaged holiday.
Airbnb has started this augmentation as well, with the introduction of Experiences in 2016. It also started to promote long-term stays in 2020, in response to the pandemic halting short-term travel. Transport and co-working services may be next on its list.
Even though Booking, Expedia and Airbnb are the three main platforms, there are others, such as Hopper, TripAdvisor and Trip.com.
We have collected data and statistics on the online travel booking market. Read on below to find out more.
Key Travel App Statistics
- The travel app market generated $629 billion in revenue last year, a 13% increase on the previous year
- Booking generated the most revenue out of all online travel agencies in 2023
- Over 850 million people used a travel app in 2023
- Expedia holds a slight lead in the US market, at 19.3% market share
- Booking was the most downloaded travel app in 2023, with over 80 million downloads

Travel App Report 2024
Want to learn more about the travel app industry? In our Travel App report , we cover financials, usage, downloads, and demographics by age and gender, alongside market share, and benchmarks.
Top Travel Apps
Travel app revenue.
The travel app industry generated $629 billion revenue in 2022, with hotels and accommodation responsible for the majority of that.
Travel app global revenues 2016 to 2023 ($bn)
Travel revenue by app.
Booking Holdings remained the top online travel agency company in terms of revenue in 2023.
Travel booking app revenues 2017 to 2023 ($bn)
Travel app users.
Just over 850 million people used travel apps in 2023, another increase but still shy of 2019 levels.
Travel booking app users 2016 to 2023 (mm)
Travel app market share united states.
Expedia has a lead in the US market, however, Booking has been catching up in recent years.
Travel booking app market share in United States 2023 (%)
Travel app downloads.
Booking had the highest annual downloads worldwide, followed by Airbnb.
Travel booking downloads by app 2023 (mm)
More travel & local app data.
- Airbnb Revenue and Usage Statistics (2024)
- Hopper Revenue and Usage Statistics (2024)
- Booking Revenue and Usage Statistics (2024)
- Expedia Revenue and Usage Statistics (2024)
- Zillow Revenue and Usage Statistics (2024)
- what3words Revenue and Usage Statistics (2024)
- Taxi App Revenue and Usage Statistics (2024)
- Vrbo Revenue and Usage Statistics (2024)
- Uber Revenue and Usage Statistics (2024)
- Lyft Revenue and Usage Statistics (2024)

By signing up you agree to our privacy policy . You can opt out anytime.
- Skift Research
- Airline Weekly
- Skift Meetings
- Daily Lodging Report

U.S. Traveler In-Destination Mobile Usage Survey 2018
Related reports, report overview.
Our U.S. Traveler In-Destination Mobile Behavior 2018 survey provides valuable insight into how mobile fits into the in-destination journey for U.S. leisure travelers. Today, mobile has a role to play throughout the in-destination journey, and the majority of U.S. travelers are taking advantage of the assistance and services mobile devices can offer. The very personal nature of mobile that makes it so popular with travelers, however, presents a challenge for travel brands to figure out how best to embed themselves into the in-destination journey.
In this report, we map out the in-destination journey in 15 parts to delve more closely into how travelers are using mobile at each step. We look specifically at mobile usage for different parts of the journey, what specific tasks travelers use mobile for, and which apps travelers use. We then present results by two key demographic parameters: age and household income. While mobile usage overall is nearly ubiquitous, there are clear gaps in mobile use between different parts of the in-destination journey and key players within each part. For those who are behind, it’s urgent to play catch-up.
Survey Methodology
Skift Research’s U.S. Traveler In-Destination Mobile Behavior Survey 2018 collected responses from 1,671 respondents who live in the U.S. To qualify for the survey, respondents needed to have taken at least one leisure trip in the past 12 months that included at least one-night’s paid stay and was 50 miles or more from home. They also had to use their mobile phone for purposes other than voice calling and text messaging while traveling for leisure, such as using mobile apps or browsing mobile websites. The respondent group also met quotas of gender, age, region, and combined household income based on the sample of U.S. travelers represented in the Bureau of Labor Statistics’ 2016 Consumer Expenditure Survey. The survey was fielded by a trusted third-party consumer panel provider.
What You'll Learn From This Report
- How U.S. travelers use mobile throughout the in-destination journey, from air travel, to accommodations, tours and activities, and more
- What tasks travelers use mobile to accomplish for different parts of their trips
- The specific apps travelers use at each part of the in-destination journey
- How mobile app use compares to mobile website use
- Major apps used at each stage of the in-destination journey
- Key differences in mobile use in-destination based on age
- Key differences in mobile use in-destination based on household income
Executive Summary:
In July 2014, Skift Research first identified a trend we called “the rise of the silent traveler.” In a report by this name , we wrote about this new wave of “silent travelers,” who preferred to use their mobile devices instead of in-person interaction for numerous tasks throughout the in-destination journey. At that time, the group was heavily skewed toward young and tech-savvy professionals, and innovative travel brands were just starting to cater to the group’s new and evolving needs. Fast forward to today, and travelers of all ages and demographic characteristics are turning to mobile at all points in the travel journey.
Travel brands and destinations are aware of the central role of mobile for travelers. The challenge of adapting to the needs of mobile-centric travelers still exists, however. Many questions still need to be addressed to most effectively interact with travelers: What do travelers use mobile for? How should I invest in app development versus a mobile-optimized website? At what point in the travel journey are travelers actually turning to mobile to accomplish tasks? The highly personal nature of mobile devices and the huge amount of information that travelers can access through them present challenges for travel brands looking to embed themselves into the in-destination journey. Brands that are able to do this successfully by offering the most relevant and compelling services have a lot to gain.
To fully understand the extent and scope of in-destination mobile usage, we surveyed and mapped mobile behavior of U.S. travelers along 15 parts of the in-destination journey, from air travel, to ground transportation, accommodations, tours and activities, and more. In this survey, we look specifically at how many travelers are using mobile at each stage, what they are using it for, and the apps they use.
Mapping the In-Destination Journey: Mobile Use Is Prevalent Throughout
To structure this report, we created a 15-part, in-destination journey and asked respondents about their mobile usage at each stage. The results of our survey show that mobile is highly used throughout. More than half of travelers have used mobile at eight out of the 15 parts, while around one-third have done so during the other seven parts.

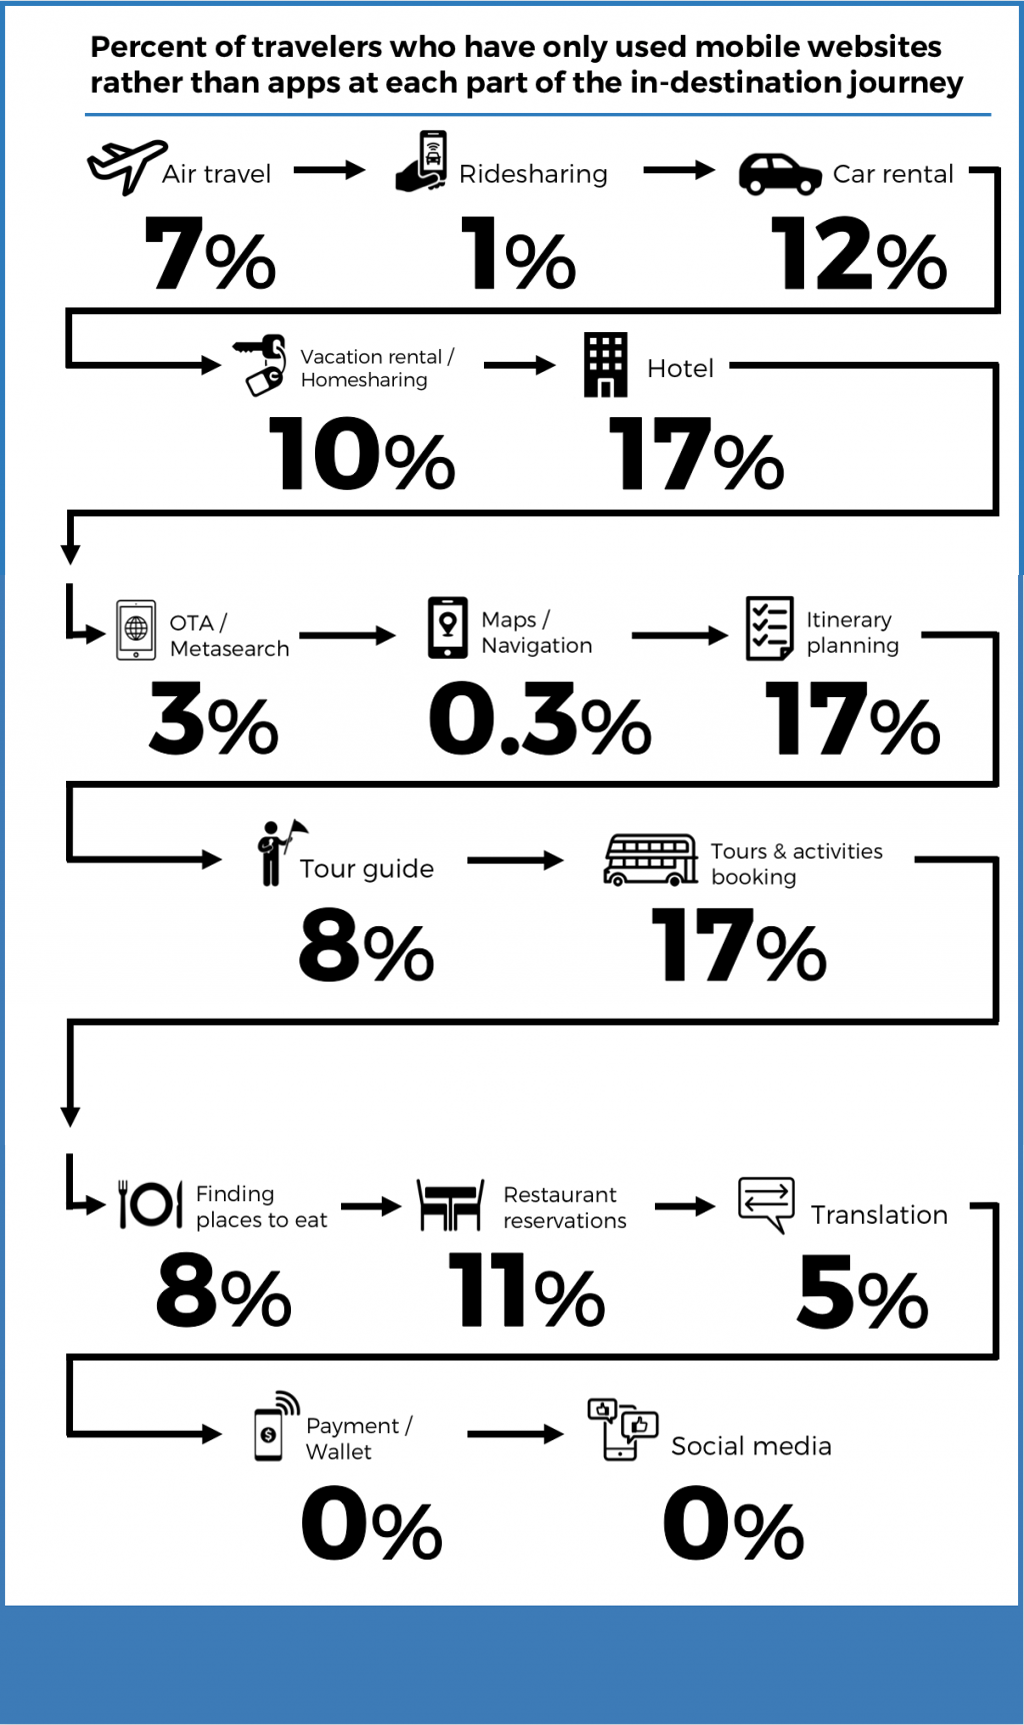
Mobile Apps vs. Mobile Websites: Apps Are Widely Used
While travelers may use a mix of apps and mobile websites to accomplish tasks in-destination, we found that the large majority of travelers have used apps at each part of the journey on past trips. The journey map below shows the percentage of travelers who have only used mobile websites rather than apps to accomplish tasks along the in-destination journey. On average, just under 8% of travelers have never used an app for these purposes in-destination, but have used only mobile websites instead.
Travel Mobile App Fragmentation: Many Players Are on the Field, but Major Players Still Dominate
We asked respondents who reported using mobile at each part of the journey which apps they have used. We found that for 13 out of 15 parts, there are at least 10 apps that respondents have used. Specific app usage at different part of the journey means different things. For air travel, car rental, and accommodation-related apps, the app used almost always coincides with the particular service provider travelers select. Familiarity with the app and its ease of use also come into play. In the case of air travel for instance, Southwest Airlines stands out as the most used app, which correlates with its high download frequency and ratings in app stores. For other parts, specific app usage is directly linked to market share. For instance, 87% of ridesharing users have used Uber and 85% of social media users have used Facebook.
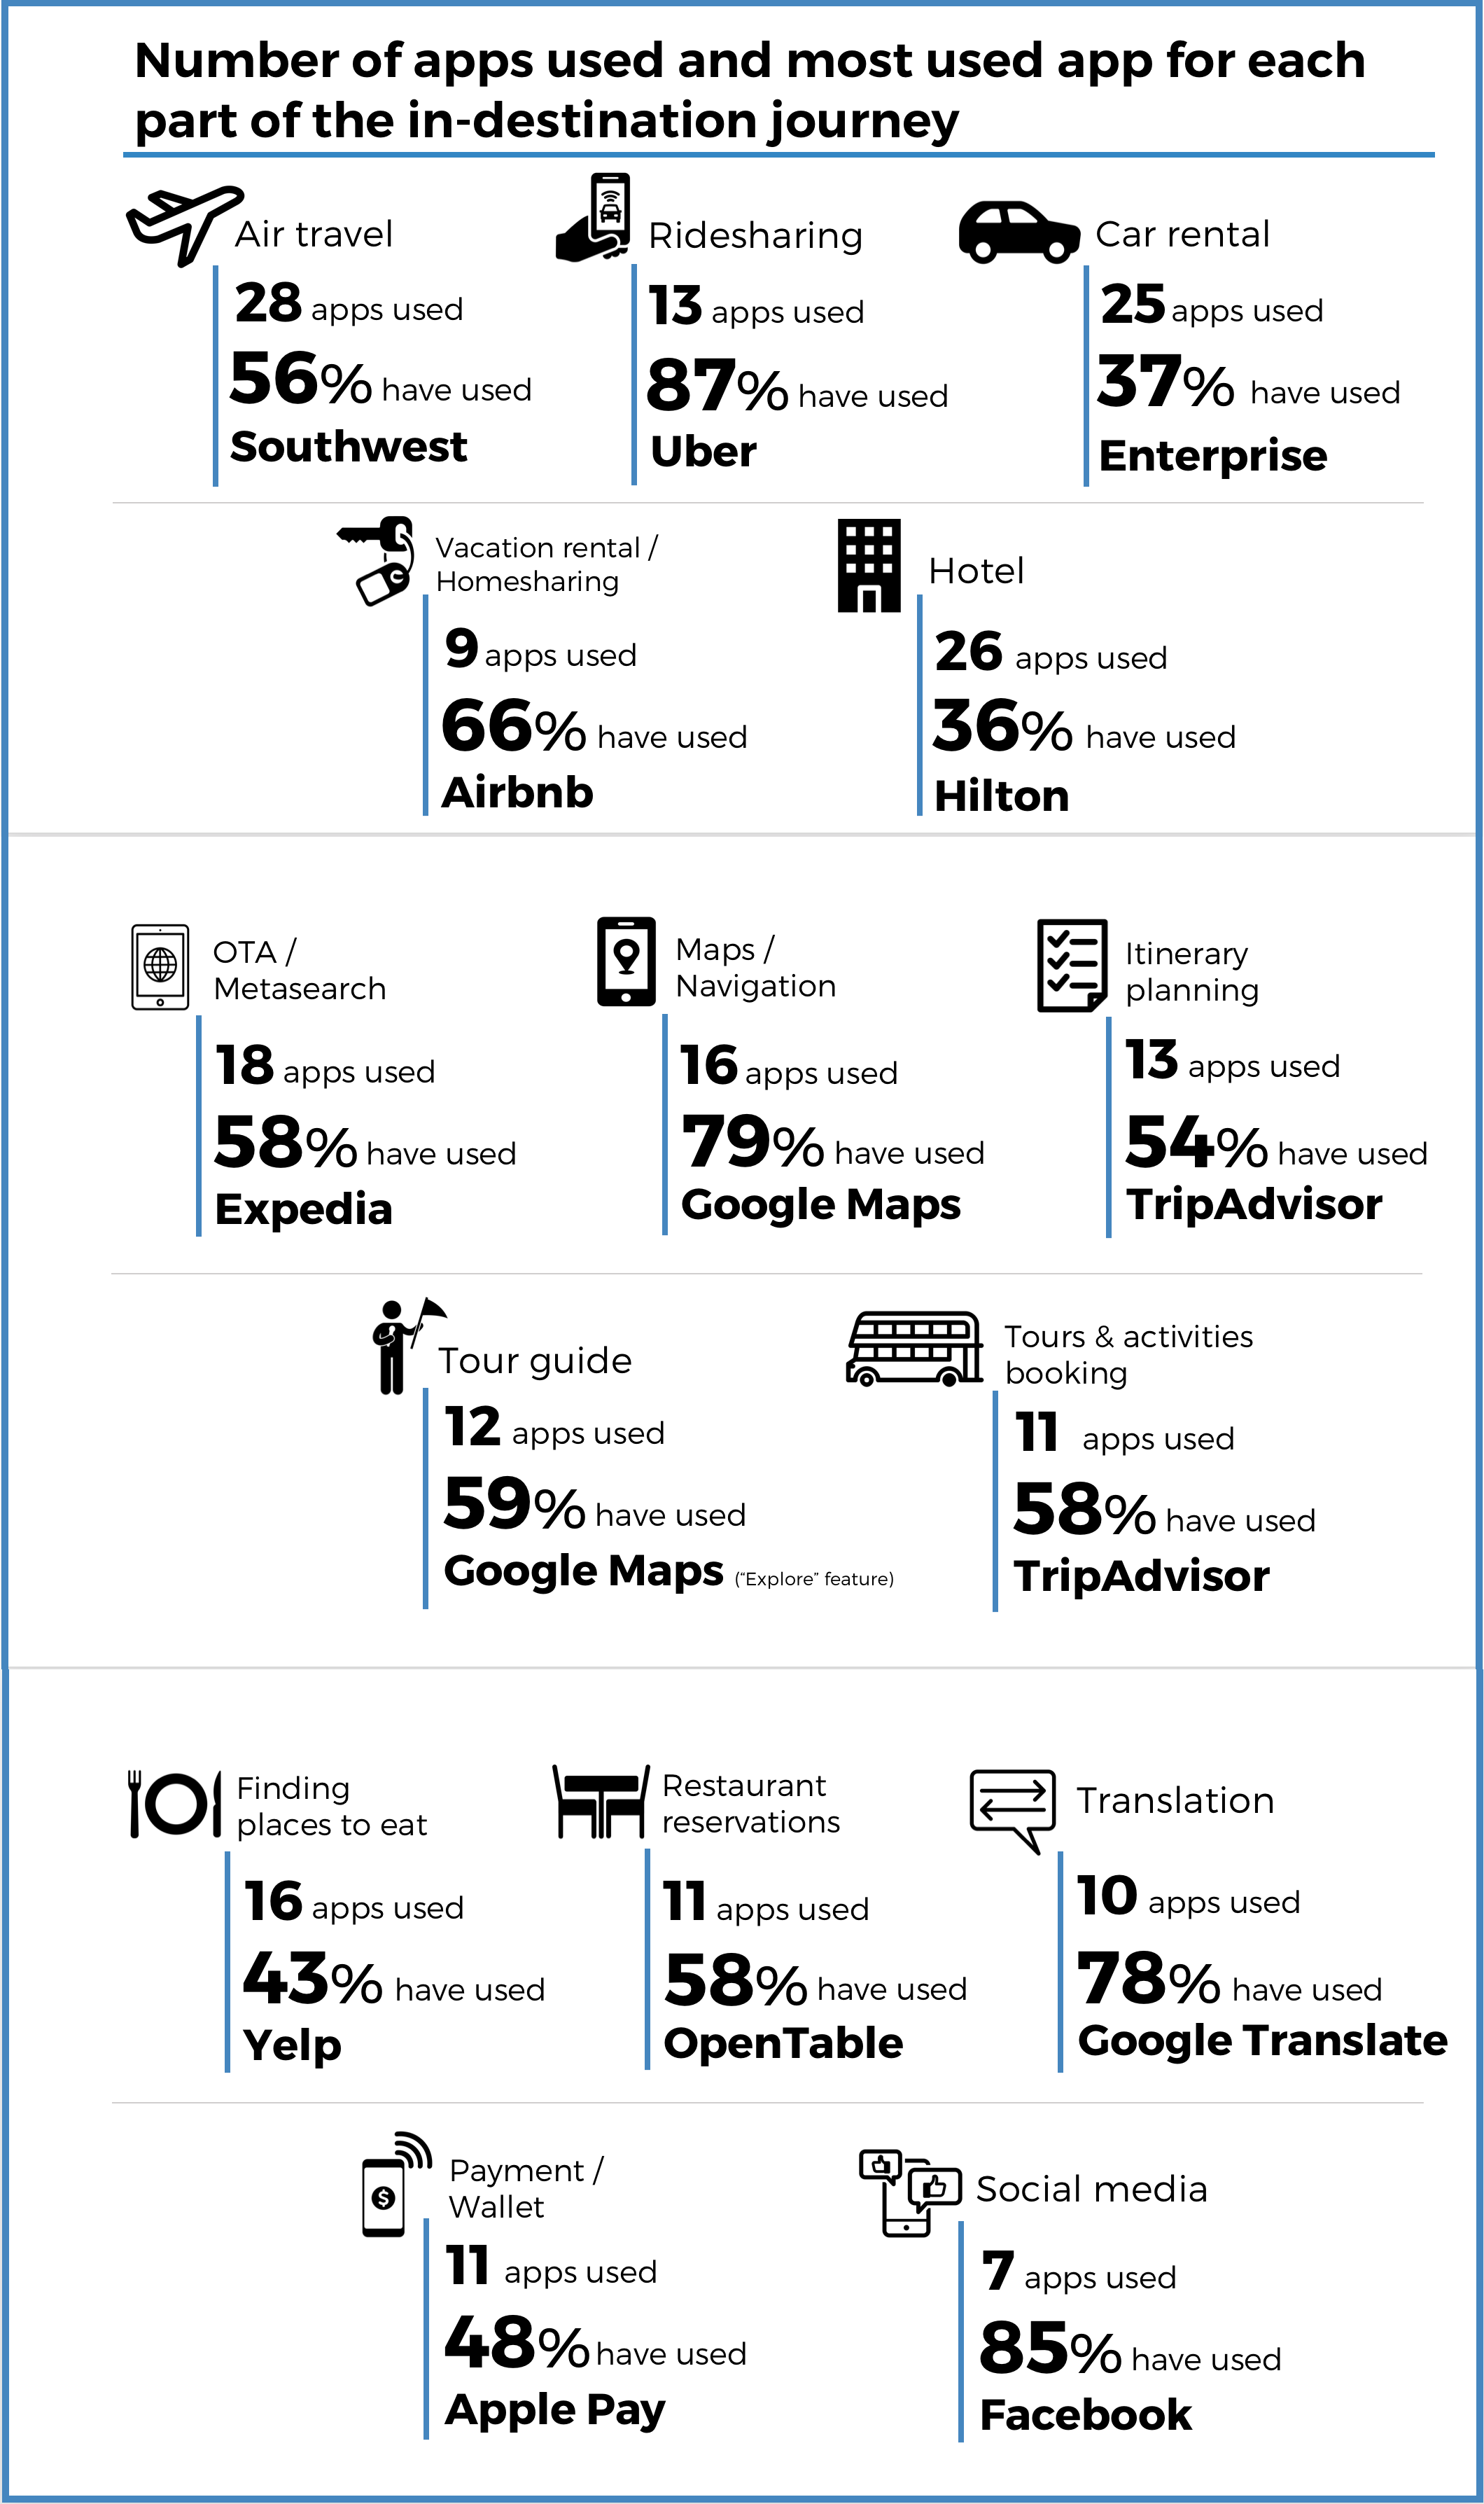
The sheer number of apps that our respondents report having used indicates that travelers tend to gravitate toward mobile apps and travel brands should pay attention to this when considering app development. Even in areas where certain companies dominate app use, there is still room for other players to enter the in-destination journey. According to estimates by the World Economic Forum in its white paper Digital Transformation Initiative: Aviation, Travel and Tourism Industry , the overall digitalization of the travel industry from 2016 to 2025 is expected to migrate $100 billion of value from incumbent brands to new competitors. Apps are one area where this is likely to be observed over time.
A Closer Look at Each Part of the In-Destination Mobile Journey
With 82% of travelers having used their mobile phones for air-travel related reasons, this is one of the most common areas for mobile use in-destination. Air travel is also the part of the in-destination journey where travelers have used the highest number of apps, with respondents having used 28 airline apps overall. Despite the high number of apps used, there are clear leaders in terms of app market share. The most commonly used airline app, Southwest, has been used by 56% of respondents, 20 data points higher than second-most used, Delta.
It’s no surprise that the air travel tasks most travelers use mobile for are tracking a flight’s status (73%) and checking in for a flight (61%). Airlines should also pay attention to the numbers of people who use mobile apps for booking-related tasks: 38% used mobile apps to book a new flight, 21% used them to change a reservation, and 13% used them to rebook a flight. Contrary to pre-trip planning which often involves a lot of time and research, in-destination booking needs to be fast and easy. A user-friendly mobile app designed with this in mind can be a great channel to increase sales.
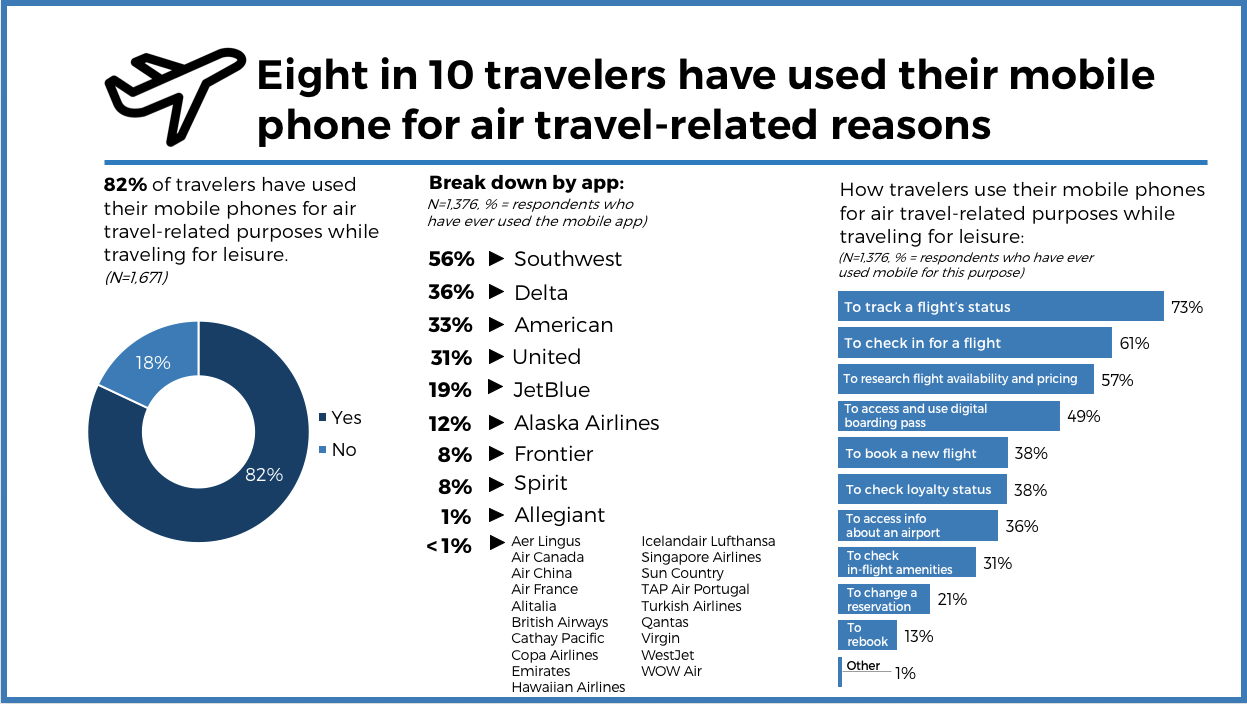
Airlines don’t have to be the only players connecting with travelers during this part of the journey, however. Airports and third-party developers also have an important role to play in making the trip seamless and enjoyable. As you will see above, 36% of travelers who have used their mobile phones for air-travel related purposed did so to access information about a particular airport. Accordingly, many airports are working on their own mobile-based digital initiatives. In its 2017 report Air Transport IT Trends Insights , SITA, an air transport information technology and communications company, found that over 60% of airports have implemented or plan to implement location-based mobile connected services or promotions using beacons or sensors by 2020. More specifically, 85% of airports have implemented or plan to implement mobile services to assist with in-airport navigation, and 82% have or plan to implement mobile services to provide notifications about the airport, such as wait time at security. As these initiatives come to fruition and airports and airlines continue to adopt more advanced mobile technology for customers, we can expect that air travel will retain its place as a mobile-centric part of the in-destination journey.
Ridesharing
Over half of travelers have used mobile to access ridesharing services while traveling for leisure. Uber dominates this space, with its app having been used by 87% of those who have ever used ridesharing services while traveling. Uber’s main rival, Lyft, comes in second place in our survey, with 48% of travelers using its app in the past. Besides these two apps, respondents reported using 11 other ridesharing apps, some of which are only available outside of the U.S., indicating that some respondents continue to use mobile even when traveling abroad. In fact, 31% of respondents indicated that they typically purchase data roaming plans for their mobile phones when traveling abroad.

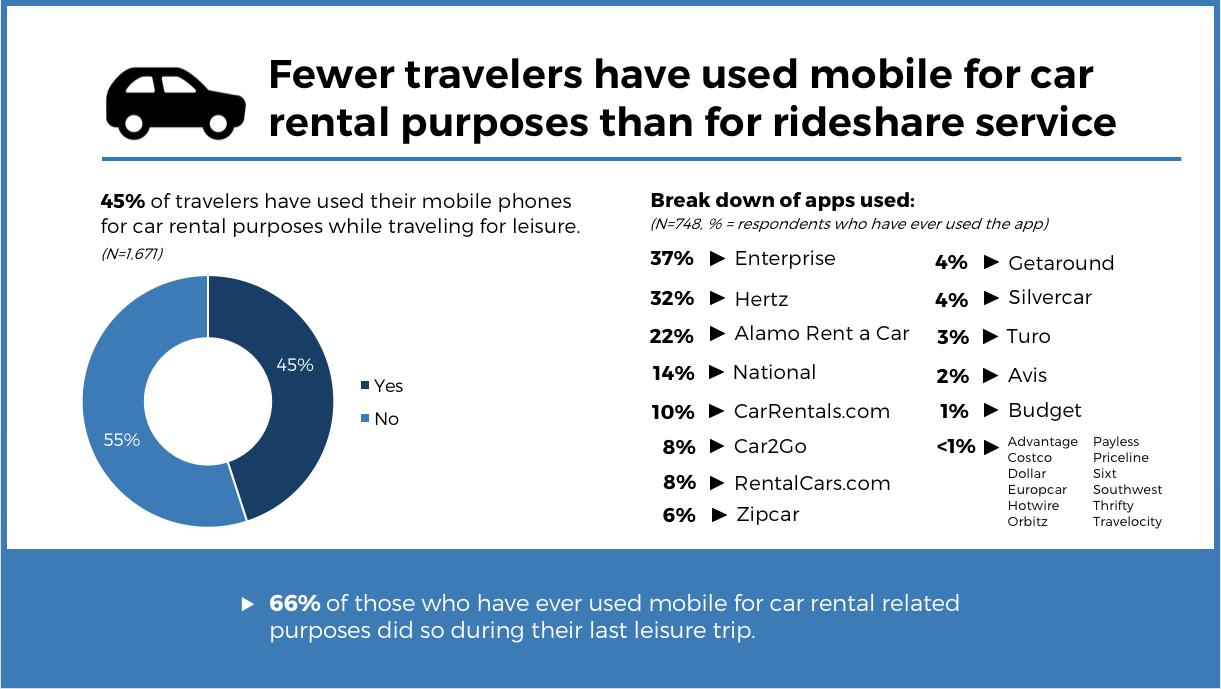
It is less common for travelers to use their mobile phones for car rental purposes than for ridesharing. Less than half of respondents have used mobile for car rental purposes while traveling for leisure. Of those who have, about two-thirds did so during their last leisure trip as well. Respondents have used 25 different car rental apps. Even so, three companies (Enterprise, Hertz, and Alamo Rent a Car) get the most use by travelers, with each being used by more than one-fifth of them.
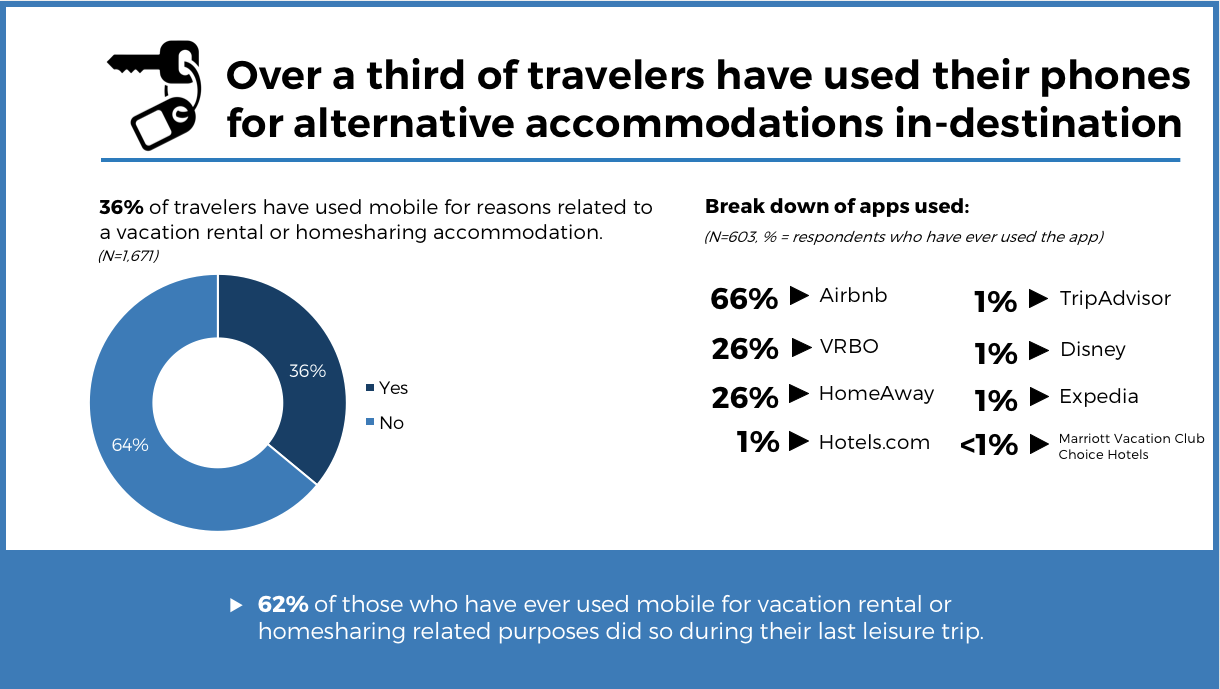
Alternative Accommodations
Just over one-third of travelers have used mobile for reasons related to a vacation rental or homesharing accommodation while traveling for leisure. This number is fairly low overall, but it reflects overall usage of alternative accommodations that we have found in our previous survey projects. In our U.S. Experiential Traveler Survey 2018 , we found that 33% of respondents had used Airbnb during a past leisure trip. The specific app usage is also closely associated with the market share of the vacation rental / homesharing market. While travelers report using nine apps in this category, 66% have used Airbnb.
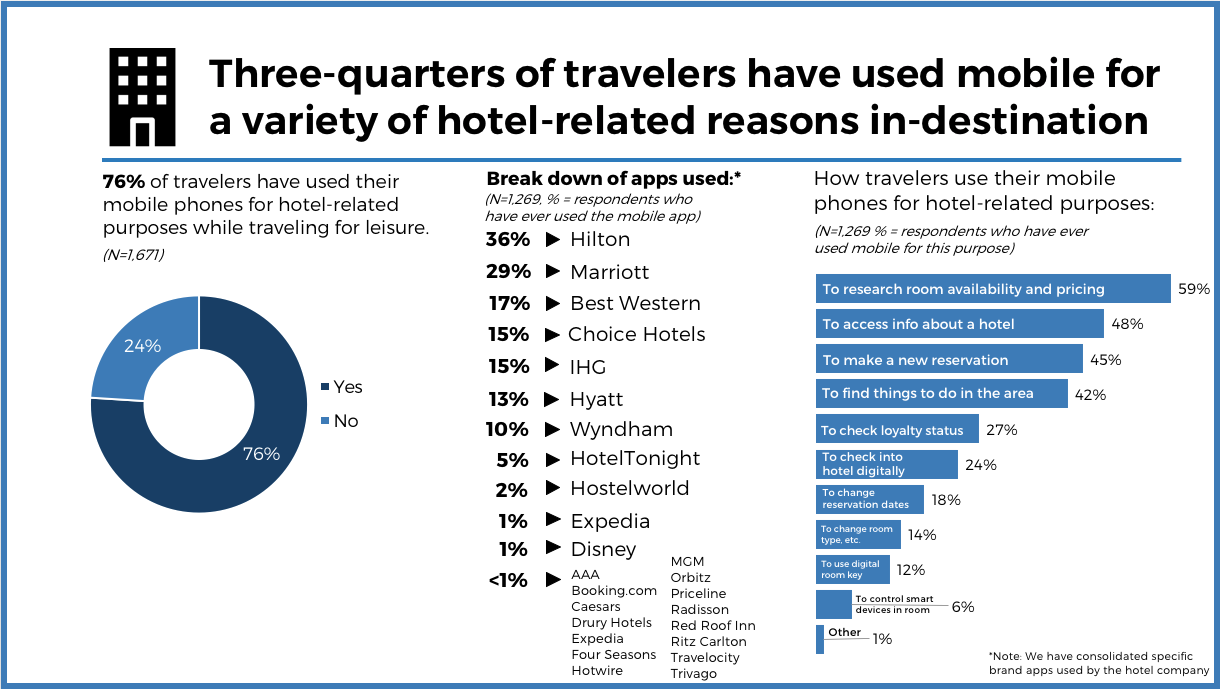
Three-quarters of travelers have used mobile for hotel-related reasons, making it the fourth most popular area of mobile use on the in-destination journey. Respondents reported using 26 different hotel apps. For the sake of clarity, we grouped brand-specific apps that were reported by hotel company. The high number of apps that have been used, especially for individual hotel brands, signals that travelers are responding to marketing efforts to promote hotel apps and the functionality and services they provide. Overall, Hilton has the most used apps, with 36% of respondents using an app for one of its brands, and Marriott follows, with 29% of respondents using a Marriott brand’s app.
How exactly are travelers using mobile for hotel-related purposes while in-destination? Our survey indicates four main hotel-related tasks: researching room availability and pricing, accessing information about a hotel, making a new reservation, and finding things to do in the area around a hotel. Even with all the recent rollouts of new guest-facing mobile technology in hotels, like smart guestrooms , digital check-in , and digital room keys , we found that few respondents have used these innovations. Given the newness of some of this technology, and the fact that it is usually first implemented in upper-scale and luxury hotels, it is likely that most travelers have not yet had a chance to take advantage of it. There is also the concern about adoption. Even as this technology becomes more widely available to guests, will they use it? This is an area of mobile use that will be interesting to track over the coming years.
In the meantime, hotels can implement programs to help encourage adoption of these types of mobile technologies, which can ultimately free up employees’ time to focus on more important tasks. Marriott, for example, ran a promotion earlier this year at some of its locations for Starwood Preferred Guests that rewarded loyalty points for using the mobile check-in functionality on the loyalty program app. Offering incentives like these can help facilitate the behavioral shift that is needed to make new mobile solutions the norm.
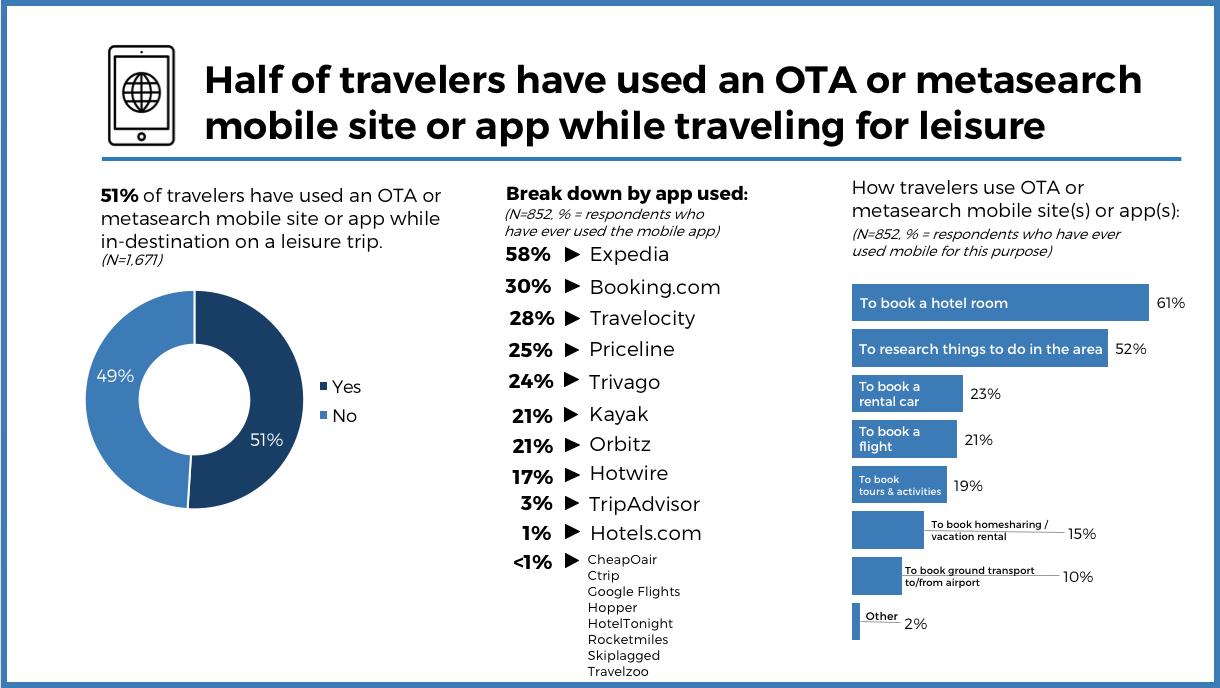
Online Travel Agencies and Metasearch
Just over half of travelers have used an online travel agency (OTA) or metasearch mobile site or app while in-destination. Expedia takes the lion’s share of app use, with 58% of respondents reporting using its app in the past. That half of all travelers use these types of mobile sites or apps when in-destination is significant, especially because of how they are using them. Three of the top four most commonly performed tasks at this part of the journey are related to booking different parts of a trip. This reflects the growing trends of mobile and spontaneous travel booking. In its report U.S. State of Travel , media measurement and analytics company comScore estimated that mobile travel spend has grown 4.5 times from 2014 to 2017. In comparison, mobile retail spend grew just two times in the same period.
Think with Google noted a similar trend in its 2017 survey Traveler Attitudes and Behaviors. This survey found that after researching travel on their smartphones, 79% of travelers then made a booking, compared to 70% in 2016. As travelers become more open to last-minute booking and more comfortable making travel transactions on mobile, it expands the window travel brands have to turn a traveler into a customer.
Maps and Navigation
The most common part of the in-destination journey for travelers to use mobile is maps and navigation. Nine out of ten travelers have ever used mobile maps or navigational assistance while traveling for leisure, and nearly as many did so on their last trip as well. For travelers, using mobile for this purpose is not simply something that’s nice to have. Nearly three-quarters often or always rely on mobile maps or navigation assistance to get around vacation destinations. App use in this space is dominated by Google Maps, which has been used by 79% of travelers who have used mobile at this part of the in-destination journey.

Itinerary Planning
Seven in 10 travelers have used mobile apps or websites to help them plan their vacation itinerary or find things to do while traveling for leisure. Of those who have, 73% also did so during their last leisure trip. TripAdvisor is the most commonly used app in this category, with 54% of travelers using it for this part of the in-destination journey, followed by Yelp.

At this stage of the journey, mobile apps or websites are used as tours guides, providing information about a destination’s attractions, often based on a traveler’s geolocation. This is the third least-common part of the in-destination mobile journey for U.S. travelers, with just 31% reporting that they’ve used a mobile app or website that serves this function in the past. Of this group, 72% also used mobile for this purpose on their last leisure trip.
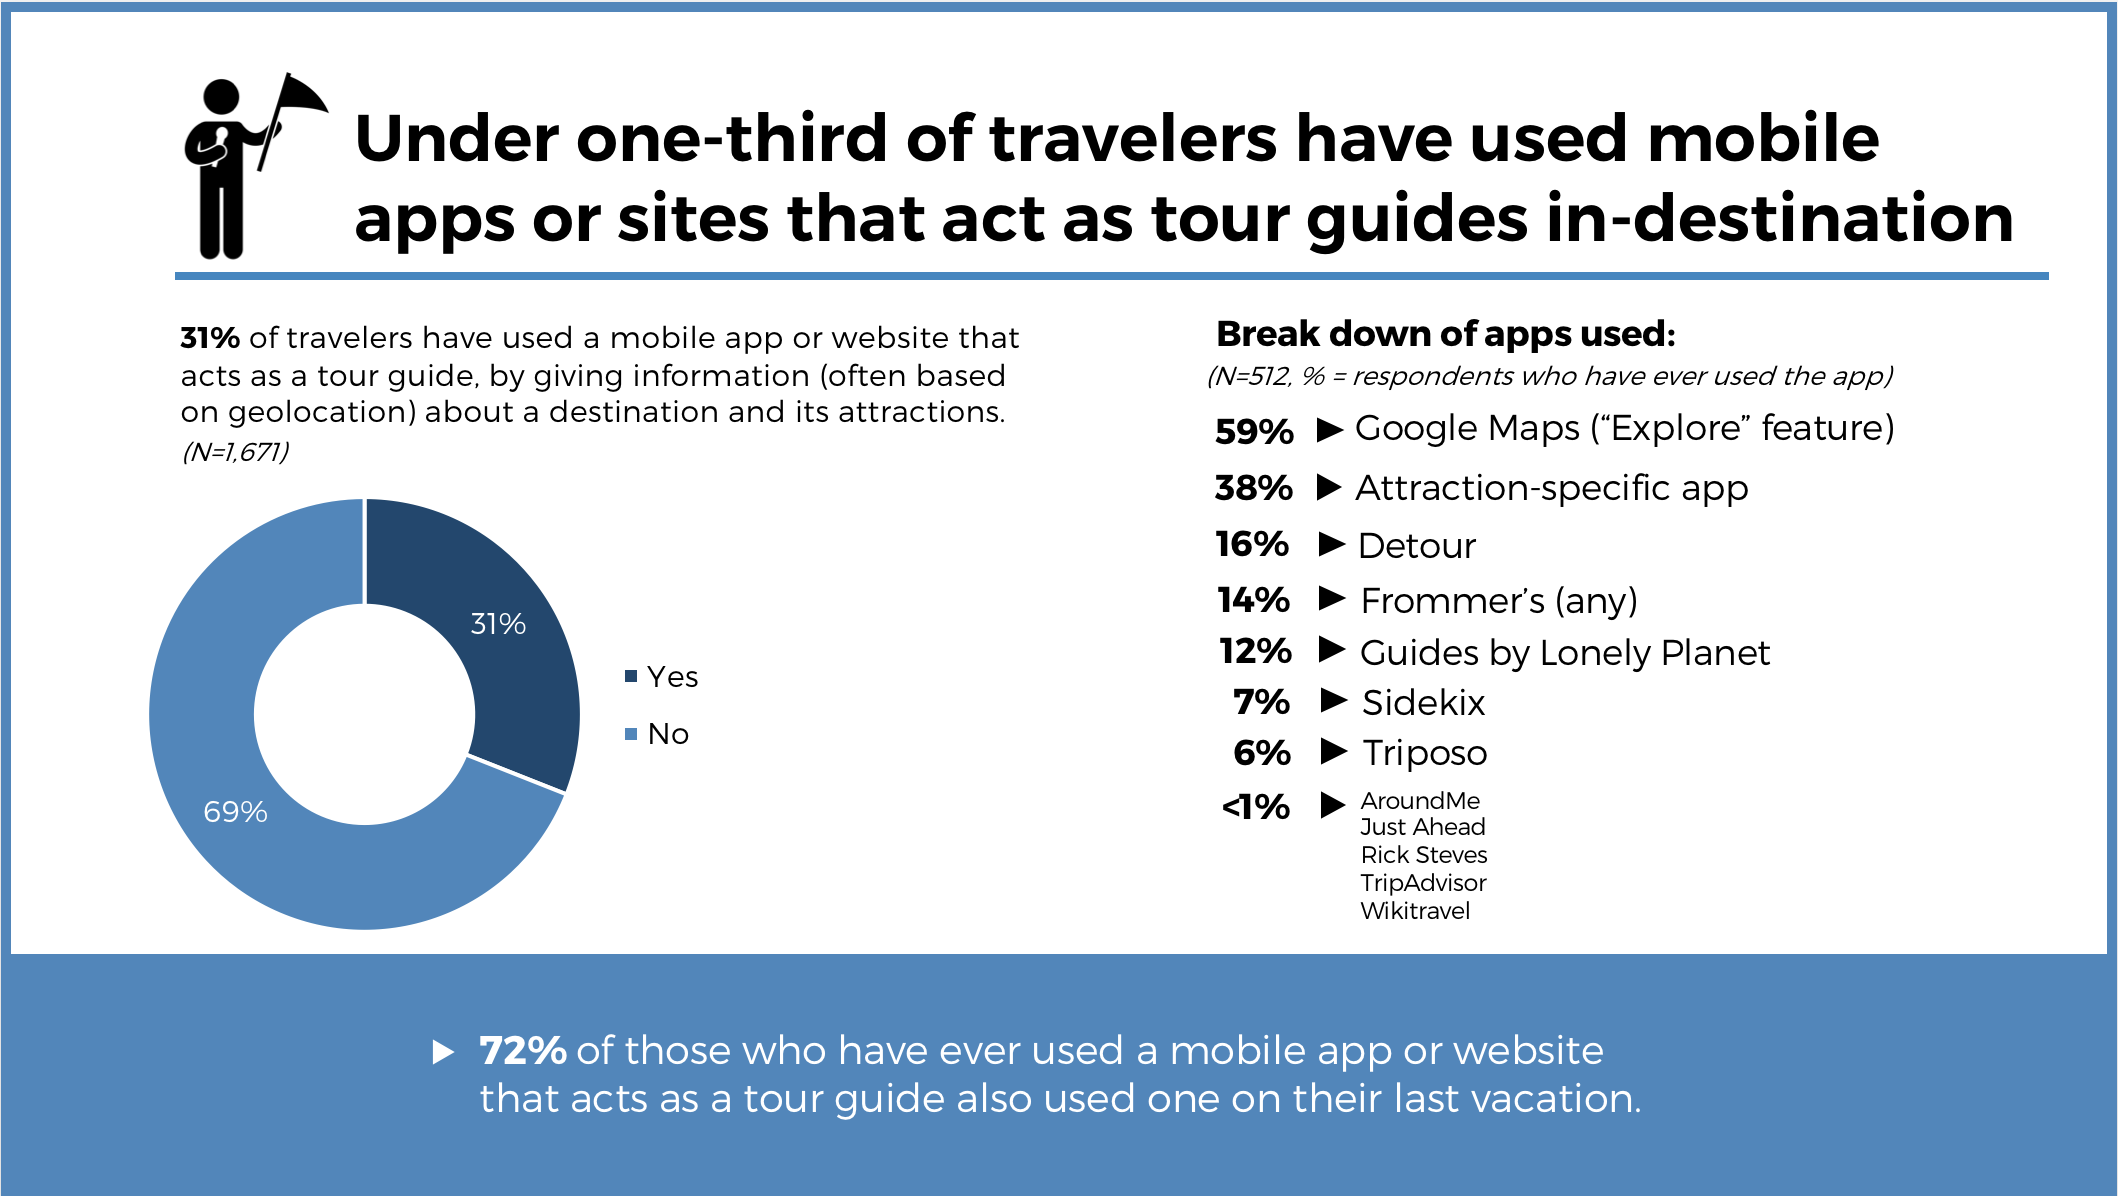
For U.S. travelers, it is unsurprising that Google Maps (specifically its “Explore” feature) is the most commonly used app in this category. The results of this survey show that Google apps lead three out of the 15 parts of the in-destination mobile journey, cementing the tech giant’s important role in travel. In Skift Research’s report A Deep Dive into the Google Travel Ecosystem 2018 , we wrote in more detail about the significance of Google Maps for travelers. In this report, we estimated that Google Maps has over 50% market share for navigation apps in the U.S., and our survey results show that was a conservative estimate. We also discussed how the popularity of Google Maps largely stems from the fact that it is much more to travelers than just a navigation assistant. Google Maps is truly a tour guide, with 700,000 new places of interest being added each month (and over 95% of these are outside the U.S.) using crowdsourced information from a community of over 50 million local guides. Google has taken advantage of these local guides and innovative algorithms to produce new features, like the Explore feature that respondents reported using most often at this part of the journey.
Apps like Google Maps and the others in the “Tour Guide” category play an important role in encouraging independent travel to off-the-beaten-path locations. Looking outside the U.S., China is a market that exhibits the great potential for mobile assistants like this. As independent travel continues to rise in popularity among this market, tech companies in China, (where Google is banned) are creating their own innovative mobile assistants, like tour guides, for Chinese tourists. We discuss this at length in our past Skift Research reports, WeChat Strategies for Global Travel Brands 2018 and Best Practices for Attracting Chinese Outbound Travelers.
Aside from helping newly independent travelers, mobile tour guide-type apps can also be highly useful in mitigating overtourism by encouraging visitation to less commonly visited attractions. A recent example of an initiative like this was created by London’s tourism board, London & Partners. The board created a game app called Play London with Mr. Bean which encourages tourists to visit attractions outside of central London through gamification. By visiting different types of attractions or a certain number of attractions, tourists can advance in the game. The points earned can be redeemed through in-game purchases of vouchers for local retailers, tour operators, and more to further encourage visitation of lesser-known places.
Tours and Activities Booking
In the OTA and Metasearch section of the journey, we found that just 19% of travelers have used these types of mobile apps or websites to book tours and activities. However, we now see that 35% of travelers have booked tours and activities on mobile while in-destination. This indicates that many travelers book tours and activities directly with the tour operator. This falls in line with other findings that direct bookings lead the way in this area. In our own Skift Research report, The State of Tours and Activities 2018 , we estimated that only about 4% of global tours and activities revenues can be attributed to online booking platforms, like Expedia, Viator, and Peek. And in 2017, tours and activities booking software company Trekksoft found that 82% of the bookings it processed took place on the tour provider’s own website or mobile app.
According to our survey, however, the most popular apps used to book tours and activities are those of online booking platforms or marketplaces, with TripAdvisor leading (and claiming even more share with wholly owned Viator), followed by GetYourGuide. Operator/Attraction-specific apps have only been used by 4% of travelers. One explanation of this discrepancy is that tours and activities booking is an area where websites, accessed via mobile or other devices, are the preferred channel.
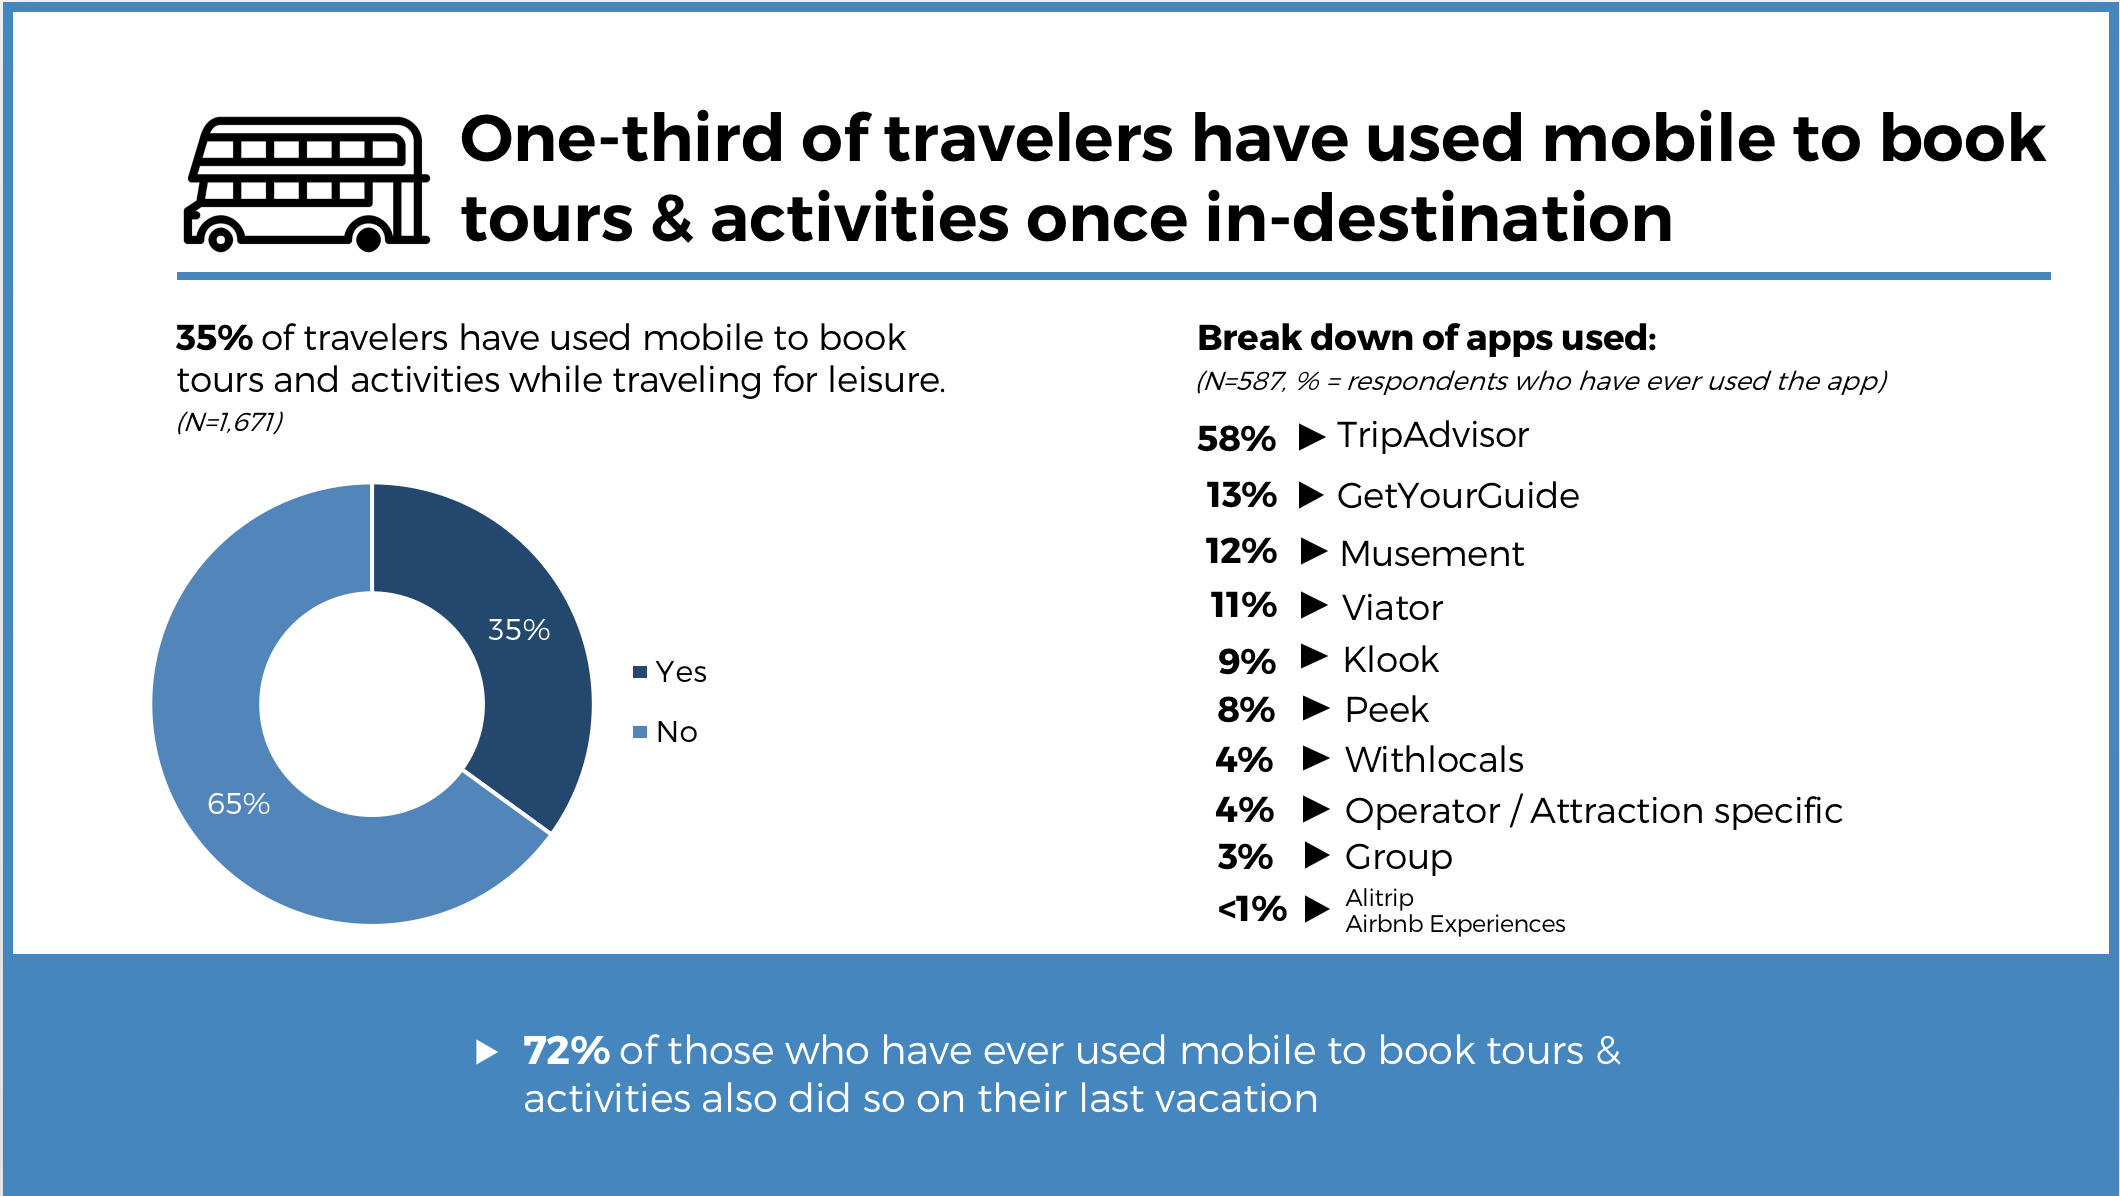
Even if apps aren’t currently the preferred channel to book tour and activities, mobile bookings for this part of the journey are growing in general. Trekksoft found that 49% of direct tours and activities bookings took place on mobile in 2017 compared to just 31% in 2016. As U.S. travelers become even more mobile-centric and their mobile travel spend continues to increase over time, we can expect tours and activities booking will be a key part of this growth.
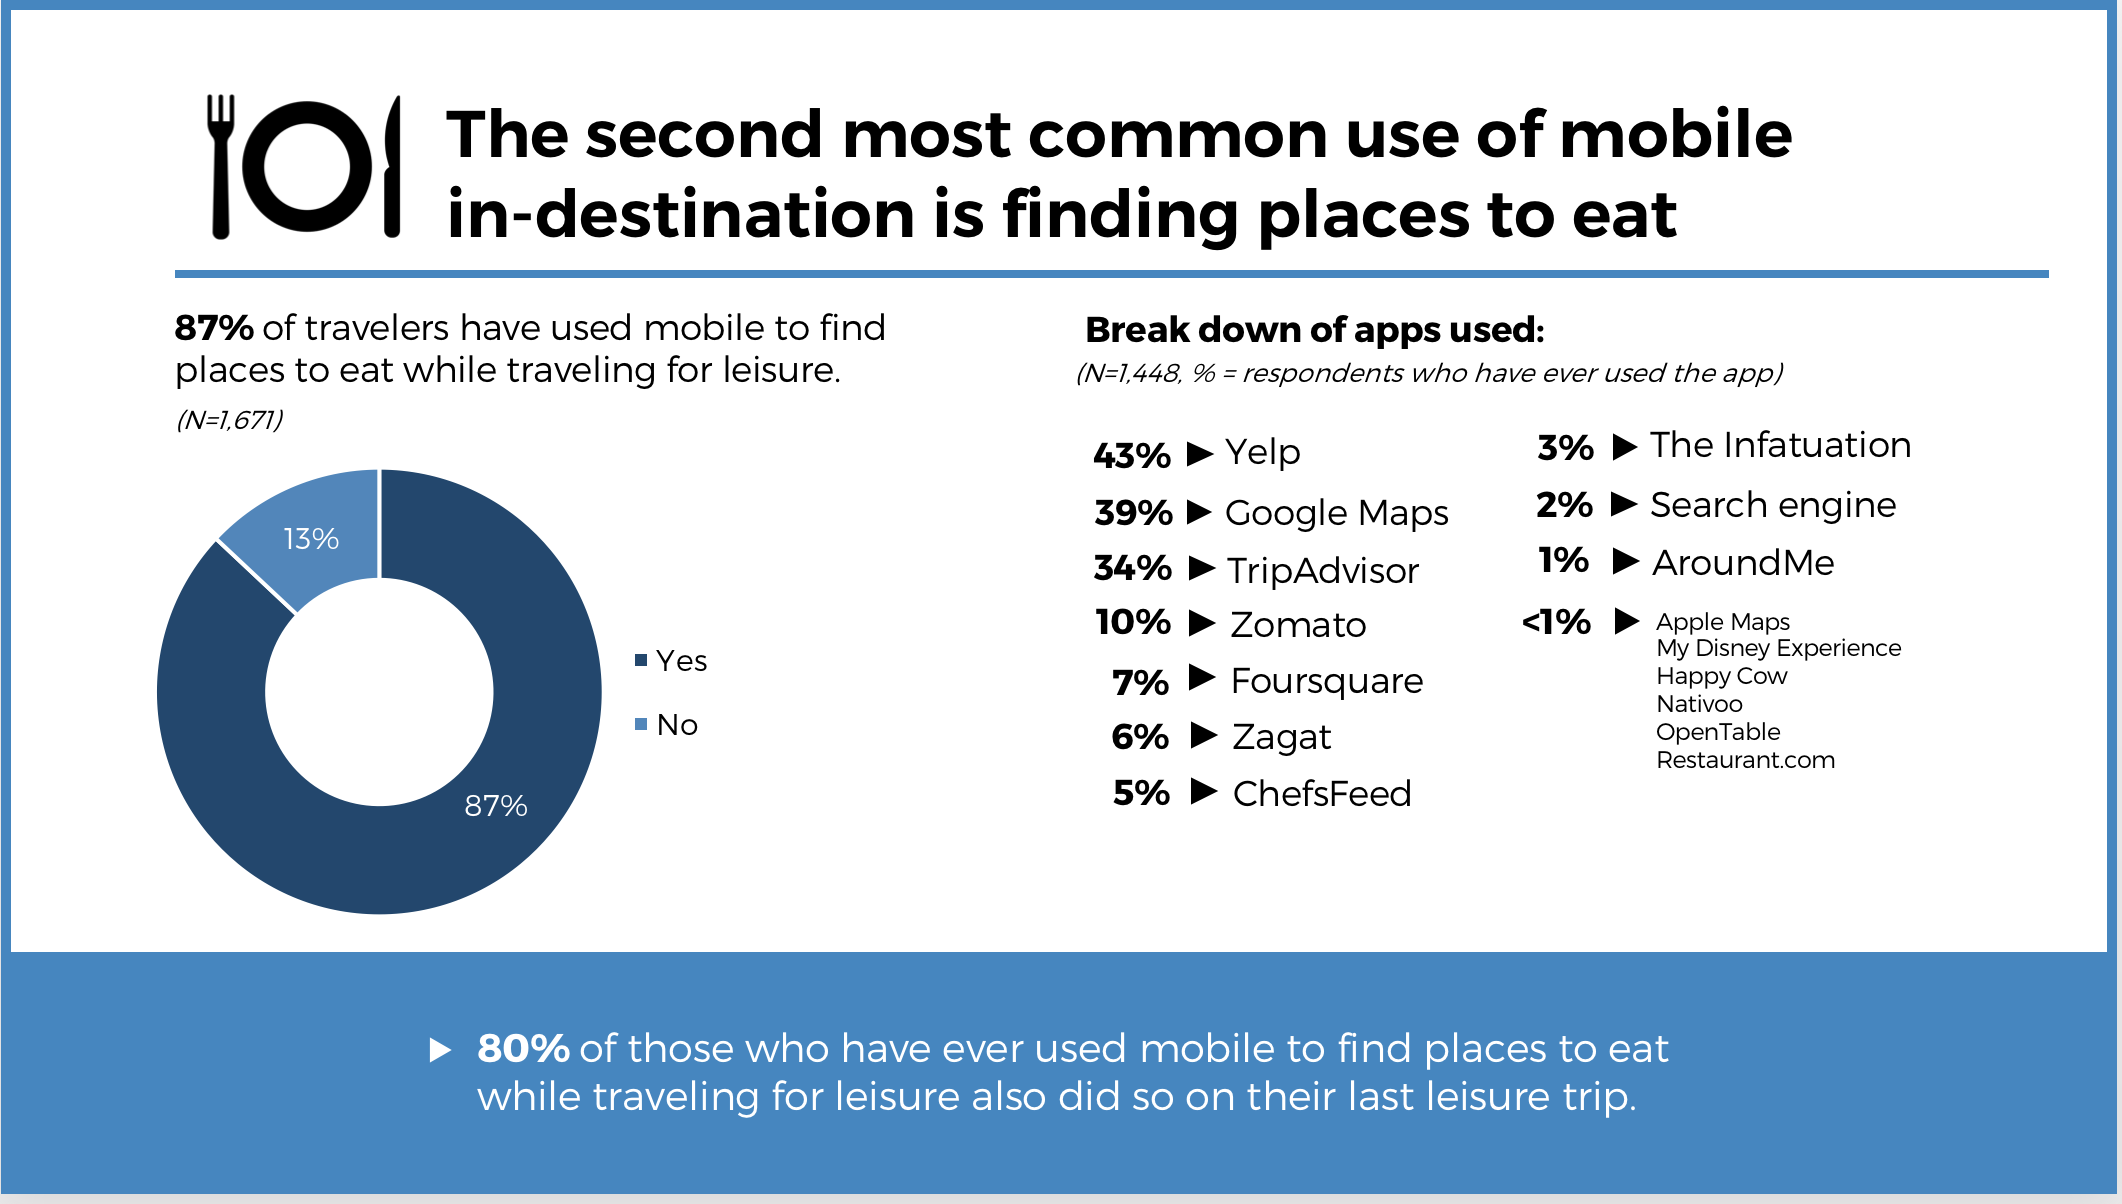
Finding Places to Eat
Finding places to eat while traveling for leisure is a common part of the journey where travelers turn to mobile, trailing only maps and navigation. Nearly 90% of travelers have used mobiles sites or apps for this purpose at some point. Travelers use a variety of apps to find places to eat, with the top three — Yelp, Google Maps, and TripAdvisor — sharing the majority of use.
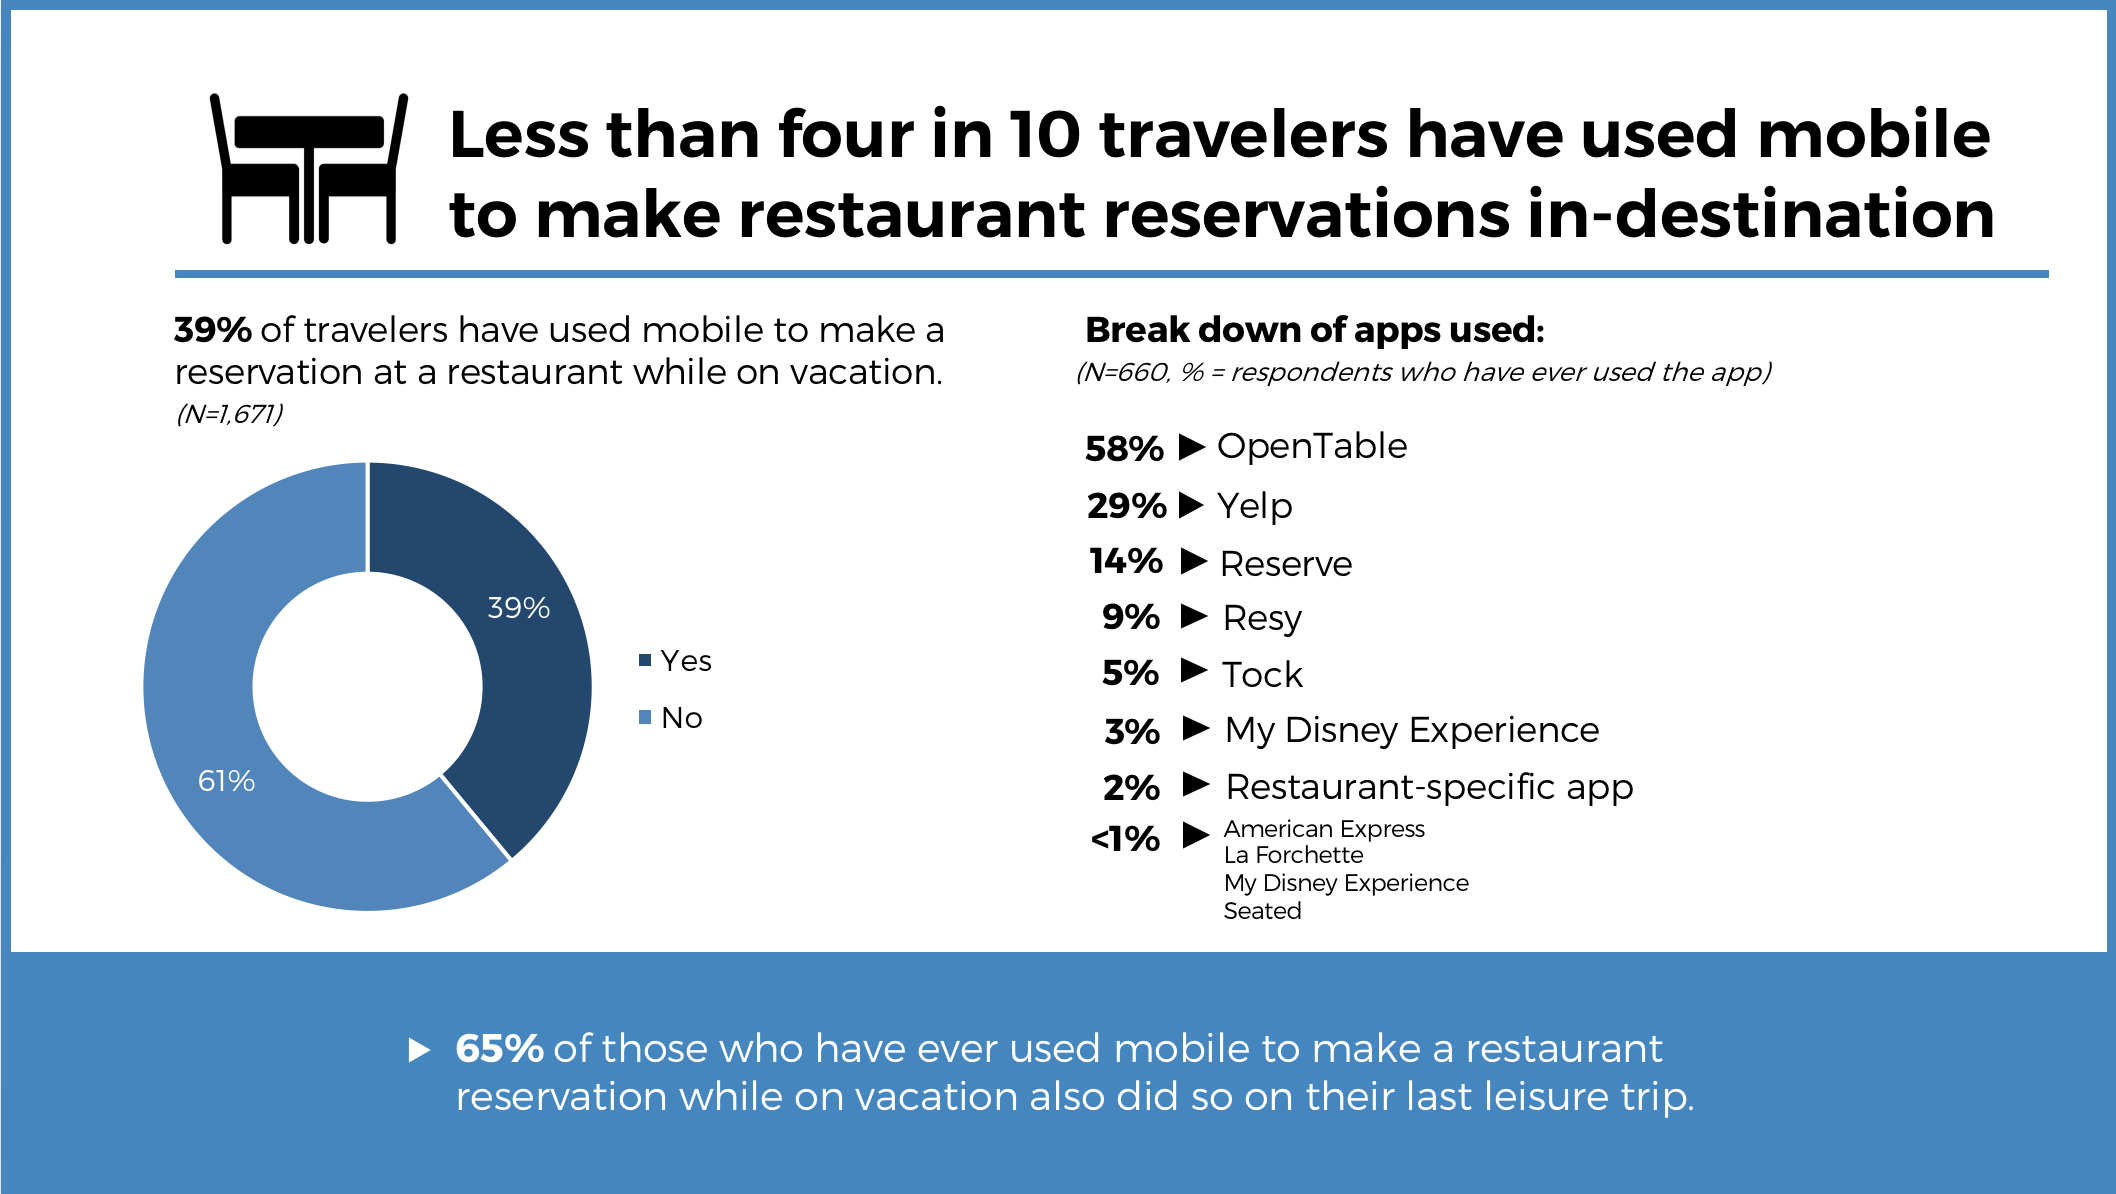
Restaurant Reservations
Even though a large majority of travelers use mobile to find places to eat in-destination, just 39% do the same to make reservations at restaurants while traveling. Of those who have made reservations via mobile on past leisure trips, nearly two-thirds did so during their last leisure trip as well. When it comes to apps used for this purpose, OpenTable dominates, with 58% of travelers who have used mobile at this part of the journey using this app in particular at some point in their past travels.
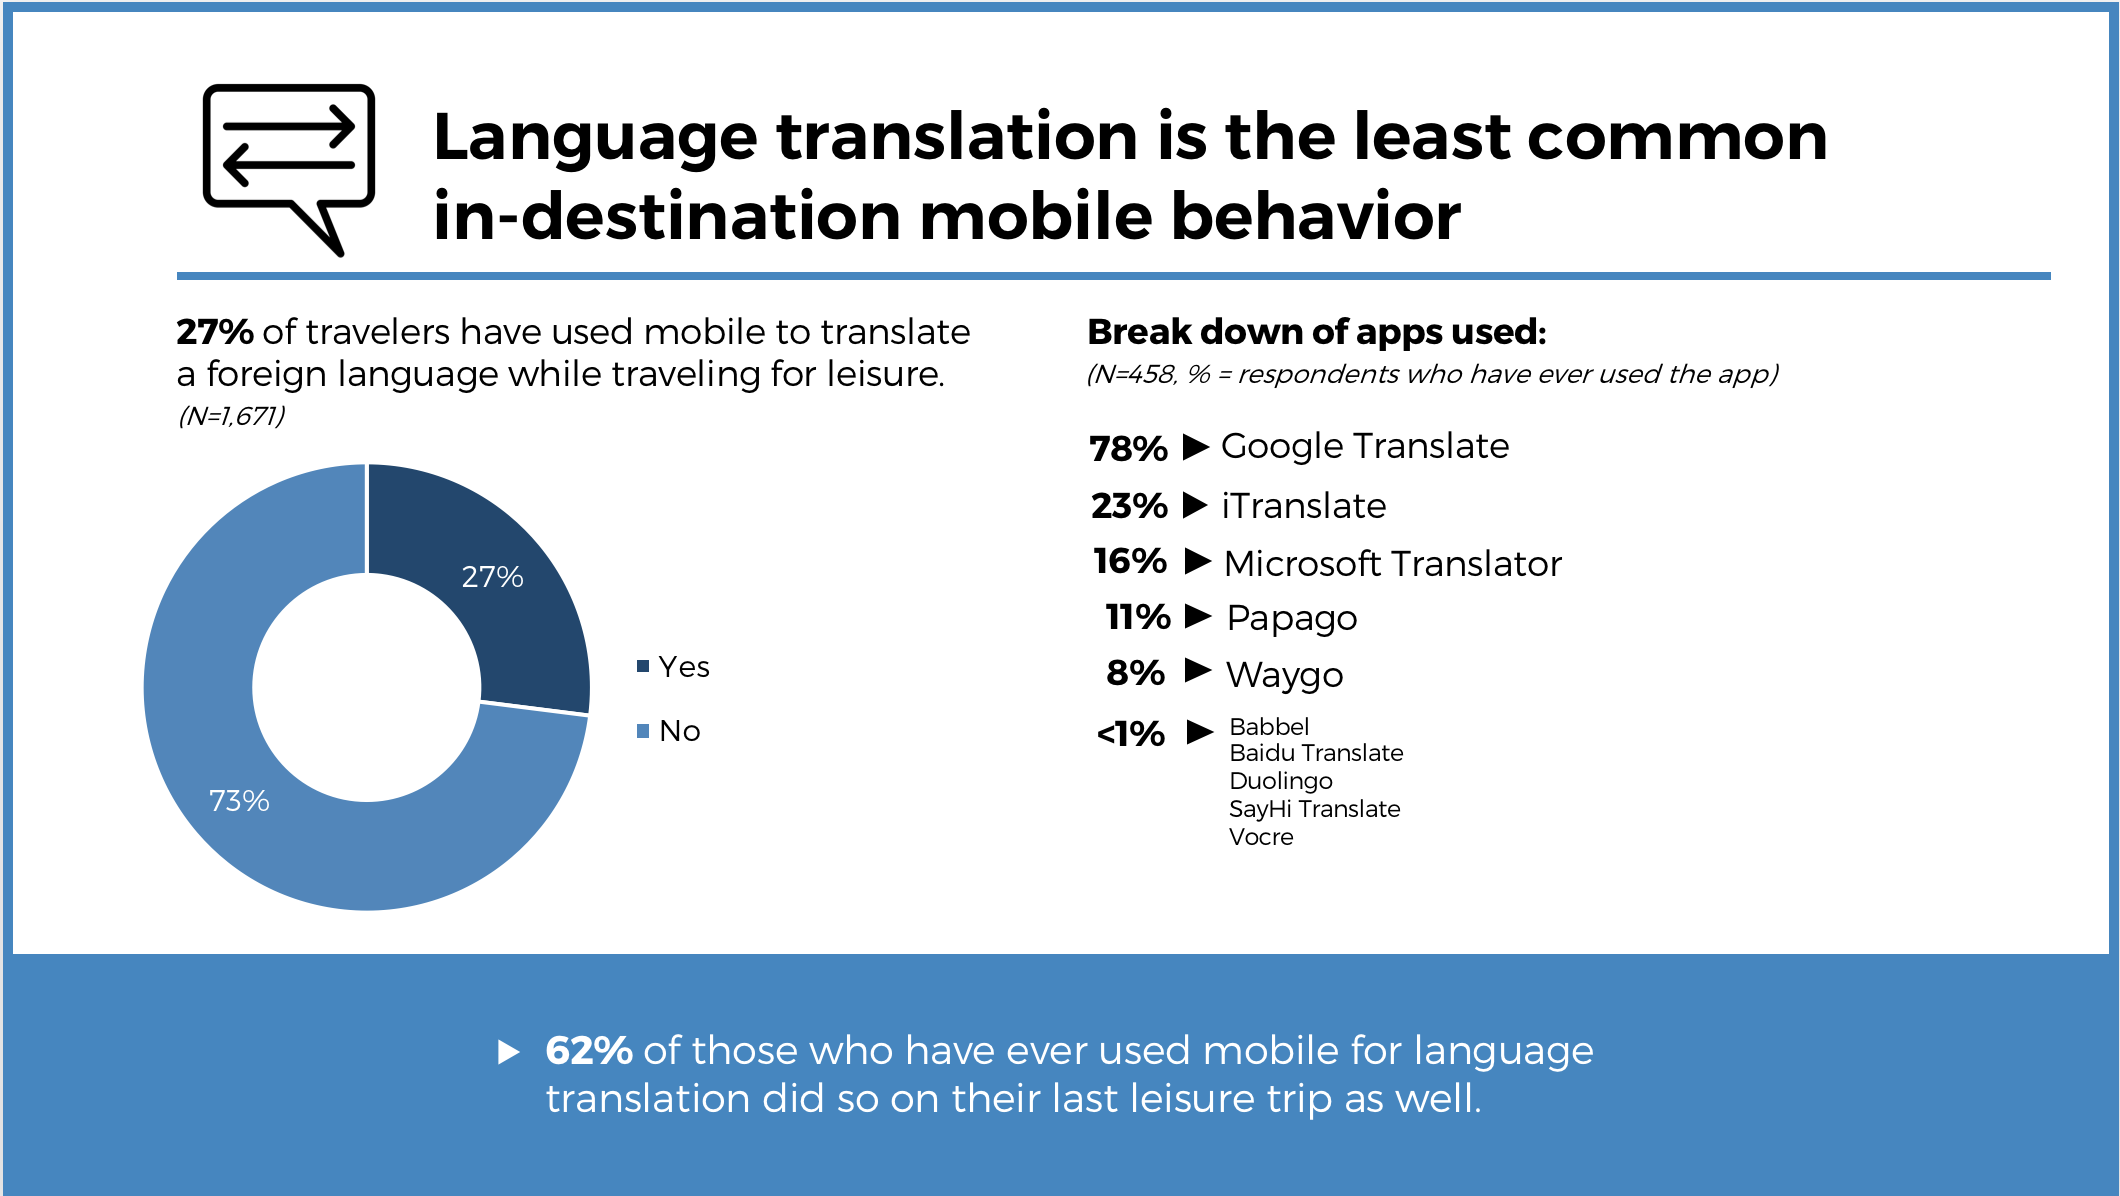
Translation
Of all parts of the in-destination journey, language translation is the least common mobile behavior among U.S. travelers. Just 27% of respondents have used mobile for this purpose. This comparatively low number is not that surprising, given that language translation is not necessary for almost all domestic travel and much international travel as well. We can expect that mobile use for language translation would be higher if our scope were limited only to U.S. travelers traveling abroad. Even so, 62% of those who have used mobile for this reason did so on their last trip as well. This is another part of the in-destination journey where Google leads in app use, with Google Translate having been used by 78% of travelers who have used mobile for translation in the past.
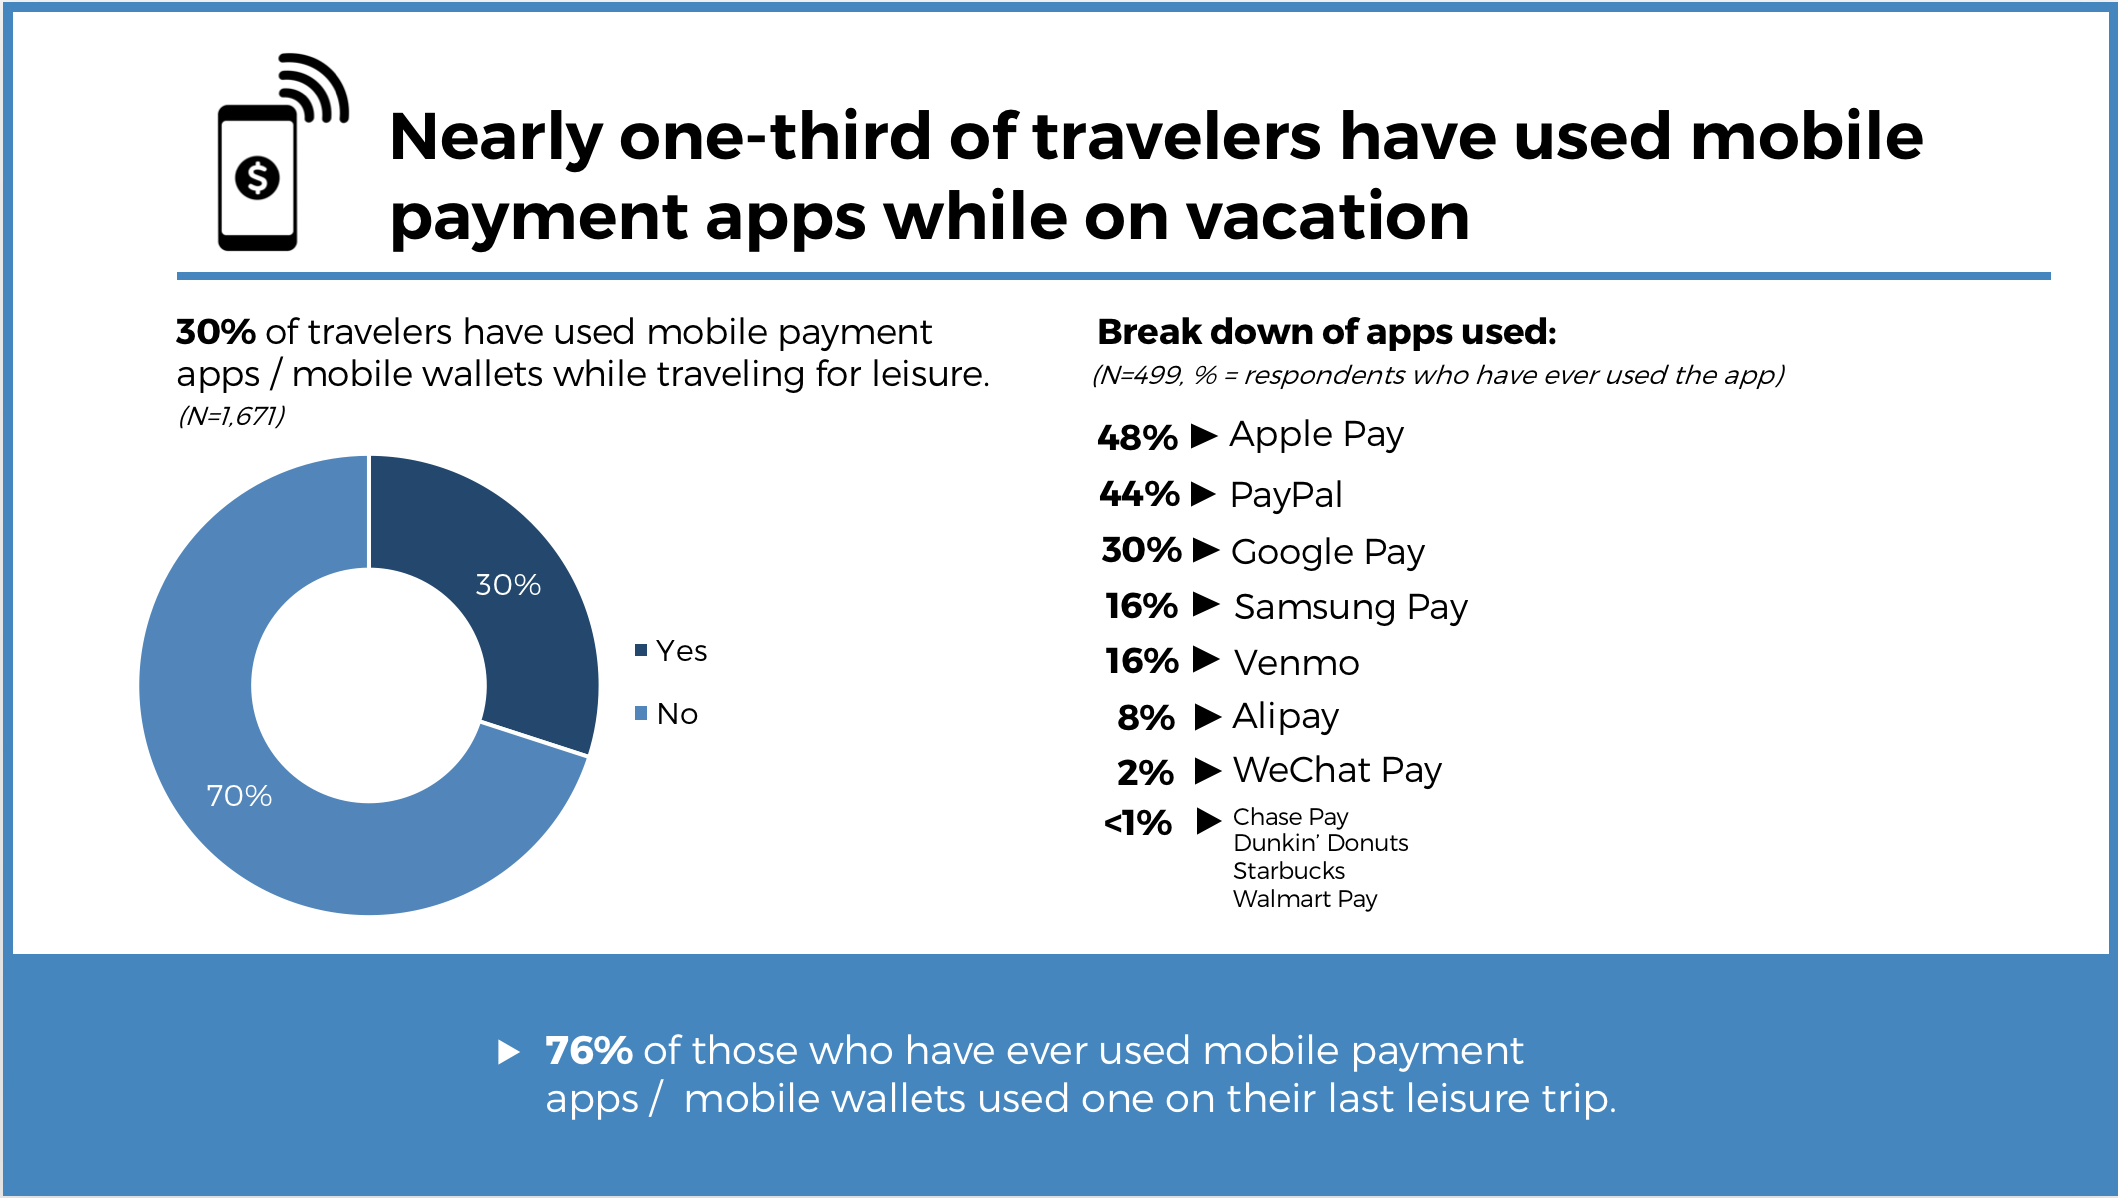
Payment and Wallets
Payment and wallets make up the second-least common part of the in-destination mobile journey for U.S. travelers, with 30% having used mobile payment apps or wallets in the past. Among those who have used mobile for this reason, Apple Pay is the most commonly used app, followed by PayPal, then Google Pay. Given the relative unpopularity of mobile payments in the U.S. compared to other countries like China, it is not surprising that U.S. travelers are not frequently using this technology in vacation destinations. As we discussed in our report Best Practices for Attracting Chinese Outbound Tourists , mobile payments in China totaled $5.5 trillion in 2016 according to iResearch, while the total in the U.S. was just $112 billion according to a Forrester Research estimate. Interestingly, a small amount of our U.S. survey respondents have used China’s most popular mobile wallets, Alipay and WeChat Pay, while traveling. As Chinese travelers drive the demand for this technology, the expansion of its availability at vacation destinations around the world is likely to effect mobile payment usage by other global markets. We expect the Chinese market will influence this area more in the future, and mobile payments will become more common among U.S. travelers over time.
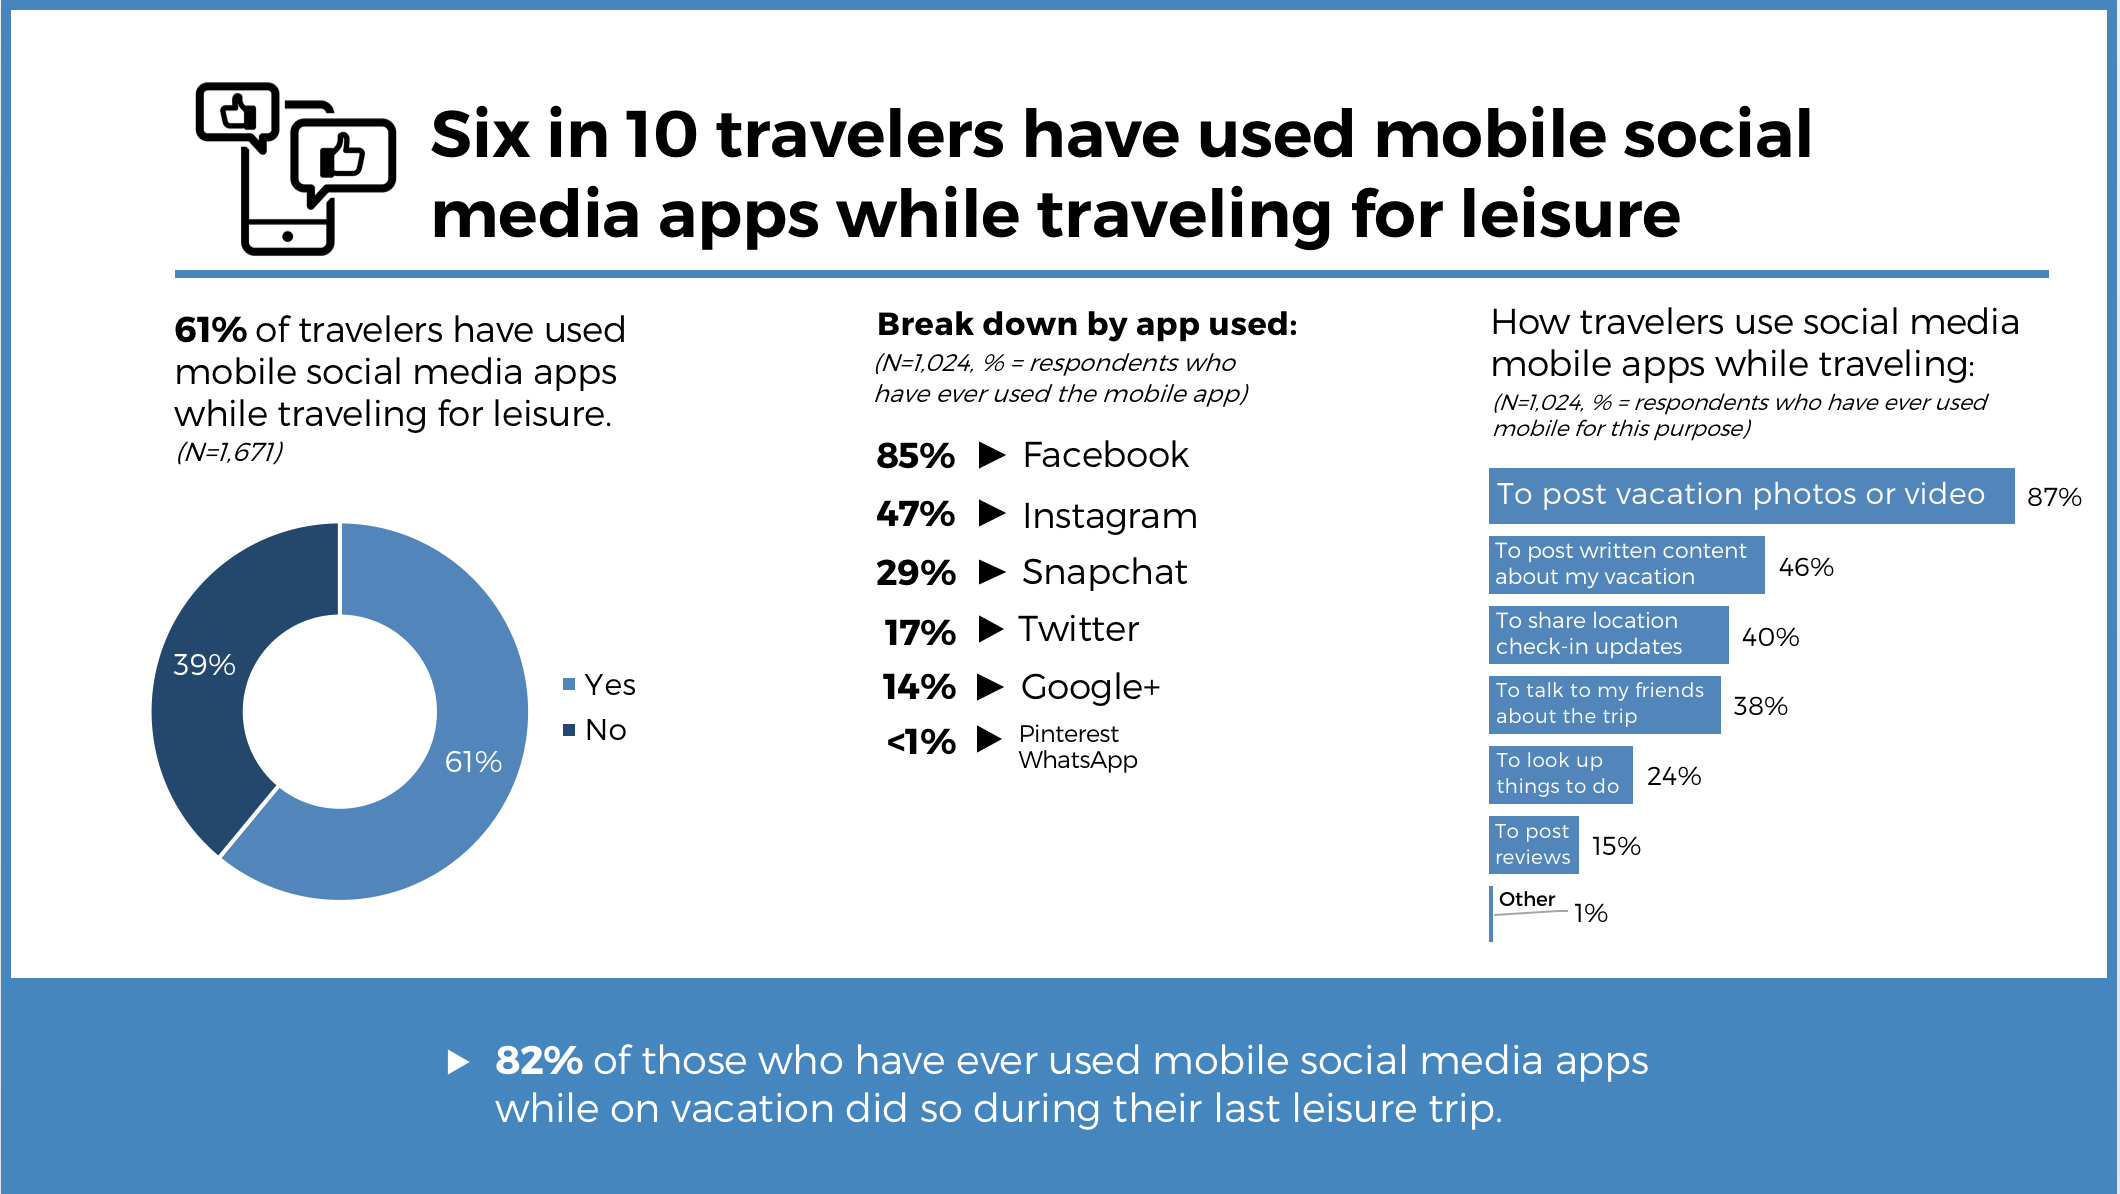
Social Media
The final part of our in-destination mobile journey is social media. Six out of 10 travelers use social media on mobile for reasons related to their trip while traveling for leisure. The large majority of those who have, have done so during their last leisure trip as well. Facebook is clearly the social media app that is most widely used in-destination, with 85% of travelers using it while on vacation. Instagram follows with 49%. Travelers use mobile social media apps for a variety of purposes, but the clear favorite is to post vacation photos or videos, with 87% of travelers who use mobile social media apps using them for this reason. This is a strong indication that social media is still a vital channel for travel brands to engage travelers and encourage them to spread the word about their products and services, even when they are in-destination.
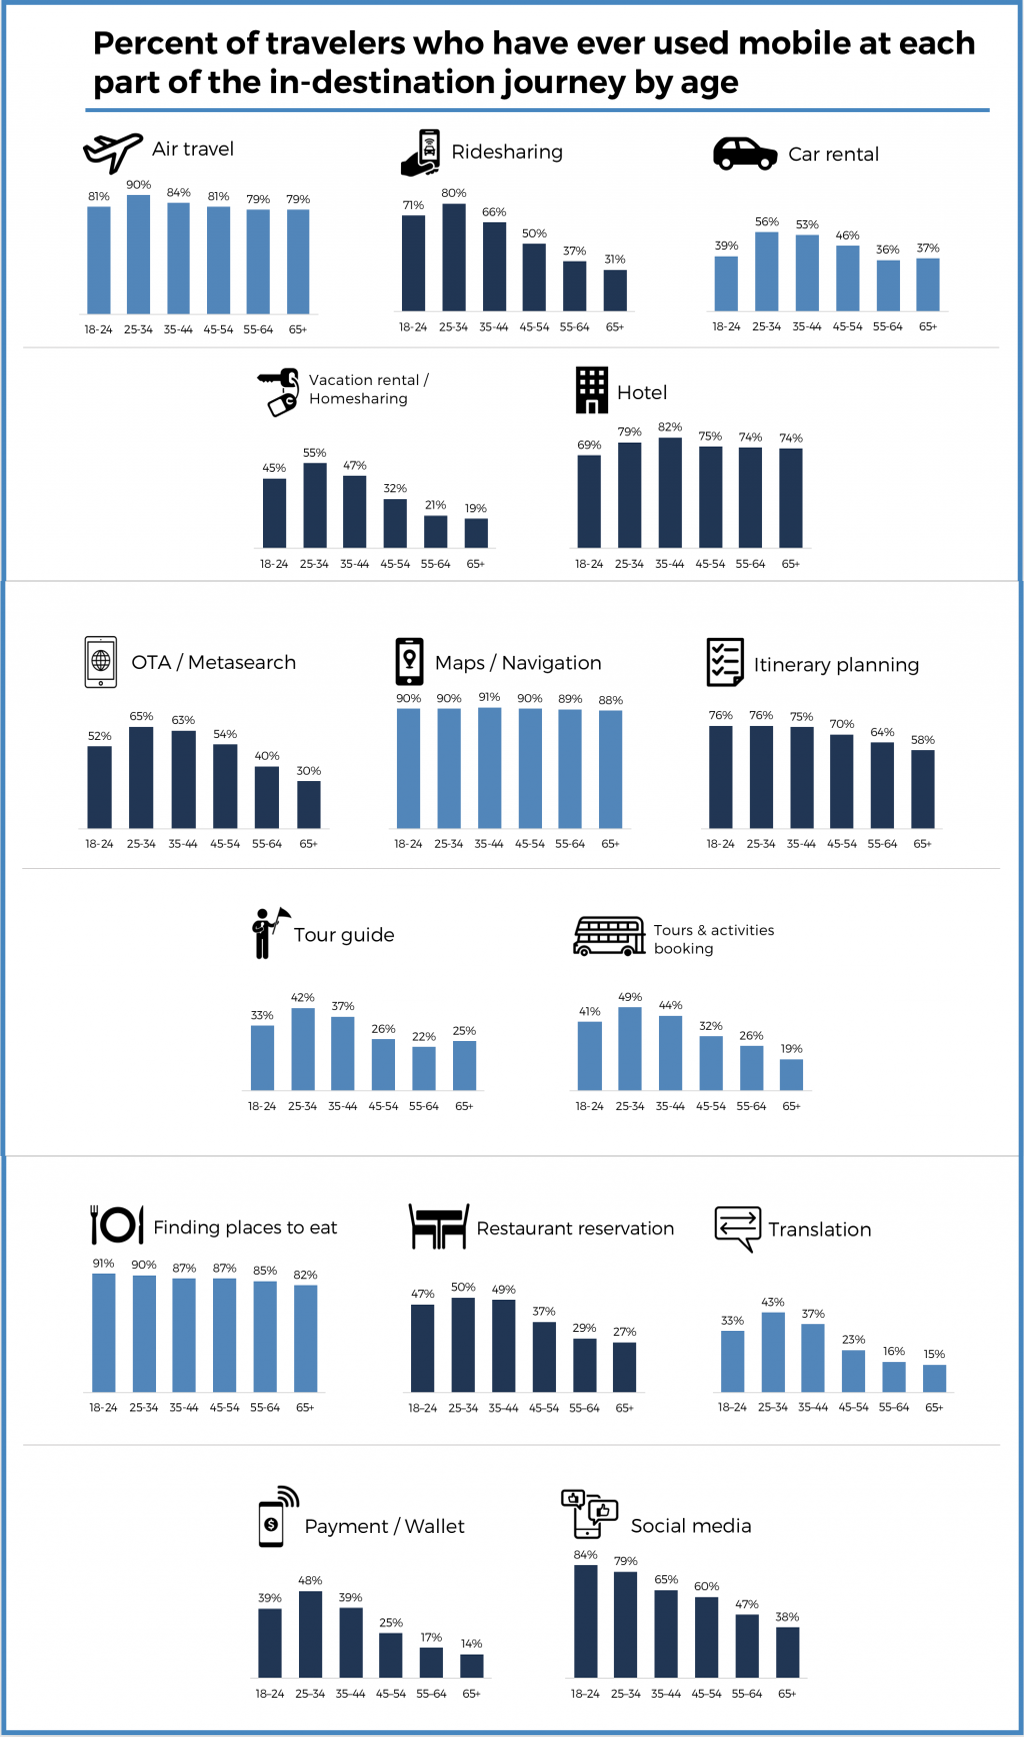
Examining the In-Destination Mobile Journey by Traveler Age Group
As with all types of technology use, age can be a major determining factor for in-destination mobile use. When dividing our survey respondents into five age groups, some clear trends emerged. In general, in-destination mobile use is highest among 25-44 year olds and declines as respondents get older. This is most clearly illustrated by the ridesharing and vacation rental / homesharing categories. The areas where mobile use is most common (such as air travel, hotels, maps and navigation, and finding places to eat), however, are fairly even across age groups. Social media is also a category that stands out, with use among 18–24 year olds being 5% higher than 25–34 year olds and 46% higher than among the 65+ group.
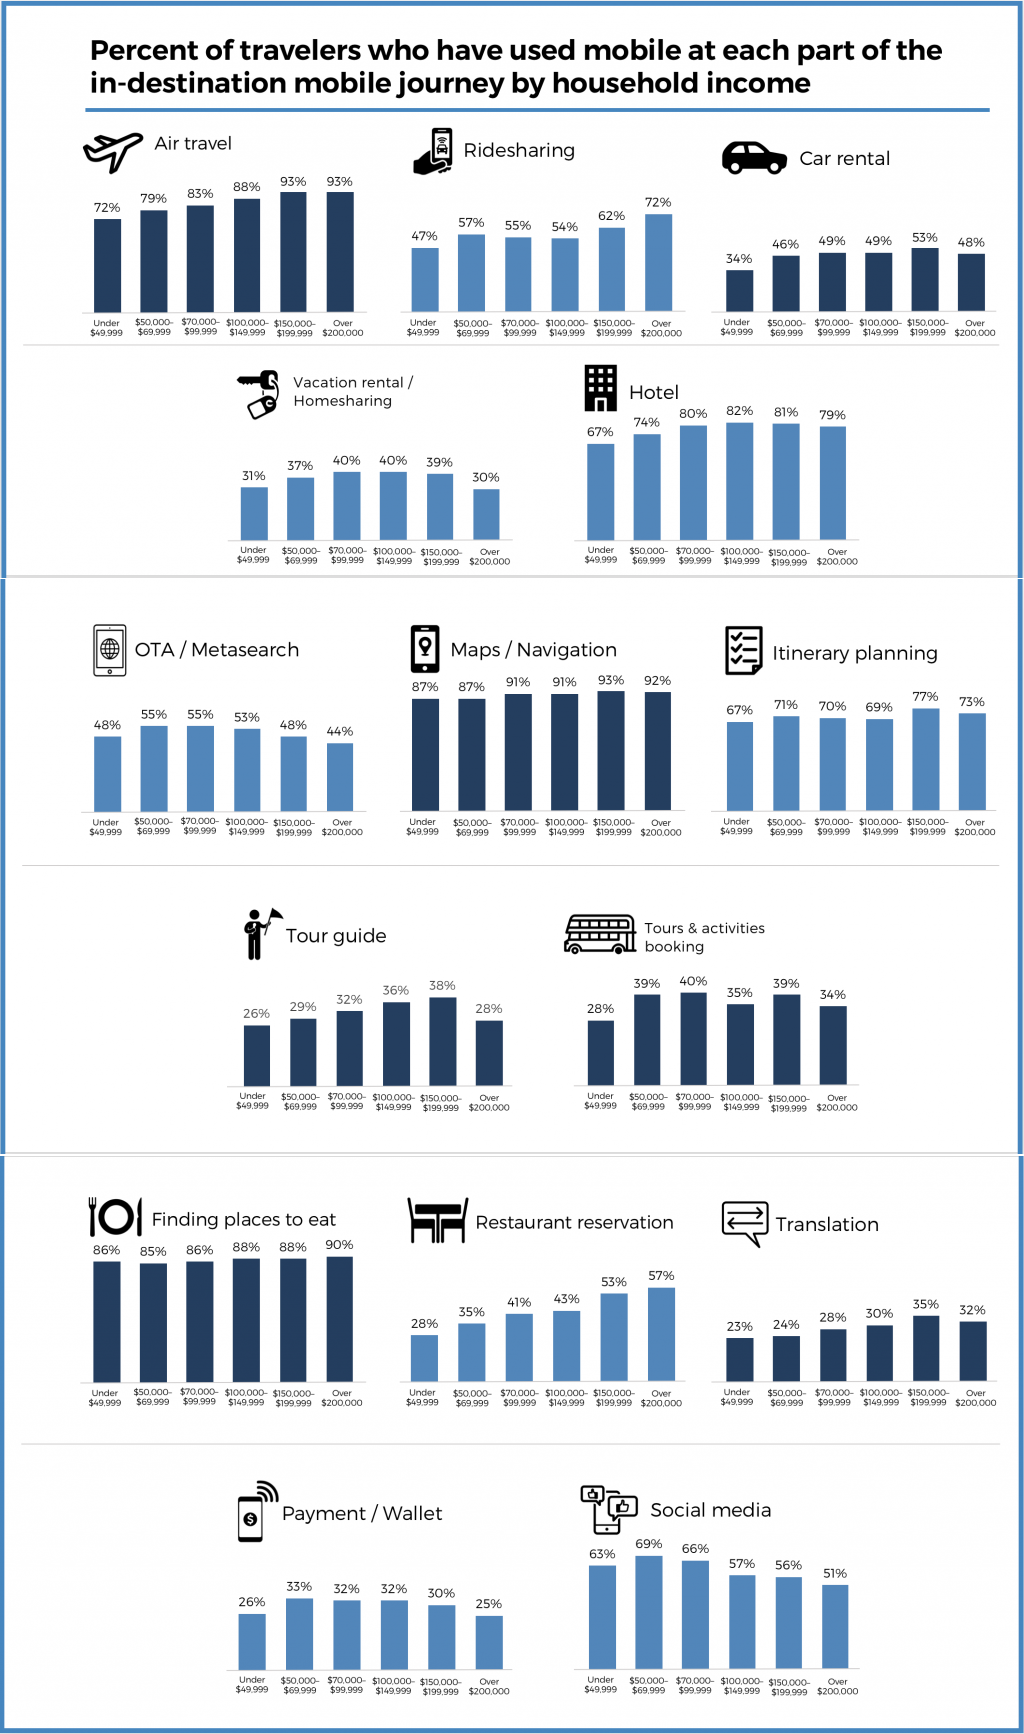
Examining the In-Destination Mobile Journey by Traveler Income
Travelers’ annual household income proves not to be as strong of an indicator of in-destination mobile behavior as age, but still uncovers some notable trends. For example, the group with household incomes of under $49,999 have the lowest or second-lowest mobile use across the journey. In our recent Skift Research report U.S. Affluent Traveler Trends 2018: Annual Survey on Travel Behavior , we found that among those with annual household incomes of over $100,000, travel frequency correlates with income. Similarly, travelers with family income of under $49,999 are likely to travel less frequently than their more affluent peers. As we discussed in the second section of this report, one of the key reasons mobile is used while traveling is because of the convenience it offers. For individuals who travel less often, convenience is not likely to be as top-of-mind compared to those who travel more frequently.
Mobile Is Central to the In-Destination Journey, But it Shouldn’t Exist on Its Own
From examining each part of the in-destination journey, it is clear that mobile plays a major role for many U.S. travelers. At almost all parts of the in-destination journey, more than half of travelers engage with mobile. And while almost all travelers use mobile for air travel, maps and navigation, and finding places to eat, much fewer use mobile apps or websites that act as tour guides, translators, or mobile wallets. U.S. travelers are becoming more comfortable with the idea of making mobile travel transactions and booking many aspects of their trips when they are in-destination, rather than before they leave home.
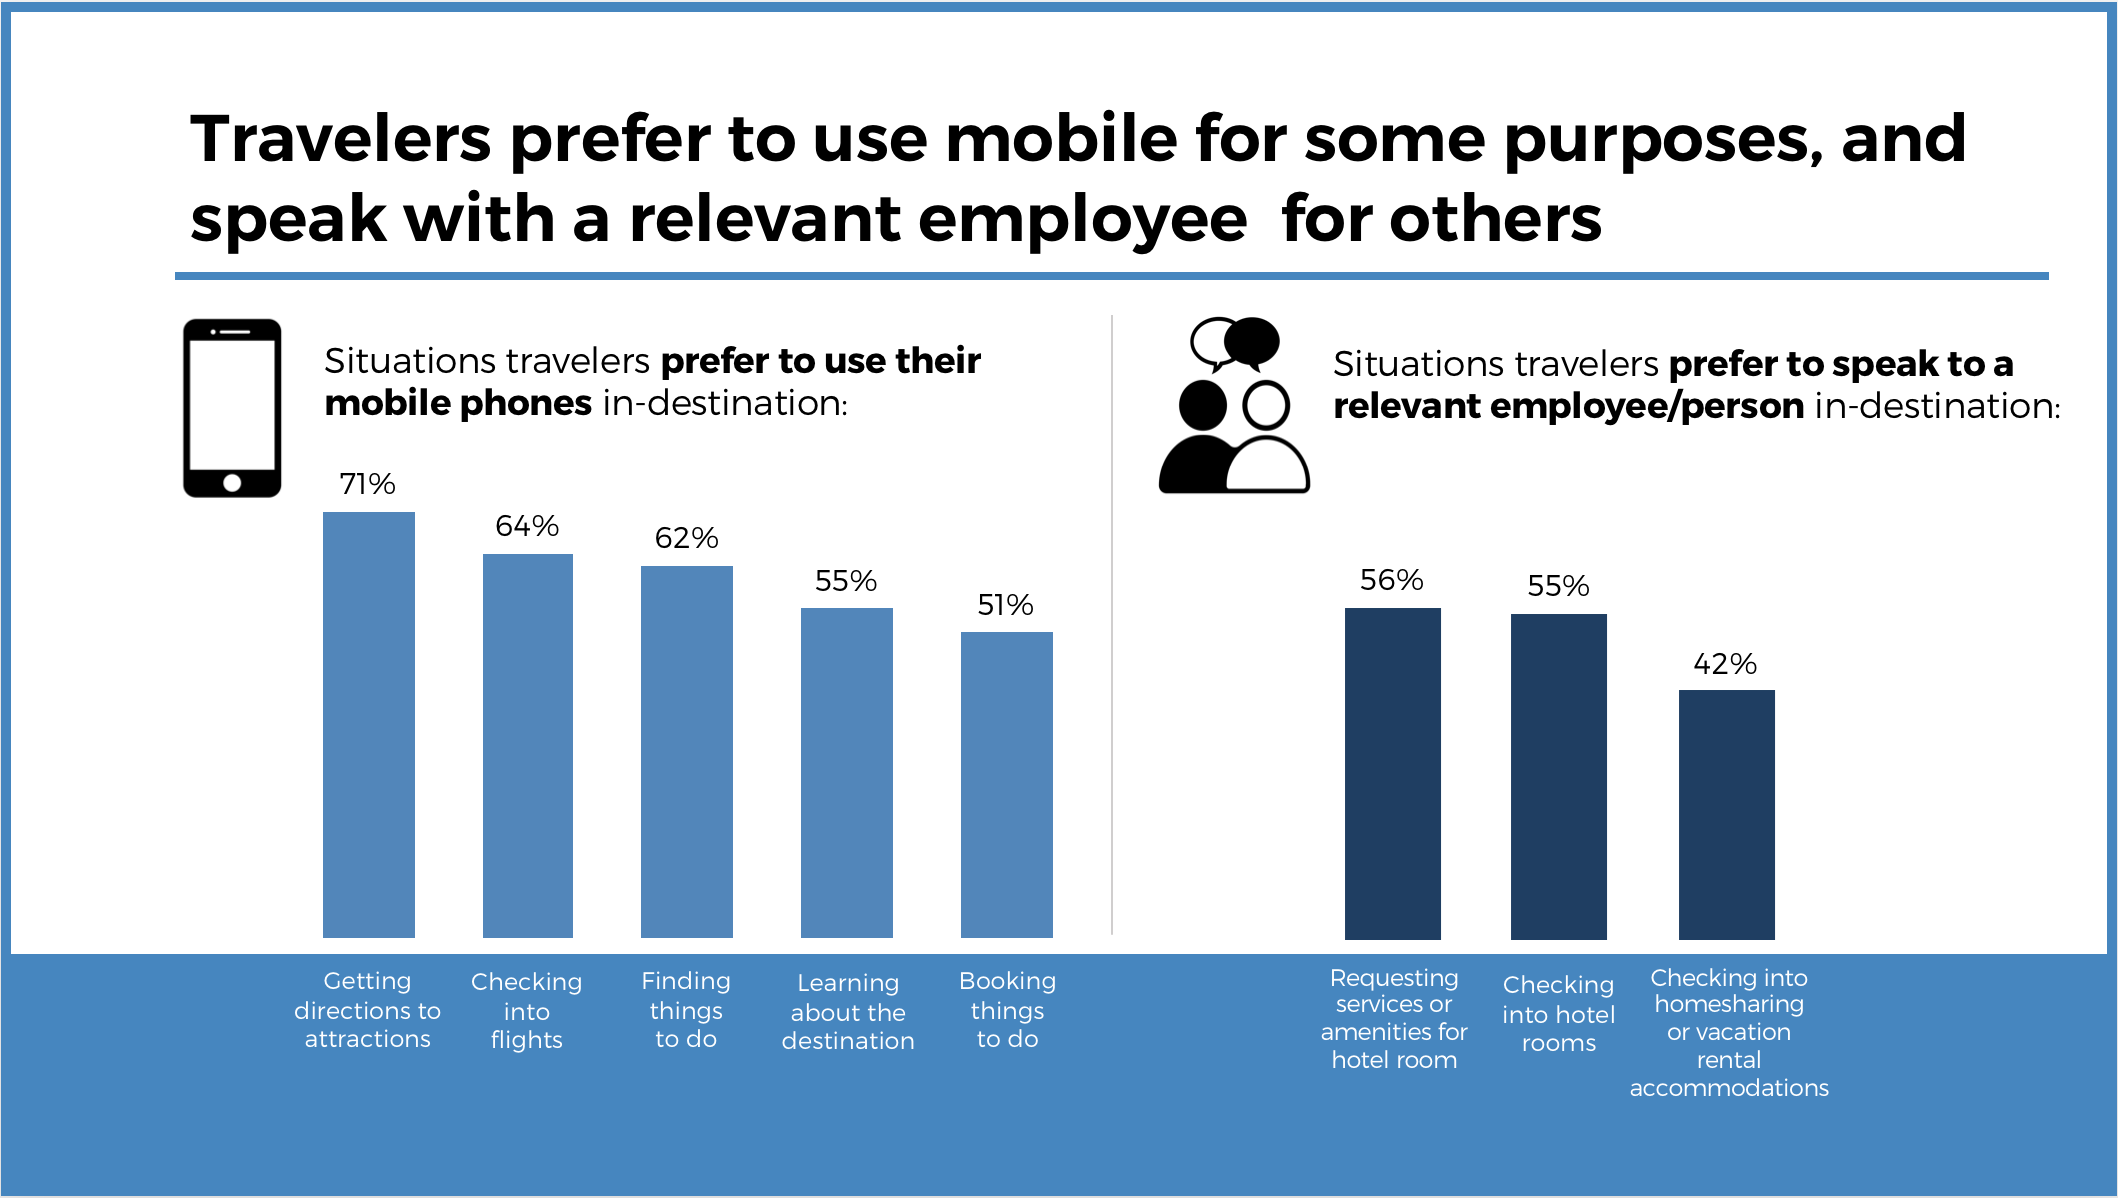
That some parts of the in-destination journey have low mobile use currently means that there is room for future growth and a more mobile-centric travel experience. However, this doesn’t mean that travelers want to rely on mobile for every aspect of their travels. We asked respondents whether they would prefer to use mobile or speak with relevant employees for certain purposes. We found that while travelers have more tasks for which they would prefer to turn to mobile to accomplish, for three of the eight tasks, speaking to a relevant employee is still preferred. Even for the five tasks where mobile is preferred, around 30–50% of travelers either prefer to speak to a relevant employee or have no preference.
It’s important to keep in mind that travelers have a variety of comfort levels with mobile, and even those who are extremely comfortable sometimes just want to talk to a real person. Ultimately, mobile apps or websites need to complement the services that employees provide and make that in-person service even better. Travel brands that can find that balance will more seamlessly fit in the in-destination journey and more easily convey the value they provide by being a part of it.
Icon Credits:
- Air travel: bmijnlieff from Noun Project
- Ridesharing: Adrien Coquet from Noun Project
- Car rental: Adrien Coquet from Noun Project
- Vacation rental / homesharing: Delwar Hossain from Noun Project
- Hotel: Nociconist from Noun Project
- OTA / Metasearch: Made from Noun Project
- Maps / Navigation: Brand Mania from Noun Project
- Itinerary planning: unlimicon from Noun Project
- Tour guide: Gan Khoon Lay from Noun Project
- Tours and activities booking: Creaticca Creative Agency from Noun Project
- Finding places to eat: Laymik from Noun Project
- Restaurant reservation: Ahock from Noun Project
- Translation: luca fruzza from Noun Project
- Payment / Wallet: Bence Bezered from Noun Project
- Social media: Symbolon from Noun Project
- Mobile phone: Alena from Noun Project
- Conversation: FBianchi from Noun Project
Endnotes and Further Reading
- comScore, U.S. State of Travel, 2017.
- eMarketer, “Mobile Drives Growth of Online Travel Bookings,” June 21, 2017.
- EyeforTravel, Driving Intelligent, Interconnected Mobile Engagement Throughout the Travel Journey, April 2018.
- Skift, “AccorHotels Is Working on a Smart Room That’s Accessible and Personalized,” November 22, 2017.
- Skift, “Amazon Wades Into Travel as Hotels Turn to Alexa in Rooms,” June 19, 2018.
- Skift, “Hilton Will Let You Control TV, Lights, Temp in Your Room From Smartphone,” April 25, 2018.
- Skift, “London Uses Mobile Gaming App to Help Tackle Overtourism,” June 27, 2018.
- Skift, “Smart Hotel Guest Rooms Are Almost Here,” February 13, 2018.
- Skift, “Starwood Preferred Guest Offers Extra Points for Mobile Check-Ins,” May 4, 2018.
- Think with Google, “How people use their phones for travel,” October 2016.
- Think with Google, “3 ways travel marketers can fine-tune their measurement strategy,” August 2017.
- Trekksoft, “Travel booking trends: what’s changing for 2018?” November 20, 2017.
- World Economic Forum, Digital Transformation Initiative: Aviation, Travel and Tourism Industry, January 2017.
US Travel Header Utility Menu
- Future of Travel Mobility
- Travel Action Network
- Commission on Seamless & Secure Travel
- Travel Works
- Journey to Clean
Header Utility Social Links
- Follow us on FOLLOW US
- Follow us on Twitter
- Follow us on LinkedIn
- Follow us on Instagram
- Follow us on Facebook
User account menu
The latest travel data.
MONTHLY INSIGHTS March 04, 2024

U.S. Travel has temporarily paused our monthly data newsletter, however, the latest travel data is still available via the U.S. Travel Insights Dashboard . This dashboard is updated each month (member login required).
The U.S. Travel Insights Dashboard , developed in collaboration with Tourism Economics, is supported by more than 20 data sources. The dashboard is the most comprehensive and centralized source for high-frequency intelligence on the U.S. travel industry, tracking industry performance, travel volumes and predictive indicators of recovery including air and lodging forecasts, DMO website traffic, convention and group trends, travel spending and losses, traveler sentiment, among others to measure the health of the industry.
Key Highlights January 2024:
- Travel appetite started the year on a softer note, but overall growth continued. Air passenger growth remained positive, up 6% versus the prior year but lower than the double-digit growth seen through 2023. Foreign visits remained strong, up 24% YoY.
- Hotel room demand continued a trend of slight contraction falling 1% versus the prior year, while short-term rental demand grew 1%, a lower rate than 2023.
- A particular bright spot was that group room demand within the top 25 markets displayed solid growth of 9% relative to the prior year.
- The outlook for the economy remains fairly optimistic due to the strength of the labor market, looser financial conditions and healthy household and nonfinancial corporate balance sheets. This has filtered through to slightly higher consumer sentiment in February.
- Sentiment is also growing for upcoming leisure travel in 2024. The share of travelers reporting having travel plans within the next six months increased to 93% in January from 92% in December, according to Longwoods International’s monthly survey.
- Travel price inflation (TPI) fell slightly in January as a result of falling transportation prices. Sticky services inflation should see relief from decelerating wage growth. However, upside risks stem from rising healthcare costs, supply chain disruptions and slowing labor supply. Source: U.S. Travel Association and Tourism Economics
Member Price:
Non-Member Price: Become a member to access.
ADDITIONAL RESEARCH
Travel Price Index
Travel Forecast
Quarterly Consumer Insights
Additional monthly insights are available through the full U.S. Travel Monthly Data Report, exclusive to members. Please inquire with membership if you are interested in learning about becoming a member of U.S. Travel Association.
How the world moved in 2020
&w=256&q=90)
As we mark a decade since the TomTom Traffic Index was first launched, we go behind the scenes to reveal how our traffic report gets made and why the 2020 edition is unlike anything we’ve done before.
2020 was a year like no other, changing the way we lived, worked and moved. These profound changes are reflected in this year’s edition of the TomTom Traffic Index. City centers became ghost towns after countries worldwide locked down. Peak hour traffic dwindled as we swapped the daily commute for working from home. Congestion spiked when people left cities en masse to escape new lockdown measures.
Ahead of the release of the TomTom Traffic Index for 2020, we sat down with the team behind this anticipated report. They gave us an exclusive look at what it takes to create the Traffic Index, what made this year unique and what we can expect as we move into 2021.
Q: When did TomTom launch the Traffic Index, and how has it changed over the years?
A: We published the first TomTom Traffic Index in 2011, looking at road congestion levels throughout 2010. The report is now in its tenth year, and with every iteration we keep expanding, looking at more cities, more countries and more data. The first Traffic Index covered 57 cities; in 2020, we analyzed traffic information for 416 cities across 57 countries.
We started out by publishing reports for North America and Europe. We added a report for Asia a few years later and, ultimately, we merged everything into a single global report. In the early days, we also had two separate websites: the TomTom Traffic Index, with historical traffic data, and TomTom City, which showed live traffic data for selected cities. We eventually combined them into the single Traffic Index portal that we have today.
Every year, we also try to look at the data in new and more detailed ways; for example, by adding metrics like time lost in traffic, the best alternative times to travel and congestion levels by time of day and day of the week.

Q: Why did TomTom create the Traffic Index?
A: One of the main reasons why we started publishing the Traffic Index was to help people understand when and where the worst congestion and delays occur, so they could make better choices about when and how they travelled. Initially, our focus was on reaching individual drivers and encouraging them to think about how they could reduce the amount of time they spend in traffic.
As TomTom started expanding into the automotive and enterprise markets, we broadened that core message because we weren’t just addressing consumers anymore, we were also talking to governments, automakers and all other kinds of businesses that rely on traffic information.
Today, our aim is to provide everyone – whether it’s citizens or city planners, business leaders or policymakers – with objective, authoritative traffic information, which they can use to help reduce congestion, improve road safety and lower emissions.
Q: How long does it take to prepare the Traffic Index each year, and what goes into that process?
A: Every year is different, but it usually takes us about three months to put everything together. We start by analyzing the data, which is continually collected by TomTom across the year. The main metrics we look at are congestion levels, time spent driving in rush hour and kilometers driven. Then, we work with design and development teams to visualize the data and prepare the main Traffic Index portal and all the individual city pages.
Obviously, 2020 was not an ordinary year, and that changed the process considerably. We’ve worked on this report for almost the entire year! We’ve analyzed a lot more data and gone much deeper into it than ever before. In fact, we were analyzing congestion information almost continuously because the traffic situation across the world was changing so quickly. The result is that this year’s report includes much more granular detail. For instance, we’ve looked at individual days where congestion levels were exceptionally low compared to 2019. We’ve also analyzed daily commute patterns to see how traffic at peak hours has fluctuated in each city.
Q: What else has been different in 2020?
A: The focal point of the Traffic Index is the city ranking that shows which cities around the world have the worst levels of congestion. We wanted to keep this as our central element but seeing as 2020 has been such an anomaly in terms of traffic flows, we wanted to present the data somewhat differently. For example, it didn’t make sense to showcase cities that improved their congestion levels – like we’ve done in past years – because almost all cities worldwide (with a few exceptions) have seen a reduction in traffic compared to 2019 due to lockdowns and restrictions on movement.
For 2020, our aim was to focus on the ways in which traffic has changed because of the COVID-19 pandemic, and to highlight some of the most interesting events from this year.
Q: What were some of the most memorable stories that came out of 2020? Was there anything that really surprised you?
A: It was really striking to see the mass exodus of people from capitals across Europe when new lockdowns were announced, and how that was reflected in the traffic. The day before Greece’s second lockdown was the most congested day in Athens in 2020. Meanwhile, in Paris, we saw traffic jams reach a record length of 700km on the day before the city introduced new lockdown measures.

Congestion levels in the United States dropped sharply and have stayed low. We really weren’t expecting to see that. Most other cities – especially those in Europe –experienced similar dips, but traffic went back up once restrictions ended. In contrast, congestion levels in US cities have remained consistently low, with traffic in most places still very far away from normal levels. It’s surprising because there’s this general impression that things have gone back to normal faster in the US and people are moving around more freely, but the traffic data tells a different story.
Q: Was 2020 just an anomaly, or are there trends that you expect to continue into 2021?
A: 2020 has definitely been a year unlike any other for traffic, but 2021 will be too! Things aren’t going to return to normal overnight. There have already been significant shifts in people’s behavior: We’re working from home more. We’re travelling less often, and our trips are shorter. We’re using more online shopping and food delivery services. However, it’s hard to predict whether these trends will stick around. We can only keep looking at the data and follow the changes as they unfold.
We’re really interested to see if the reduced levels of congestion we saw in 2020 will persist, and if rush hour traffic will continue to improve. The last year has shown that when we act together, even small actions like choosing to work from home or taking fewer trips, can make a big difference to traffic congestion levels, wasted time, fuel use and air quality. It would be such a huge positive if we could come out on the other side of the pandemic with lasting improvements to mobility. It’s up to all of us – governments, businesses and individuals – to reduce traffic and emissions, and we hope that the insights from this year’s Traffic Index encourage people to take meaningful and long-lasting steps towards a safer, cleaner and congestion-free world.
Visit the TomTom Traffic Index to take a closer look at how the events of 2020 changed traffic.
People also read
 "mobile travel statistics")
How COVID-19 changed mobility: A look back from the future
 "mobile travel statistics")
What can traffic data tell us about the impact of the coronavirus?
 "mobile travel statistics")
Can traffic data help us find a way out of the lockdown?
* Required field. By submitting your contact details to TomTom, you agree that we can contact you about marketing offers, newsletters, or to invite you to webinars and events. We could further personalize the content that you receive via cookies. You can unsubscribe at any time by the link included in our emails. Review our privacy policy .
- / TomTomOfficial
- / tomtomglobal
- Navigation apps
- Personal and professional sat navs
- In-dash navigation
- Accessories
- Maps and service updates
- TomTom Orbis Maps
- Navigation Map
- TomTom Satellite Imagery
- Traffic APIs
- Routing APIs
- Map Display API
- Places APIs
- Tracking & Logistics APIs
- Automotive APIs
- TomTom Digital Cockpit
- Navigation Engine
- Navigation User Interface
- Virtual Horizon
- Navigation SDK
- How we hire
- Diversity and inclusion
- Press releases
- TomTom Traffic Index
- TomTom Customer Portal
- TomTom MOVE
- TomTom Suppliers
- Privacy policy
- Legal information
- Terms of use
- Report vulnerabilities
- Report a map change
Expedia Group Media Solutions
How to attract travelers with data-driven tourism marketing.
By Expedia Group Media Solutions
June 5, 2024
Did you know that 60% of travelers start planning their trip without a specific destination in mind? 1 Data like this can change how and when you communicate with travelers. By understanding travelers’ buying journeys from looking to booking and the latest travel trends, destination marketers can attract travelers and even shape destination decisions.
Travel data and trends can help you understand and appeal to your target audience better. The ability to attract travelers could get more complicated as third-party cookies are phased out, which is why leveraging our robust first-party data can provide the audience insights you need. Keep reading to learn how data in the Path to Purchase report and our Unpack ’24 travel trends study can give you the competitive advantage you need to create data-driven destination marketing campaigns that resonate with travelers.
Travel marketing along the path to purchase
As a destination marketer, you can use Path to Purchase insights to inform your strategy and get your message across clearly to your intended audience in the fragmented travel and tourism industry.
Destination indecisiveness is high

Nearly three in five travelers surveyed didn’t have a specific destination in mind or considered multiple destinations when they first decided to take a trip. More than 80% of travelers from Mexico and 62% of travelers from the U.K. were undecided on their destination, indicating that these travelers may be even more open to destination inspiration. 2
What this means for destinations
Location indecisiveness in the early stage of travel planning creates opportunities for destination marketers to determine destination decisions. Targeting travelers while they’re still in the inspiration phase is the key to building awareness for your brand and showing what makes your destination unlike any other.
To appeal to travelers’ wanderlust and keeping costs in mind in this phase and throughout the purchasing journey, travel advertisers should consider showing breathtaking locations and interesting experiences along with compelling deals and clear calls to action to drive travelers to conversion. It’s also important to know how long people spend looking for vacation inspiration, so you know when to launch your campaign to attract more visitors.
Travelers spend 33 days looking for inspiration for travel destinations

We know that advertisers want to have a clear view of travelers’ buying journeys and the potential touch points they can have with travelers. That first moment, when travelers look for inspiration, is a key opportunity to influence travelers’ choices, and the window to reach people is 33 days long on average. 3
Your current strategy might be to advertise to an audience that already showed an interest in your location, but the data is clear that there’s a large opportunity to create impactful ads that drive those looking for inspiration to consider new destinations — including yours.
It’s also important to note that two-thirds of travelers were influenced by an ad during the inspiration phase of their journey. 4
What this means for destinations:
Inspiration can come from many sources, like family recommendations or advertisements, so destinations need to ensure that they have a multi-channel approach to appeal to travelers during this stage. All our solutions help get your destination in front of our motivated travel audience.
If you’re looking to take your budget further, you could consider a co-op campaign . These campaigns are cost-effective and help marketers meet collective goals, and we do the heavy lifting to connect complementary destinations, hotels, airlines, and more to engage jointly with travelers and drive demand.
When it comes to connecting with travelers across channels, destination marketing organizations (DMOs) see over 80% higher engagement with our native display ads compared to standard display ads. 5 Our native advertising solution uses contextually relevant, non-disruptive ads seamlessly integrated across our 200+ travel websites and apps. These experiential ads allow you to highlight multiple features and images with a single placement and create a pleasing experience for travelers when they’re looking for inspiration or ready to book.
VisitScotland used native advertising to engage travelers with immersive and informative ad placements across prominent homepages and hotel search results pages. By implementing native advertising, the marketing campaign generated an above average click-through rate (CTR) and an 80:1 return on ad spend (ROAS). The campaign’s success elevated the visibility of VisitScotland and effectively engaged qualified travelers, resulting in increased bookings.
You can also leverage in-app ads as part of our native advertising solution to gain a competitive advantage. Did you know that on average, in-app ads drive 150% more conversions than mobile web ads? 6 This is one more lever you can pull to execute a successful marketing strategy.
Travelers use social media the most for inspiration

Social media is where people seek authentic travel experiences and reviews when considering hotels, activities, or destinations. For travelers considering what to book, 65% of them use social media for inspiration. 7
For those in destination marketing, tapping into social media as part of your mobile marketing strategy is an effective way to get travelers to consider your destination. You could add a human touch to your mobile marketing campaigns by utilizing influencer marketing at this stage. If you’re working for a convention and visitors bureau, you can engage travelers on social media by highlighting what they could expect if they choose your destination by using captivating images and copy that highlight authentic experiences.
Discover the latest travel marketing trends

Let’s look at a few more trends that can help you learn how to promote a destination by implementing specific insights into travelers’ behaviors in your campaigns. Our Unpack ’24 study is a glimpse into eight predicted trends we see shaping the travel and tourism industry this year. Based on extensive data and a global survey of 20,000 travelers, the report highlights the growing popularity of alternatives to well-known vacation spots, traveling to see a concert, and booking a trip because of a movie or TV show. You can find more trends in the full study, and you can dive even deeper with our quarterly insights and research .
We’ve pulled trend takeaways to help shape your marketing campaigns and get your destination in front of our global audience of high-value travelers who are coming to dream about, research, and book travel on our trusted brands.
Travelers are booking destination dupes

Destination dupes are budget-friendly alternatives to popular travel spots that offer similar experiences, usually without the hefty price tag or crowds. Think of it as the travel equivalent of finding a high-quality, affordable alternative to a luxury brand. For example, travelers might choose Pattaya over Bangkok or Perth instead of Sydney to enjoy a comparable vibe and attractions at a fraction of the cost. One in three travelers polled said they’ve booked a destination dupe. 8
What this means for destinations
If you think your location could be a dupe, it’s time to position yourself as an alternative. You know what your destination has to offer, and we can help you tell that story to potential travelers. Does it have something in common with a higher-profile location? Try turning that into an advantage and highlight the elements your destination has in common with more well-known places. To take it a step further, you could showcase promotions or deals in your advertising that could appeal to cost-conscious travelers.
Concerts are driving tourism
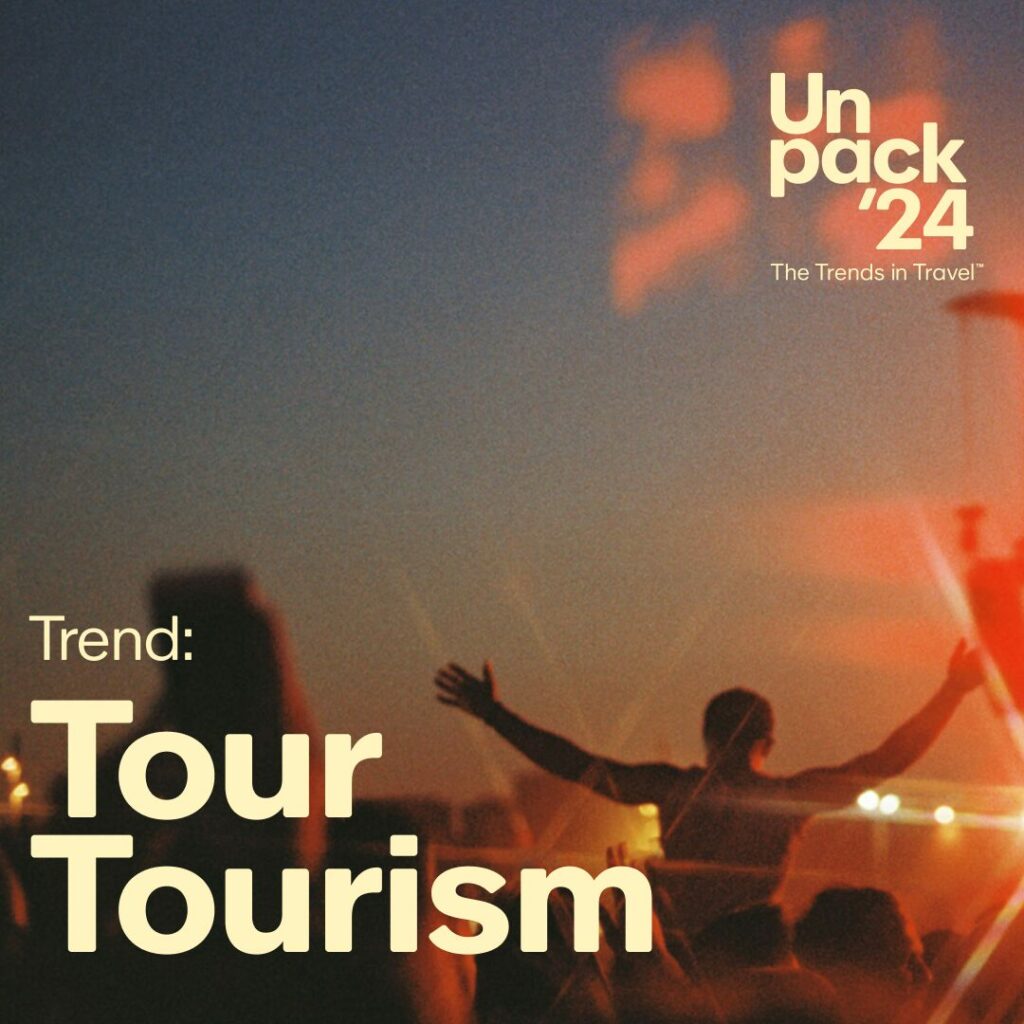
Tour tourism is a popular emerging area of leisure travel. This trend sees concertgoers looking beyond their local venues to catch a show, with 40% of travelers saying they would travel for a concert as an excuse to visit a new place, while 30% would travel because tickets were cheaper elsewhere. 9
When Taylor Swift’s 2024 tour schedule was announced for Asia and Australia, travel searches increased by over 250% year over year for the corresponding tour cities. Similarly, when the 2024 European tour dates were announced, travel searches for May to August 2024 increased by nearly 65% for cities with corresponding tour stops. 10 To reach travelers venturing out of town for a concert, you could target certain search windows, lean into influencer marketing, or create packages with local establishments to provide more value for potential attendees.
Our data-driven audience extension solution can help you reach customized audience segments, like those traveling during a certain time, to make sure your destination is in front of the right people, at the right time, and with the right message using targeted marketing.
Set-jetting could be your untapped travel marketing trend

Set-jetting, planning trips inspired by TV shows and movies, is more popular than ever. More than half of travelers say they’ve researched or booked a trip to a destination after seeing it on a TV show or in a movie. In fact, travelers say TV shows influence their travel decisions more than Instagram, TikTok, and podcasts. 11
You can lean into this source of travel inspiration where people want to book because they were inspired by a particular location. We helped one of our partners, Brand USA , create an immersive and interactive experience and debuted this innovative approach to travel booking with a shoppable streaming platform that delivers unique video content to replicate what travelers would experience at a destination.
Our Media Studio team concepted and built this unique approach to destination exploration that allows travelers to quickly and easily book their trip as they immerse themselves in what the destination has to offer. Brand USA is the first partner to use this trailblazing solution, and we’re excited to roll out this approach for other destinations across the globe.

Reach your goals with the leading travel media network
We know it can be difficult to act on emerging market trends. That’s why we’re here to help you understand consumer behavior and travel trends to ensure your destination stands out from the rest using our expertise, innovative technology, and powerful platform. All our advertising solutions focus on helping DMOs stand out in a crowded marketplace and drive tourism, and we can help you find the perfect combination for your specific needs.
To learn more about the array of advertising solutions we provide and how your destination can leverage data, contact one of our experts today.
Expedia Group Media Solutions is the world's leading travel media network. We connect advertisers with hundreds of millions of travelers across the globe. Our exclusive first-party data on traveler trends, search behavior, and booking data provides travel marketers with unique insights to inform their strategies. We offer a full-funnel suite of solutions to help you convert travelers, and our digital experts can help you create advertising campaigns that deliver.
Recommended for you

destination marketing
Destination organizations: Supporting the tourism industry, sustainable travel, and more
products and solutions
Connect with travelers on Black Friday, Cyber Monday, Travel Tuesday

Atout France, CRT Provence-Alpes-Côte d’Azur launch multi-million euros campaign

Why destination video marketing works
Explore Jobs
- Jobs Near Me
- Remote Jobs
- Full Time Jobs
- Part Time Jobs
- Entry Level Jobs
- Work From Home Jobs
Find Specific Jobs
- $15 Per Hour Jobs
- $20 Per Hour Jobs
- Hiring Immediately Jobs
- High School Jobs
- H1b Visa Jobs
Explore Careers
- Business And Financial
- Architecture And Engineering
- Computer And Mathematical
Explore Professions
- What They Do
- Certifications
- Demographics
Best Companies
- Health Care
- Fortune 500
Explore Companies
- CEO And Executies
- Resume Builder
- Career Advice
- Explore Majors
- Questions And Answers
- Interview Questions
20 Vital Smartphone Usage Statistics [2023]: Facts, Data, and Trends On Mobile Use In The U.S.

- Social Security Statistics
- Social Media Statistics
- Cell Phone Usage Statistics
- Cryptocurrency Statistics
- White Collar Crime Statistics
- Crowdfunding Statistics
- Branding Statistics
- How Many Emails Are Sent Per Day
- Money Laundering Statistics
- Childcare Availability Statistics
- Cold Calling Statistics
- Automation And Job Loss Statistics
- Student Loan Statistics
- Spam Statistics
- Password Statistics
- Ransomware Statistics
- Christmas Spending Statistics
- Average Grocery Cost By State
- Average Screen Time Statistics
- Average Monthly Expenses
- IoT Statistics
- Gen Z Statistics
Research Summary. Each and every day, most of us rely on our phones to communicate, research, and entertain ourselves. We even need our phones to navigate in the car or on foot. With that in mind, it’s unsurprising that cell phone usage has only grown over time.
To find out more about smartphone users in U.S., we’ve gathered all of the most interesting statistics. According to our extensive research:
81.6% of Americans, totaling 270 million people, own a smartphone as of 2023.
The average American spends 5 hours and 24 minutes on their mobile device each day.
Americans check their phones on average 96 times per day , or once every ten minutes.
There are roughly 6.92 billion smartphone users across the world. That’s 86.29% of the global population, as of 2023.
59.16% of website traffic comes from mobile devices, as of 2022.

General Smartphone Usage Statistics
Given that 81.6% of Americans own a smartphone, it’s not surprising that they play a pivotal role in everyday life. From briefly checking the weather to perusing Facebook for two hours, our research shows that:
As of 2021, 90% of mobile time is spent using apps.
That’s up by at least 25% when compared to 2019 numbers. In fact, smartphone users spent a record 3.8 trillion hours using apps in 2021.
Over the past five years (2017-2022), the mobile share of internet usage has increased from 51.1% to 59.1%.
In fact, in the first quarter of 2015, the mobile share of internet usage was only a third of computers and other devices (31.16%). While, as of the start of 2022, the majority of internet usage now comes from mobile devices (59.1%).
17% of Americans still use feature phones.
Remember blackberries and flip phones? Well, it turns out that 17% of Americans still use more archaic mobile devices. Of course, this number is skewed toward particular demographics, with 25% of those making less than $30,000 a year owning a feature phone and 40% of those aged 65 and older owning one.
Smartphones account for 70% of U.S. digital media time.
Some of the forms of digital media that are mostly consumed on smartphones include Games (94% of digital time), Social Media (92%), and Entertainment (83%). Meanwhile, the only two forms of digital media still reliant on desktops are Education (77% share) and Government (72%).
The average American spends at least five hours on their phone per day.
More specifically, just under half of all Americans spend between five to six hours on their phones per day, while a further 22% spend three to four hours on average on their phone daily. Believe it or not, less than 5% of Americans spend less than an hour on their phone per day.

College graduates are 20% more likely to have a smartphone than those who didn’t graduate High School.
Overall, 93% of college graduates have a smartphone, compared to only 75% of individuals with some High School experience. It’s also worth noting that the number jumps up to 89% for those who have some college experience.

Smartphone Use Statistics by Reliance and Addictiveness
Of course, the integration of smartphones in our everyday lives does come with some negative side effects. Today, we are more reliant on and addicted to mobile devices than ever before. Here are the facts:
The average American touches their phone 2,617 times per day.
For heavy users, that number can reach over 5,000. Sounds crazy, but it also counts all those times you’ve fumbled around your pockets in a panic because you thought you lost your phone. Overall, the average smartphone owner will unlock their phone at least 150 times a day.
The average American will check their phone once every ten to 12 minutes.
That means the average American checks their phone at least 96 times per day. Though, 66% of Americans actually check their phones 160 times every day.
27% of Americans living in households earning less than $30,000 a year rely on their smartphones for internet access.
While this is by far the largest demographic, wealthier Americans are also beginning to rely on their phones for the internet as well. 11% of those making between $30,000 and $99,999 are smartphone-reliant for internet access, while only 6% of those making $100,000+ are.

28% of those between the ages of 18-29 do not have broadband but do have a smartphone.
That’s a stark contrast compared to every other generation, who overwhelmingly have broadband. Only 11% of those between 30-49 have a smartphone and no broadband, while that percentage is 13% for those between 50-64 and 12% for those 65+.

Smartphone Usage Statistics and Mobile Commerce
No doubt, the growth of smartphones has had a positive effect on mobile commerce. Especially in the U.S., the mobile commerce industry continues to boom year after year. According to our research:
As of 2021, the m-commerce market comprises nearly 73% of total e-commerce.
What’s more, this is a 39.1% increase from 2016, when m-commerce was only 52.4% of the e-commerce market. In all likelihood, the increased reliance on mobile devices will only see this percentage increase further over time.

As of 2021, 79% of smartphone users have used their mobile devices to make a purchase.
Plus, when considering the fact that the average mobile phone purchase is $94.85, it’s unsurprising to see so many companies focus on apps and other forms of m-commerce advertising.
U.S. m-commerce is expected to experience a massive CAGR of 34.9% between 2020–2026.
This is unsurprising, given the growth of smartphone users within the past five years and the fact that a growing minority of Americans rely on their phones for internet access.
As of 2020, U.S. m-commerce annual revenue reached $339.03 billion.
That means that the U.S. market is responsible for around 11-12% of the world’s total m-commerce revenues.
Smartphone Usage Statistics: Trends and Projections
While it might seem obvious that smartphone usage will continue to increase, there are multiple important factors to consider. When it comes to smartphone usage trends and predictions, here’s what we found:
Year-over-Year (YoY) growth for cell phone usage is expected to be at a stable 2-3% by 2025.
While this might not seem like a lot, it equates to just under a billion new users. For instance, as of 2023, there are 6.92 billion smartphone users globally, and that number is expected to reach 7.34 billion by 2025.
The amount of time spent using smartphone apps in the U.S. has increased by 25% since 2019.
Globally, that number is as high as 30%, with countries like India (80%), Russia (50%), Indonesia (45%), and Turkey (45%) all seeing the highest increases.
By 2025, an estimated 72.6% of global smartphone owners will access the internet solely using their smartphones.
That means that by 2025 there will be over 1.3 billion people who will rely on their smartphones to access the internet worldwide.
There are roughly 10.37 billion mobile connections worldwide.
Believe it or not, that’s 2.46 billion more mobile connections than people worldwide (or 24% more mobile connections in the world than there are people).
There are projected to be 7.52 billion smartphone users by 2026.
That’s 12% more users than there are currently, which is healthy growth, considering the fact that 86% of the global adult population already owns a phone.
Since 2016, the number of smartphone users worldwide has grown by 50%.
In 2016, the number of global smartphone users was only 3.67 billion, or 45% of the total population at the time. However, as of 2022, the number of smartphone users around the globe is now 86% of the total population.
Cell Phone Usage Statistics FAQ
What is the average cell phone usage per day in 2022?
The average American uses their phone for at least five hours and 24 minutes per day. More specifically, just under half of all Americans spend between five to six hours on their phones per day, while a further 22% spend three to four hours on average on their phone daily. Believe it or not, less than 5% of Americans spend less than an hour on their phone per day.
What percentage of the world has a cell phone in 2022?
A considerable 86% of the global population has a smartphone in 2022. That’s a huge percentage, considering the fact that in 2016 the number of global smartphone users was only 3.67 billion, or 45% of the total population at the time.
Further, the prevalence of cell phones is still expected to become more pronounced, projected to be 7.52 billion smartphone users by 2026. That’s 12% more than the current 6.92 billion.
How many times does someone check their phone a day in 2022?
The average American checks their phone 96 times per day, or once every ten to 12 minutes. Though, we actually touch our phones up to 2,617 times per day and unlock our phones 150 times on average. That’s a lot.
How many smartphones are sold each year?
Over 1.5 billion smartphones are sold around the world each year. The current global leader is Samsung, which sold 272 million smartphones in 2021 alone. Other top players include Apple, Xiaomi, OPPO^, and Vivo which all reached their highest-ever annual shipments in the same year.
How many Americans have smartphones?
81.6% of Americans own smartphones, which is equivalent to over 270 million people. This percentage will likely continue to increase, as 53% of American children now have a smartphone before age 11.
What percent of people are addicted to their phones?
47% of people believe they’re addicted to our phones. Several symptoms of this addiction include the fact that 74% of Americans feel uneasy when they leave their home without their phone, 71% check their phone within the first 10 minutes of waking up. and 70% check their phone within the first 5 minutes of receiving a notification.
All together, these trends show that people rely on their phones a great deal, and are often unable to spend time apart from their devices.
It seems like everyone and their mother has a smartphone nowadays, and that’s because almost everyone does. In fact, 81.6% of Americans own smartphones, and 86.29% of the global population does.
And we rely on these devices too, checking them every ten to 12 minutes and spending over five hours using them on average. Believe it or not, over a quarter of those who make $30,000 or less and the same percentage of those between the ages of 18-29 rely on their smartphones for internet access.
And this trend is only expected to continue, as the U.S. e-commerce market is expected to experience a massive CAGR of 34.9% between 2020–2026. Not to mention the simple fact that the amount of time spent using smartphone apps in the U.S. has increased by 25% since 2019.
All of that, combined with the projection that the number of global smartphone users will grow by 12% through 2026, and it’s not hard to see how dominating smartphones really are.
Forbes. “Record 3.8 Trillion Hours Spent On Mobile Apps During 2021 In Another Blockbuster Year For Digital Economy.” Accessed on January 24th, 2021.
The Motley Fool. “A Foolish Take: 17% of Americans Use Feature Phones.” Accessed on January 24th, 2021.
Marketing Charts. “Smartphones Now Account for 70% of US Digital Media Time.” Accessed on January 24th, 2021.
Statista. “How much time on average do you spend on your phone on a daily basis?” Accessed on January 24th, 2021.
Dscout. “Putting a Finger on Our Phone Obsession.” Accessed on January 24th, 2021.
Fox 13. “Americans check their smartphones 96 times a day, survey says.” Accessed on January 24th, 2021.
Pew Research Center. “Digital divide persists even as Americans with lower incomes make gains in tech adoption.” Accessed on January 24th, 2021.
Pew Research Center. “Mobile Fact Sheet.” Accessed on January 24th, 2021.
Oberlo. “Mobile Commerce Sales in 2021.” Accessed on January 24th, 2021.
Appinventiv. “Future of Mobile Commerce: Stats & Trends to Know in 2021-2025.” Accessed on January 24th, 2021.
Statista. “Number of smartphone users from 2016 to 2021.” Accessed on January 24th, 2021.
TechCrunch. “Consumers now average 4.2 hours per day in apps, up 30% from 2019.” Accessed on January 24th, 2021.
CNBC. “Nearly three quarters of the world will use just their smartphones to access the internet by 2025.” Accessed on January 24th, 2021.
Statista. “Percentage of mobile device website traffic worldwide from 1st quarter 2015 to 4th quarter 2022.” Accessed on April 3, 2023.
BankmyCell. “How Many Smartphones Are in the World?” Accessed on April 3, 2023.
How useful was this post?
Click on a star to rate it!
Average rating / 5. Vote count:
No votes so far! Be the first to rate this post.

Jack Flynn is a writer for Zippia. In his professional career he’s written over 100 research papers, articles and blog posts. Some of his most popular published works include his writing about economic terms and research into job classifications. Jack received his BS from Hampshire College.
Recent Job Searches
- Registered Nurse Jobs Resume Location
- Truck Driver Jobs Resume Location
- Call Center Representative Jobs Resume Location
- Customer Service Representative Jobs Resume
- Delivery Driver Jobs Resume Location
- Warehouse Worker Jobs Resume Location
- Account Executive Jobs Resume Location
- Sales Associate Jobs Resume Location
- Licensed Practical Nurse Jobs Resume Location
- Company Driver Jobs Resume
Related posts

What Companies Are In The Transportation Field?

15+ Shocking Shrinking Middle-Class Statistics [2023]: Earnings, Savings, And More
How Many Women Work In Big Tech? [2023]

27 US Employee Turnover Statistics [2023]: Average Employee Turnover Rate, Industry Comparisons, And Trends
- Career Advice >
- Facts and Figures >
- Smartphone Usage Statistics
Home » Mobile
What Is Data Roaming?

Data roaming charges can add up fast, especially while traveling internationally. But what is data roaming, and can it be avoided? Roaming allows you to make calls, send texts, and use wireless data even when you're outside of your network's boundaries. The downside, of course, is that roaming data usually comes with extra charges to your account.
We'll get into how data roaming works, how it can be avoided, and how to find the best mobile traveling perks to save on your monthly phone bill.
- How to avoid paying for data roaming
- How to turn off data roaming
What is data roaming?
Data roaming occurs when your phone disconnects from your carrier's network and hops on another network.
For example, let's say you take a trip across the pond to London. You get off the plane, and like magic, you have signal bars to call a Lyft driver to pick you up from old Heathrow Airport. This happens because your wireless carrier has an agreement in place with a network in England to provide you with roaming service. If you have the roaming feature turned on, all of this will happen automatically.
How much does roaming cost?
What you pay for roaming charges will depend on your carrier , but plan for roaming charges to breakdown somewhat like this:
- $0.25 per minute while talking on the phone.
- $0.10 cents per text message.
- $2-$5 per MB of data.
Needless to say, it is way too expensive to rely on roaming data during your, well, roaming. Seriously, no matter what carrier you use, those roaming rates will quickly add up and you might just rack up $13,000 in roaming fees without even knowing it.
No matter where you go, free Wi-Fi is always a thing you should use. You won't need to use any roaming data whatsoever while connected to Wi-Fi.
By signing up, you agree to our Terms of Use and Privacy Policy .
How to avoid paying for roaming
Before you venture out into an area outside your coverage boundaries , make sure you know what your carrier offers for travel. You don't want to accidentally exceed your allowed data usage, especially with international roaming.
Most cell phone providers have agreements in place to make sure you don't have to pay extra while you're still in North America.
Here's what you need to know about traveling with the four major wireless carriers.
Avoid data roaming charges with Verizon's TravelPass
Verizon's TravelPass works in more than 210 countries . It costs $5 a line for TravelPass access in Mexico and Canada and $10 for access in the other 210 countries. And good news for any customers with Verizon's unlimited phone plans , roaming in Canada and Mexica is included in your plan. The TravelPass allows you to use your normal Verizon cell phone plan abroad without incurring any extra fees.
It's just like your normal phone plan came with you on your trip. So, if you have unlimited data at home, you'll continue to have unlimited data on your trip, and man, that will come in handy.
T-Mobile's free international coverage
T-Mobile is the best wireless carrier for traveling perks. In fact, you might not need to buy a data pass at all. If you have T-Mobile's Magenta plan or above, you get 5GB of premium unlimited data and unlimited standard data and texting in over 210 countries automatically included with your plan. You'll still have to pay $0.25 per minute for making calls while roaming.
Each T-Mobile plan also comes with T-Mobile TRAVEL, which gets T-Mobile users savings on select services like hotels and car rentals when you book on T-MobileTravel.com.
How much is T-Mobile International Pass?
For those of you who don't have an unlimited plan with T-Mobile, you can opt for an International Pass. Here's how the pricing breaks down for the T-Mobile data passes.
- 512MB of high-speed data
- Unlimited calling in 210+ locations
- Smartphone mobile hotspot
- 5GB of high-speed data
- Smartphone Mobile Hotspot
- 15GB of data
AT&T International Day Pass℠
Similar to Verizon , AT&T doesn't have any built-in perks for roaming, so you'll need to buy a travel pass to avoid heavy roaming fees. The AT&T International Day Pass℠ costs you $10 per day, $5 per additional line, and comes with these perks:
- Access to your data
- Unlimited texts to the world
- Unlimited calls to the U.S.
- Unlimited calls to 210+ destinations
I actually used the AT&T day pass while traveling to Europe and it worked beautifully. I was able to use my maps app everywhere and rely on Yelp for everything I ate.
How to make sure that your roaming is turned off
You can always turn off the roaming feature on your phone to make sure your phone doesn't use any roaming data without you knowing about it.
How to turn off roaming data on your iPhone
1. Go to your Settings.
2. Tap the Cellular option.

3. Tap Cellular Data Options.

4. Toggle the Data Roaming option off.

How to turn off data roaming on an Android phone
1. Tap Settings.
2. Tap Connections.
3. Tap Mobile Networks.

4. Toggle the switch to turn Data Roaming Access off.

Related Articles

Our Methodology
Go to Reviews.org AU edition
Internet in your area
Internet in Los Angeles
Internet in New York City
Internet in Atlanta
Internet in Houston
Stay updated on the latest products and services anytime, anywhere.
All content © 2024 Reviews.org. All rights reserved. Disclaimer
An official website of the United States government Here's how you know
Official websites use .gov A .gov website belongs to an official government organization in the United States.
Secure .gov websites use HTTPS A lock ( Lock A locked padlock ) or https:// means you’ve safely connected to the .gov website. Share sensitive information only on official, secure websites.
Air Travel Consumer Report: March 2024 Numbers
Contact: [email protected]
WASHINGTON – The U.S. Department of Transportation (DOT) today released its Air Travel Consumer Report (ATCR) on airline operational data compiled for the month of March 2024 for on-time performance, mishandled baggage, mishandled wheelchairs and scooters, and 1st quarter oversales. The ATCR is designed to assist consumers with information on the quality of services provided by airlines.
For March 2024, 0.9% of flights were cancelled, lower than the 1.3% cancellation rate for March 2023 and the 2.0% cancellation rate for pre-pandemic March 2019.
DOT expects that airlines will operate flights as scheduled and that when they do not, airlines will provide consumers the services promised when a flight is cancelled or delayed because of an airline issue. After a two-year DOT push to improve the passenger experience, the 10 largest airlines now guarantee meals and free rebooking on the same airline and nine guarantee hotel accommodations. Consumer-friendly information regarding airline commitments to their customers is available on the Department’s Airline Customer Service Dashboard at FlightRights.Gov . DOT also pushed airlines to provide fee-free family seating and rolled out a new family seating dashboard that highlights the airlines that guarantee fee-free family seating, and those of the 10 largest that do not, making it easier for parents to avoid paying junk fees to sit with their children when they fly.
DOT recently announced two final rules that require airlines to provide automatic cash refunds to passengers when owed and protect consumers from costly surprise airline fees . These rules will significantly expand consumer protections in air travel, provide passengers an easier pathway to refunds when owed, and save consumers more than half a billion dollars every year in hidden and surprise junk fees. Provisions of the final rule on airline refunds were fortified through the FAA reauthorization bill that President Biden signed into law on May 16, 2024.
In addition, DOT is improving transportation for individuals with disabilities. In July 2023, DOT finalized a rule which requires airlines to make lavatories on new, single-aisle aircraft more accessible. Then, in February 2024, DOT issued a proposal to address other barriers that Americans who use a wheelchair encounter when it comes to air travel by, among other things, proposing to mandate enhanced training for airline employees and contractors who physically assist passenger with disabilities and handle passengers’ wheelchairs.
Further, when necessary, DOT takes enforcement action against airlines and ticket agents that fail to comply with the Department’s aviation consumer protection requirements. In 2023, DOT issued the largest fines in the history of the consumer protection office. This includes a $140 million penalty against Southwest Airlines for failing passengers during the 2022 holiday meltdown. That penalty, which was in addition to over $600 million DOT already ensured was refunded by Southwest to passengers, requires Southwest to establish a $90 million compensation system for passengers affected by significant delays and cancellations beginning April 30, 2024. Additionally, DOT has helped return nearly $4 billion in refunds to travelers since the pandemic began.
In April, DOT announced the launch of the bipartisan Airline Passenger Protection Partnership with 18 state attorneys general to investigate airlines and ticket agents and hold them accountable when they violate aviation consumer protection laws. The partnership significantly expands the Department’s oversight capacity by establishing a new fast-track system prioritizing misconduct cases from state attorneys general who uncover unfair or deceptive airline practices. Through the partnership, DOT will provide state attorneys general with access to the federal complaint database and help ensure that airlines cooperate with state investigations.
Flight Operations
The 623,409 flights operated in March 2024 were 102.47% of the 608,387 flights operated in March 2023. Operated flights in March 2024 were up 2.47% year-over-year from the 608,387 flights operated in March 2023 and up 13.46% month-over-month from 549,439 flights operated in February 2024.

In March 2024, the 10 marketing network carriers reported 628,786 scheduled domestic flights, 5,377 (0.9%) of which were cancelled. In February 2024, airlines scheduled 552,691 domestic flights, 3,252 (0.6%) of which were cancelled. In March 2023, airlines scheduled 616,234 domestic flights, 7,847 (1.3%) of which were cancelled.
March 2024 On-Time Arrival
In March 2024, reporting marketing carriers posted an on-time arrival rate of 78.7%, down from 83.7% in February 2024 and up from 75.4% in March 2023. The year-to-date on-time arrival rate for 2024 is 78.3%.
Highest Marketing Carrier On-Time Arrival Rates March 2024 (ATCR Table 1)
- Hawaiian Airlines – 87.2%
- Delta Air Lines Network – 84.8%
- United Airlines Network – 81.8%
Lowest Marketing Carrier On-Time Arrival Rates March 2024 (ATCR Table 1)
- Frontier Airlines – 66.4%
- JetBlue Airways – 68.4%
- Spirit Airlines – 69.6%
For the first three months of 2024, the reporting marketing carriers posted an on-time arrival rate of 78.31% up from 76.89% for the same period in 2023.
March 2024 Flight Cancellations
In March 2024, reporting marketing carriers cancelled 0.9% of their scheduled domestic flights, higher than the rate of 0.6% in February 2024 and lower than the rate of 1.3% in March 2023. The year-to-date cancellation rate for 2024 is 1.7%.
Lowest Marketing Carrier Rates of Cancelled Flights March 2024 (ATCR Table 6)
- Delta Air Lines Network – 0.2%
- Hawaiian Airlines – 0.6%
- Allegiant Air – 0.6%
Highest Marketing Carrier Rates of Cancelled Flights March 2024 (ATCR Table 6)
- Frontier Airlines – 2.7%
- Spirit Airlines – 1.7%
- JetBlue Airways – 1.4%
For the first three months of 2024, the reporting marketing carriers posted a cancellation rate of 1.7%, equal to 1.7% for the same period in 2023.
Complaints About Airline Service
The release of air travel service complaint data in the Air Travel Consumer Report (ATCR) has been delayed primarily because of the continued high volume of complaints against airlines and ticket agents received by the Office of Aviation Consumer Protection (OACP) and the time needed to review and process these consumer complaints. The Department is investing in modernizing its system for handling consumer complaints with the support of a Technology Modernization Fund (TMF) investment to improve the customer experience for the tens of thousands of consumers who use the system each year and enable OACP to more effectively engage in oversight of the airline industry.
As DOT modernizes its system, given the continued high volume of air travel service complaints concerning airlines and ticket agents, DOT has revised how it processes consumer complaints received after June 1, 2023. From June 2023 until the date its system is modernized, DOT intends to revise the ATCR to display consumer submissions (complaints, inquiries, and opinions) as opposed to complaints for this period. The Department will continue to display civil rights complaints in the ATCR in a similar manner as before and anticipates publishing submission and civil rights complaint numbers for June 1, 2023 to December 31, 2023 in June 2024.
Tarmac Delays
In March 2024, airlines reported six tarmac delays of more than three hours on domestic flights, compared to 10 tarmac delays of more than three hours on domestic flights reported in February 2024. In March 2024, airlines reported one tarmac delay of more than four hours on an international flight, compared to two tarmac delays of more than four hours on international flights reported in February 2024.
Airlines are required to have and adhere to assurances that they will not allow aircraft to remain on the tarmac for more than three hours for domestic flights and four hours for international flights without providing passengers the option to deplane, subject to exceptions related to safety, security, and Air Traffic Control related reasons. An exception also exists for departure delays if the airline begins to return the aircraft to a suitable disembarkation point to deplane passengers by those times.
The Department investigates extended tarmac delays.
Mishandled Baggage
In March 2024, reporting marketing carriers handled 43.1 million bags and posted a mishandled baggage rate of 0.52%, higher than the rate of 0.48% in February 2024, but lower than the rate of 0.58% in March 2023.
For the first quarter of 2024, the carriers posted a mishandled baggage rate of 0.58%, lower than the first quarter 2023 rate of 0.64%.
The Department began displaying the mishandled baggage data as a percentage (i.e., per 100 bags enplaned) in January 2022. This is consistent with the manner that the mishandled wheelchairs and scooters rate is calculated and displayed. In the prior three calendar year reports (2019 to 2021), the Department calculated the mishandled baggage rate based on the number of mishandled bags per 1,000 checked bags.
Mishandled Wheelchairs and Scooters
In March 2024, reporting marketing carriers reported checking 65,793 wheelchairs and scooters and mishandling 859 for a rate of 1.31% mishandled wheelchairs and scooters, higher than the rate of 1.30% mishandled in February 2024 and lower than the rate of 1.33% mishandled in March 2023.
For the first quarter of 2024, the carriers posted a mishandled wheelchair and scooter rate of 1.36%, lower than the rate of 1.40% in the first quarter of 2023.
To address many of the significant barriers and challenges experienced by passengers who use wheelchairs, the Department has proposed a rulemaking that, if adopted as proposed would make it an automatic violation of the Department’s Air Carrier Access Act regulations for airlines to mishandle a passenger’s wheelchair. This Notice of Proposed Rulemaking would also enhance training requirements for airline personnel who provide hands-on transfer assistance to passengers and handle wheelchairs. The proposal is available at https://www.regulations.gov , docket number DOT-OST-2022-0144.
Bumping/Oversales
Bumping/oversales data, unlike other air carrier data, are reported quarterly rather than monthly. For the first quarter of 2024, the 10 U.S. reporting marketing carriers posted an involuntary denied boarding, or bumping, rate of 0.27 per 10,000 passengers, lower than both the rate of 0.29 in the first quarter of 2023 and higher than the rate of 0.20 in the fourth quarter of 2023.
Incidents Involving Animals
As part of its IT modernization, DOT’s Office of Aviation Consumer Protection (OACP) is improving the options for covered carriers to submit their monthly and annual Reports on Incidents Involving Animals During Air Transport. While the new system is being developed, OACP is permitting covered carriers to delay submission of reports on incidents involving animals during air transport. Annual data on such incidents will be published when DOT receives carriers’ complete submissions of the 2023 data.
In March 2024, carriers reported zero incidents involving the death, injury, or loss of an animal while traveling by air, down from the two reports filed in February 2024, and equal to the zero reports filed in March 2023.
Consumers may file air travel consumer or civil rights complaints online at https://secure.dot.gov/air-travel-complaint , or they may mail a complaint to the Office of Aviation Consumer Protection, U.S. Department of Transportation, C-70, W96-432, 1200 New Jersey Avenue, SE, Washington, DC 20590.
The ATCR and other aviation consumer matters of interest to the public can be found at https://www.transportation.gov/airconsumer .
Security Alert May 17, 2024
Worldwide caution, update may 10, 2024, information for u.s. citizens in the middle east.
- Travel Advisories |
- Contact Us |
- MyTravelGov |
Find U.S. Embassies & Consulates
Travel.state.gov, congressional liaison, special issuance agency, u.s. passports, international travel, intercountry adoption, international parental child abduction, records and authentications, popular links, travel advisories, mytravelgov, stay connected, legal resources, legal information, info for u.s. law enforcement, replace or certify documents.
Share this page:
Russia Travel Advisory
Travel advisory september 5, 2023, russia - level 4: do not travel.
Updated to remove COVID-specific information and the kidnapping risk indicator as well as updates to security risks.
Do not travel to Russia due to the unpredictable consequences of the unprovoked full-scale invasion of Ukraine by Russian military forces , the potential for harassment and the singling out of U.S. citizens for detention by Russian government security officials , the arbitrary enforcement of local law , limited flights into and out of Russia , the Embassy’s limited ability to assist U.S. citizens in Russia , and the possibility of terrorism . U.S. citizens residing or travelling in Russia should depart immediately. Exercise increased caution due to the risk of wrongful detentions.
The U.S. government’s ability to provide routine or emergency services to U.S. citizens in Russia is severely limited, particularly in areas far from the U.S. Embassy in Moscow, due to Russian government limitations on travel for embassy personnel and staffing, and the ongoing suspension of operations, including consular services, at U.S. consulates.
There have been numerous reports of drone attacks, explosions, and fires in areas in Western and Southern Russia, particularly near the Russian border with Ukraine, as well as in Moscow and St. Petersburg. In the event of an emergency, U.S. citizens should follow instructions from local authorities and seek shelter immediately.
In September 2022, the Russian government mobilized citizens to the armed forces in support of its invasion of Ukraine. Russia may refuse to acknowledge dual nationals’ U.S. citizenship, deny their access to U.S. consular assistance, subject them to mobilization, prevent their departure from Russia, and/or conscript them.
U.S. citizens should note that U.S. credit and debit cards no longer work in Russia, and options to electronically transfer funds from the United States are extremely limited due to sanctions imposed on Russian banks. There are reports of cash shortages within Russia.
Commercial flight options are extremely limited and are often unavailable on short notice. If you wish to depart Russia, you should make independent arrangements as soon as possible. The U.S. Embassy has severe limitations on its ability to assist U.S. citizens to depart the country and transportation options may suddenly become even more limited. Click here for Information for U.S. Citizens Seeking to Depart Russia.
U.S. Embassy personnel are generally not permitted to travel on Russian air carriers due to safety concerns. The Federal Aviation Administration (FAA) downgraded the air safety rating for Russia from Category 1 to Category 2 on April 21, 2022, due to Russia’s Federal Agency for Air Transport noncompliance with International Civil Aviation Organization (ICAO) safety standards. The Federal Aviation Administration (FAA) has issued a Notice to Air Missions (NOTAM) prohibiting U.S. aviation operations into, out of, within, or over those areas of the Moscow Flight Information Region (FIR), the Samara FIR (UWWW) and the Rostov-na-Donu (URRV) FIR within 160NM of the boundaries of the Dnipro (UKDV) Flight Information Regions. For more information, U.S. citizens should consult the Federal Aviation Administration’s Prohibitions, Restrictions, and Notices .
The right of peaceful assembly and freedom of expression are not consistently protected in Russia. U.S. citizens should avoid all political or social protests and not photograph security personnel at these events. Russian authorities have arrested U.S. citizens who have participated in demonstrations and there are numerous reports Russian nationals have been detained for social media activity.
Country Summary:
U.S. citizens, including former and current U.S. government and military personnel and private citizens engaged in business who are visiting or residing in Russia, have been interrogated without cause and threatened by Russian officials, and may become victims of harassment, mistreatment, and extortion.
Russian security services may fail to notify the U.S. Embassy of the detention of a U.S. citizen and unreasonably delay U.S. consular assistance. Russian security services are increasing the arbitrary enforcement of local laws to target foreign and international organizations they consider “undesirable.”
Russian security services have arrested U.S. citizens on spurious charges, singled out U.S. citizens in Russia for detention and harassment, denied them fair and transparent treatment, and convicted them in secret trials or without presenting credible evidence. Furthermore, Russian authorities arbitrarily enforce local laws against U.S. citizen religious workers and have opened questionable criminal investigations against U.S. citizens engaged in religious activity. U.S. citizens should avoid travel to Russia to perform work for or volunteer with non-governmental organizations or religious organizations.
There have been multiple security incidents in southwestern Russia related to Russia’s unprovoked and unjustified invasion of Ukraine. The Russian government declared martial law in Russia’s regions bordering Ukraine (Bryansk, Kursk, Belgorod, Voronezh, Rostov, Krasnodar) on October 20, 2022. The martial law regime allows the rapid introduction of restrictive measures such as curfew, seizure of private property, restriction of entry/exit and freedom of movement, internment of foreigners, forced relocation of local residents, and restrictions on public gatherings. U.S. citizens should avoid all travel to these areas.
Recent legislation has expanded the ability of Russian authorities to detain, question, and arrest individuals suspected of acting against Russia’s interests, including posts on personal social media accounts, engaging with foreign and international entities, discrediting the Russian state or military, as well as advocating for the rights of LGBTQI+ persons.
Terrorist groups, both transnational and local terrorist organizations, and individuals inspired by extremist ideology continue plotting possible attacks in Russia. Terrorists may attack with little or no warning, targeting tourist locations, transportation hubs and systems, markets/shopping malls, local government facilities, hotels, clubs, restaurants, places of worship, parks, major sporting and cultural events, educational institutions, airports, and other public areas. Travel to the North Caucasus (including Chechnya and Mt. Elbrus) is prohibited for U.S. government employees and strongly discouraged for U.S. citizens.
The international community, including the United States and Ukraine, does not recognize Russia’s purported annexation of Crimea as well as four other Ukrainian oblasts – Donetsk, Luhansk, Kherson, and Zaporizhzhya – that Russia has purported to annex more recently. There is extensive Russian Federation military presence in these areas. Russia staged its further invasion of Ukraine, in part, from occupied Crimea, and Russia is likely to take further military actions in Crimea, and the four other Ukrainian oblasts are the subject of intensive fighting. There are continuing abuses against foreigners and the local population by the occupation authorities in these regions, particularly against those who are seen as challenging Russia’s authority.
The U.S. Embassy in Kyiv continues to provide consular services to U.S. citizens in Crimea as well as four other Ukrainian oblasts partially occupied by Russia – Donetsk, Luhansk, Kherson, and Zaporizhzhya, although the ongoing conflict severely restricts the Embassy’s ability to provide services in these areas.
Read the country information page for additional information on travel to Russia.
If you decide to travel to Russia:
- Familiarize yourself with the information on what the U.S. government can and cannot do to assist you in a crisis overseas .
- Have a contingency plan in place that does not rely on U.S. government assistance. Review the Traveler’s Checklist .
- Monitor local and international media for breaking events and adjust your contingency plans based on the new information.
- Ensure travel documents are valid and easily accessible.
- Visit our website for Travel to High-Risk Areas .
- Enroll in the Smart Traveler Enrollment Program (STEP) to receive Alerts and make it easier to locate you in an emergency.
- Follow the Department of State on Facebook and Twitter .
- Review the Country Security Report for Russia.
- Visit the CDC page for the latest Travel Health Information related to your travel.
Travel Advisory Levels
Assistance for u.s. citizens, russian federation map, search for travel advisories, external link.
You are about to leave travel.state.gov for an external website that is not maintained by the U.S. Department of State.
Links to external websites are provided as a convenience and should not be construed as an endorsement by the U.S. Department of State of the views or products contained therein. If you wish to remain on travel.state.gov, click the "cancel" message.
You are about to visit:
This free line-cutting app could save you hours at the airport
Skip the wait at customs and immigration with Mobile Passport Control, travel’s best open secret.

A month ago, I flew from Paris back to Baltimore full of despair: My vacation was over , and the trip home seemed to take an eternity .
Then I saw the snaking line for customs and immigration.
What could have sunk me into a deeper woe actually revived me, because I didn’t have to wait in that soul-sucking purgatory. I didn’t have to wait in the shorter but still well-populated Global Entry line, either.
Instead, I headed to a third option that most people miss: the Mobile Passport Control (MPC) line. Thanks to this secret national treasure, I was out of the airport and hailing my Uber in eight minutes. (I timed it.)
You, too, can experience this completely free VIP treatment the next time you fly internationally. Here’s how.
What is Mobile Passport Control?
Think of Mobile Passport Control like a fast pass for international travel. It’s a free service that allows select travelers to access a U.S. Customs and Border Protection (CBP) express lane with a smartphone app.
To be eligible, you must be a U.S. citizen, a lawful permanent resident, a Canadian B1/B2 citizen visitor or a returning Visa Waiver Program traveler with approved Electronic System for Travel Authorization.
You can use the app only when returning from an international trip at an MPC-approved site . That includes more than 30 U.S. international airports, 14 pre-clearance locations (among them airports in Abu Dhabi, Aruba and Ireland) and four seaports.
Why don’t more people use it?
Although you’ll see signs promoting Mobile Passport around those sites and sometimes ads on in-flight entertainment systems, most people aren’t taking advantage of the service. Just 8 percent of eligible travelers used the app in the 2024 fiscal year, according to CPB spokesman Aaron Bowker, though that’s a 50 percent increase from the year before.
The company Airside Mobile originally developed the app and launched it in 2014, first at Atlanta’s Hartsfield-Jackson International Airport. Awareness of its powers seemed to spread mostly by word of mouth and some signs around airports. In 2022, CBP officially took over the app, launching an updated version that left the original defunct. Some travelers missed the memo and figured the service had been discontinued when their app no longer worked.
But CBP is invested in the program’s growth.
“We’ve expanded the population of travelers that are able to use it. We’ve started to educate the airports. Airports have started to put in a better queuing system,” Bowker said. “And so we’re expecting to see this continue to increase.”
How Mobile Passport works
First, download the Mobile Passport app from the Google Play Store or Apple App Store . Unlike line-cutting services such as Global Entry or TSA PreCheck , MPC doesn’t require preapproval or an application process. Even if you forget to do it before your trip, it’s so quick to set up, you can install it as you’re walking up to customs.
When it’s time to pass through, eligible travelers can fire up the app, answer the standard few questions about their trip that they would at a customs kiosk, take a selfie and proceed to a dedicated Mobile Passport lane, where an officer will confirm their details and wave them through. Individual travelers and families of up to 12 people can use the app at once.
It makes me feel like a fancy diplomat — not someone who just spent 12 hours in economy — every time I use it.
Mobile Passport vs. Global Entry
Mobile Passport and Global Entry both promise a faster airport experience. Both also come with pros and cons.
One MPC downside: Although it’s free to use and rarely has a line of more than a few travelers, it’s not at every airport. And Mobile Passport lanes may not always be available even in places that claim to offer it.
CBP spokeswoman Corey Daboin said the agency is aware of that problem. Sometimes, issues are due to infrastructure constraints — some airports may not have the lanes available to operate MPC continuously — or management. The agency stresses, however, that Mobile Passport is a priority, and “we are working on making that so it’s not an issue moving forward,” Daboin said.
If you fly internationally and your home airport doesn’t have MPC yet, Global Entry is a great option. It does cost $100 and requires an application and interview process. But it also comes with a TSA PreCheck membership and is good for five years — plus it’s still light-years better than waiting in that endless regular line.
More travel tips
Vacation planning: Start with a strategy to maximize days off by taking PTO around holidays. Experts recommend taking multiple short trips for peak happiness . Want to take an ambitious trip? Here are 12 destinations to try this year — without crowds.
Cheap flights: Follow our best advice for scoring low airfare , including setting flight price alerts and subscribing to deal newsletters. If you’re set on an expensive getaway, here’s a plan to save up without straining your credit limit.
Airport chaos: We’ve got advice for every scenario , from canceled flights to lost luggage . Stuck at the rental car counter? These tips can speed up the process. And following these 52 rules of flying should make the experience better for everyone.
Expert advice: Our By The Way Concierge solves readers’ dilemmas , including whether it’s okay to ditch a partner at security, or what happens if you get caught flying with weed . Submit your question here . Or you could look to the gurus: Lonely Planet and Rick Steves .

- Deutschland
- Asia, Australia & New Zealand
- Europe, Middle East & Africa
- United States & Canada
- Latinoamérica
Travelers most frequently use their mobile devices to research activities or attractions, to locate shopping areas and restaurants, or to look up directions.
Google/Phocuswright Travel Study, Base: Smartphone users, U.S. N = 673, U.K. N = 635, Australia N = 617, India N=707, France N = 480, Germany N=553, Brazil N= 640, Japan N= 462, South Korea N= 688, 2017.
Share this page
Travel research on mobile statistics - 1, related content, related data.
More than 160 million people have gone into their Google Accounts to review and adjust their privacy settings.
Responsible marketer 02
of experience bookings are happening once travelers arrive at their destination.
Travel search 01
Search interest in the U.S. for “my activity,” where people can manage information saved to their Google Account has increased sixfold since 2016.
Responsible marketer 01
Travelers who book their activities ahead of their trip spend 47% more on lodging and 81% more on transportation than those who wait to book in destination.
Travel search 02
In the 12 weeks leading up to a trip, there are 3X more experiences searches than hotel searches.
Travel search 03
In the 12 weeks leading up to a trip, 8X more experiences searches than air searches
Travel search 04
COMMENTS
Over the last five years, travel apps' global revenue has tripled in size, exceeding 1.2 billion U.S. dollars in 2023. As estimated by Statista Market Insights, the United States alone ...
Key Travel App Statistics. The travel app market generated $629 billion in revenue last year, a 13% increase on the previous year. Booking generated the most revenue out of all online travel agencies in 2023. Over 850 million people used a travel app in 2023. Expedia holds a slight lead in the US market, at 19.3% market share.
of mobile travelers completed a booking after doing research on their smartphone, up from 70% in 2016. Google/Ipsos Connect, U.S., Traveler Attitudes & Behaviors, 2017, U.S. travelers, A18+ who have taken at least 1 personal or business trip in the past 6 months and are typically sole/shared decision-maker for trips, mobile travelers defined as ...
This reflects the growing trends of mobile and spontaneous travel booking. In its report U.S. State of Travel, media measurement and analytics company comScore estimated that mobile travel spend has grown 4.5 times from 2014 to 2017. In comparison, mobile retail spend grew just two times in the same period.
How the Travel Research Process Plays Out in Time-to-Make-a-Plan Moments. 3 X. 8 X. 70% of mobile travelers have done travel research on their smartphone. Discover more mobile travel data and statistics on Think with Google.
More than half of hotel bookings are made last minute. On average 55% of hotel bookings made on the Hopper app in 2022 were for same-day check-in. This is an increase of +7.5% points compared to 2021 and 10.8% points compared to 2020. Bookings made in 2023 are trending even more last minute in the first three months of the year, with 63% of ...
Explore T-Mobile's travel benefits. Enjoy our best deals and discounts whether you are traveling across the country or across the globe. Skip to main ... calls to U.S., Mexico, and Canada). Go5G plans: Up to 5GB high-speed data in 11 Central European countries; otherwise, standard speeds approximately 256Kbps. Go5G Next and Go5G Plus plans: Up ...
The Daily Travel data and number of people staying home and not staying home are estimated for the Bureau of Transportation Statistics by the Maryland Transportation Institute and Center for Advanced Transportation Technology Laboratory at the University of Maryland. The daily travel estimates are from a mobile device data panel from merged ...
The U.S. Travel Insights Dashboard, developed in collaboration with Tourism Economics, is supported by more than 20 data sources. The dashboard is the most comprehensive and centralized source for high-frequency intelligence on the U.S. travel industry, tracking industry performance, travel volumes and predictive indicators of recovery ...
If you're a T-Mobile customer on qualifying plan, you can add an International Pass to get more high-speed data and unlimited voice calling in 215+ countries and destinations. 1-Day (512MB) International Pass: 512MB of high-speed data and unlimited calling, to be used up to 24 hours, for $5. 10 day (5GB) International Pass: 5GB of high-speed ...
Sometimes you want to add some extra data to your existing plan while abroad, and that's where International Passes come in. We've got various passes to choose from depending on your needs and length of travel. International 1 Day Pass: 512MB of high-speed data and unlimited calling, to be used up to 24 hours, for $5/day.
2020 was a year like no other, changing the way we lived, worked and moved. These profound changes are reflected in this year's edition of the TomTom Traffic Index. City centers became ghost towns after countries worldwide locked down. Peak hour traffic dwindled as we swapped the daily commute for working from home.
Travel data and trends can help you understand and appeal to your target audience better. The ability to attract travelers could get more complicated as third-party cookies are phased out, which is why leveraging our robust first-party data can provide the audience insights you need. Keep reading to learn how data in the Path to Purchase report and our Unpack '24 travel trends study can give ...
Smartphone Usage Statistics and Mobile Commerce. No doubt, the growth of smartphones has had a positive effect on mobile commerce. Especially in the U.S., the mobile commerce industry continues to boom year after year. According to our research: As of 2021, the m-commerce market comprises nearly 73% of total e-commerce.
If you have T-Mobile's Magenta plan or above, you get 5GB of premium unlimited data and unlimited standard data and texting in over 210 countries automatically included with your plan. You'll still have to pay $0.25 per minute for making calls while roaming. Each T-Mobile plan also comes with T-Mobile TRAVEL, which gets T-Mobile users savings ...
Travel! Today, T-Mobile (NASDAQ: TMUS) is taking coverage above and beyond, pushing the boundaries of their own coverage map to 30,000 feet and abroad. Introducing T-Mobile's latest Un-carrier move, Coverage Beyond, with free high-speed data in 210+ countries and destinations AND free in-flight connectivity and streaming all flight long on ...
WASHINGTON - The U.S. Department of Transportation (DOT) today released its Air Travel Consumer Report (ATCR) on airline operational data compiled for the month of March 2024 for on-time performance, mishandled baggage, mishandled wheelchairs and scooters, and 1st quarter oversales. The ATCR is designed to assist consumers with information on the quality of services provided by airlines.
Travel Advisory. September 5, 2023. Russia - Level 4: Do Not Travel. O D U T. Updated to remove COVID-specific information and the kidnapping risk indicator as well as updates to security risks. Do not travel to Russia due to the unpredictable consequences of the unprovoked full-scale invasion of Ukraine by Russian military forces, the ...
of mobile travelers agree that when researching on their smartphones, they look for the most relevant information regardless of the travel company providing the information. Google/Ipsos Connect, Travel Playbook Omnibus, n=1063 U.S. travelers ages 18+ who use a smartphone and for whom the statement is applicable, April 2016.
Skip the wait at customs and immigration with Mobile Passport Control, travel's best open secret. Advice by Natalie B. Compton. Staff writer. June 5, 2024 at 7:00 a.m. EDT
Stay connected in Mexico & Canada with our best phone plans. Unlimited basic data and streaming in Mexico and Canada. Plus, unlimited talk and text to and from the US, Mexico, and Canada. Not for extended international use. Coverage not available in some areas. See plans for details.
President Biden believes we must secure our border. That is why today, he announced executive actions to bar migrants who cross our Southern border unlawfully from receiving asylum. These actions ...
Traffic share of travel and hospitality websites worldwide 2022-2023, by device. According to a study focusing on travel and hospitality websites worldwide, mobile users accounted for most online ...
Google/Phocuswright Travel Study, Base: Smartphone users, U.S. N = 673, U.K. N = 635, Australia N = 617, India N=707, France N = 480, Germany N=553, Brazil N= 640, Japan N= 462, South Korea N= 688, 2017. How smartphones influence the entire travel journey in the U.S. and abroad. How to win travelers in the age of assistance The future of travel ...
President Joseph R. Biden, Jr. will attend the G7 Leaders' Summit in Apulia, Italy on June 13-14. The President and G7 leaders will discuss a range of the most pressing global issues, including ...