- Irresistible Tech Gifts for That Special Dad
- Killer Smartphone Deals We Love

How to Activate the iPhone Debug Console or Web Inspector
Use Safari's web developer tools to study problematic websites
:max_bytes(150000):strip_icc():format(webp)/ScottOrgera-f7aca23cc84a4ea9a3f9e2ebd93bd690.jpg)
- Saint Mary-of-the-Woods College
- Switching from Android
What to Know
- Activate Web Inspector on iOS: Go to Settings > Safari > Advanced and move the Web Inspector toggle switch to the On position.
- Use Web Inspector on macOS: Connect your iOS device to a Mac and choose the URL to inspect from the Develop menu.
If you run into a bug or another issue with a website on Safari mobile, use the Web Inspector tool to investigate. This article explains how to use the Safari console for iPhone to debug errors with the help of your Mac computer. Instructions apply to iPhones with iOS 14, iOS 12, or iOS 11, and well as Macs with macOS Big Sur (11.0), macOS Catalina (10.15), or macOS Mojave (10.14).
Activate Web Inspector on Your iPhone or Other iOS Device
The Web Inspector is disabled by default since most iPhone users have no use for it. However, if you're a developer or you're curious, you can activate it in a few short steps. Here's how:
Open the iPhone Settings menu.
On an iPhone with an early version of iOS, access the Debug Console through Settings > Safari > Developer > Debug Console . When Safari on the iPhone detects CSS, HTML, and JavaScript errors, details of each display in the debugger.
Scroll down and tap Safari to open the screen that contains everything related to the Safari web browser on your iPhone, iPad, or iPod touch.
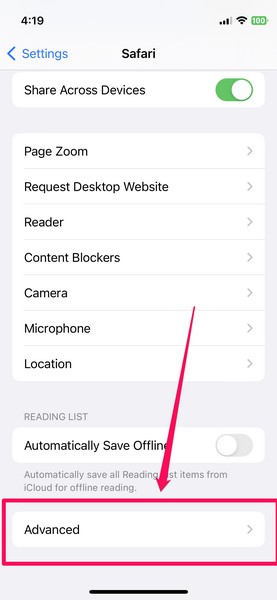
Scroll to the bottom of the page and select Advanced .
Move the Web Inspector toggle switch to the On position.
Connect Your iOS Device to Safari on a Mac
To use the Web Inspector, connect your iPhone or another iOS device to a Mac that has the Safari web browser and enable the Develop menu .
With Safari open, select Safari from the menu bar and choose Preferences .
Select the Advanced tab.
Select the Show Develop menu in menu bar check box and close the settings window.
From the Safari menu bar, select Develop and choose the name of your attached iOS device, then select the URL that appears under Safari to open the debug console for that site.
After you connect your device, use your Mac to inspect the website you want to debug and have it open in the Safari mobile browser.
What Is Web Inspector?
Web developers use Web Inspector to modify, debug, and optimize websites on Macs and iOS devices. With Web Inspector open, developers can inspect the resources on a web page. The Web Inspector window contains editable HTML and notes regarding the styles and layers of the web page in a separate panel.
Before iOS 6, the iPhone Safari web browser had a built-in Debug Console that developers used to find web page defects. Recent versions of iOS use Web Inspector instead.
With Safari 9 and OS X Mavericks (10.9), Apple introduced Responsive Design Mode in Web Inspector. Developers use this built-in simulator to preview how web pages scale to different screen sizes, resolutions, and orientations.
To set up Web Inspector on your iPad, open your iPad's Settings and select Safari > Advanced , then turn Web Inspector On . Connect the iPad to a Mac computer, then open Safari on the Mac and select Safari > Preferences > Advanced , then turn on Show Develop menu in menu bar .
You cannot just connect your iPhone to a Windows PC and start using Web Inspector through Chrome like you can with a Mac. Installing package manager software can provide you a sort of workaround, but it's not recommended unless you're familiar with the package management app you intend to use.
Get the Latest Tech News Delivered Every Day
- Add More Features by Turning on Safari's Develop Menu
- 4 Ways to Play Fortnite on iPhone
- How to Activate and Use Responsive Design Mode in Safari
- How to Change the Default Search Engine in Chrome for iOS
- What Is Safari?
- How to Inspect an Element on a Mac
- How to Use Web Browser Developer Tools
- How to Disable JavaScript in Safari for iPhone
- How to View HTML Source in Safari
- How to Manage History and Browsing Data on iPhone
- How to Clear Search History on iPhone
- How to Reset Safari to Default Settings
- How to Change Your Homepage in Safari
- The Top 10 Internet Browsers for 2024
- 10 Hidden Features in macOS Sonoma
- How to Manage Cookies in the Safari Browser

How to Enable and Use Safari Web Inspector on iPhone in iOS 17
If you are a developer or a website manager, we are sure you know the importance of inspecting websites to analyze website issues or debug web pages. On iOS, Safari used to have a built-in Debug Console for inspecting web page issues. However, since iOS 6, Safari on iPhones has been relying on the Web Inspector tool to show to debug and analyze websites.
So, if you are looking for a way to enable the Web Inspector tool on iOS or iPadOS and use it to debug websites on your Mac, we have prepared this simple guide for you. In this article, we are going to provide step-by-step ways to enable and use the Web Inspector tool on your iOS and macOS devices. This way you will be able to easily track down issues in iOS and iPadOS websites on your macOS devices.
Enable and Use Safari Web Inspector on iPhone
Now, below we have provided the ways to enable the Web Inspector tool for Safari on iOS and macOS devices. Hence, you must already know by now that the Web Inspector tool for Safari will work only if you have a Mac or a MacBook with which you can connect your iOS device.
With the method provided here, you will be able to use the Web Inspector tool to analyze all the resources of web pages, debug, and fix underlying issues of the pages. This method can also be used with the iOS Simulator, which comes free with XCode from the Mac App Store, to view and scale web pages for different screen sizes.
Enable Web Inspector on iPhone
Before you can view the websites from the iOS Safari on your Mac using Web Inspector, you will need to enable the tool on your iOS device. You can do that using the steps right below.
1. Open the Settings app on your iPhoned.
2. Go to Safari .
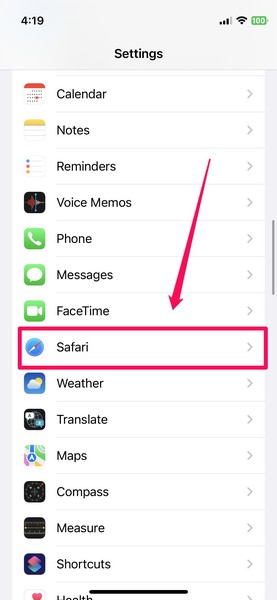
3. Scroll down to the bottom and tap the Advanced button.
4. On the Advanced settings page, enable the toggle for Web Inspector .
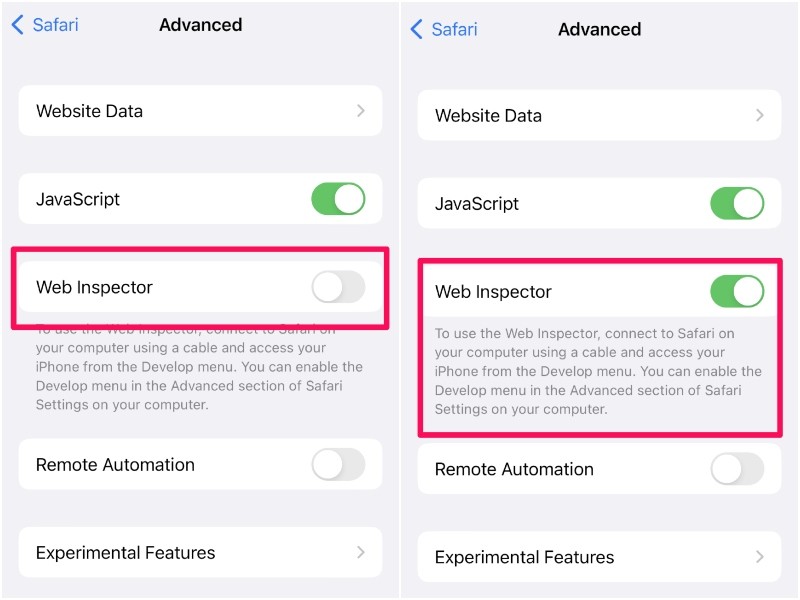
This is all you have to do to enable the Web Inspector tool on iOS. With this advanced setting enabled on your iPhone, you will be able to view and edit the websites opened on your iOS Safari right inside the Safari browser on your Mac.
However, before that, you will need to tweak a few settings in Safari on your Mac. Read on to find out how you can use the Web Inspector tool in Safari on your Mac.
Use Web Inspector for iOS Safari on Mac
Now, to use the Web Inspector tool for iOS/ iPadOS Safari on Mac, you need to connect your iPhone or iPad with the tool enabled to your Mac via a USB connection. Once both devices are connected, follow the steps below:
1. Open the Safari browser on your Mac.
2. Click the Safari option on the top navigation bar and select the Preferences option from the menu.
3. Now, go to the Advanced tab and check the box for the “Show Develop menu in menu bar” option.
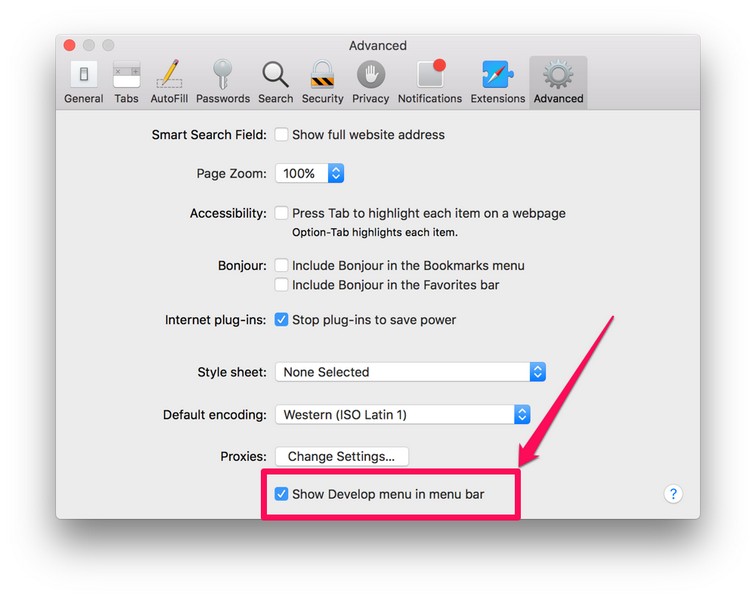
4. Exit the Settings window and you will see the new Develop menu on your Safari menu bar at the top.
5. Click the Develop option and you will see your iPhone or iPad listed.
6. Move your cursor on your device and you will see the websites opened on your iOS or iPadOS Safari appear on the drop-down list.
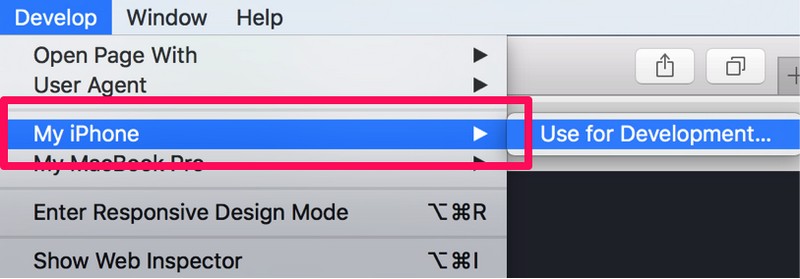
7. From here, you can click the website that you want to open in the Web Inspector console on your Mac for optimization and debugging.
So, this way, you can easily enable and use the Web Inspector tool for Safari on your iPhone or iPad and analyze websites on your Mac. The Web Inspector is especially useful if you are a macOS developer who also develops or manages iOS websites. With this, you can easily view the web pages from iPhones or iPads on your Mac and tinker with them to improve their quality and fix other issues.
How can I enable Web Inspector on my iPad?
The process of enabling the Web Inspector tool on iPhones and iPads is pretty much the same. Hence, you can use the method provided in this article to easily enable Web Inspector in Safari on your iPad and your iPhone.
Can I inspect web pages on my iPhone or iPad?
Although you can enable the Web Inspector tool in Safari on your iPhone or iPad, you will require a macOS device and a USB-Lightning cable to actually use the tool for inspecting web pages.
How can I bring up the Web Inspector console on Mac?
After enabling the Develop menu in the menu bar in Safari on your Mac (steps provided above), you can click the Develop option in Safari and select your connected iPhone or iPad to view the web pages. From here, you can click a web page and the Web Inspector console will open up the resources.
Final Words
So, this was all about enabling and using the Web Inspector tool in Safari on iPhones and iPads. It is a great tool for website developers to prototype, optimize, and debug web content on iOS, iPadOS, and macOS devices. And if this guide added value to your work or helped you in any way, do let us know in the comments below.
Dwaipayan Sengupta
After graduating with a Bachelor's in Business Administration, Dwaipayan has worked for reputable media firms such as Beebom and Pinkvilla. He has written over 1500 articles in his 3+ years of writing career and specializes in How-tos about Windows issues and features, flash news, and custom mechanical keyboards. When he is not writing or customizing mechanical keyboards, you can find him playing an intense Valorant match or browsing through his Reddit feed.
You may also like
How to Enable or Disable U1 Chip on iPhone in iOS 17
How to Fix Zoom App Not Working on iPhone

How to Fix Swipe-Up Not Working on iPhone
How to Use Your Smartphone as a Mouse and Keyboard in Windows 11
Leave a reply cancel reply.
Your email address will not be published. Required fields are marked *
Save my name, email, and website in this browser for the next time I comment.

Tips & Tricks
Troubleshooting, enable the safari debug console on iphone & ipad.
Safari for iOS includes an optional debug console to help web developers track down and resolve issues with webpages on iPhone and iPad.
Even better, with the latest versions of iOS it actually uses the same Web Inspector that Safari on desktop does too, meaning if you connect the iPhone or iPad to the computer you can use the Safari debugging tools directly with your iOS or iPadOS device
Older versions of iOS have this capability too, and while not as in inclusive as the desktop Safari debug and developer tools , it’s still useful and is easy to enable or disable on the iPhone and iPad.
Let’s learn how to enable this feature on both new and old versions of iOS, and learn what’s different between the versions as well.

How to Enable & Use Web Inspector in Safari for iPhone & iPad
On modern iOS and iPadOS versions, here’s how Safari web inspector works:
- Open Settings > Safari > Advanced then tap to enable “Web Inspector”
- Connect the iPhone or iPad to a Mac, then go to Safari and enable the developer menu if you haven’t done so by going to Safari > Preferences > Advanced > Show Develop menu bar
- Pull down the “Develop” menu bar and find the iPhone or iPad, and then open the web page you wish to debug
- Safari Web Inspector will open where you can debug and inspect web elements from the iOS or IPadOS device directly in Safari on the Mac
Now as you navigate on the iPhone or iPad you will find the Web Inspector in Safari on the Mac will update.
You can access the debug Console through the Console tab in the web inspector, and you can access the debugger through the Debugger tab. And of course the usual web inspector tools for elements, resources, network, etc, are available to use as well.

You can also use a View Source trick for iOS and iPadOS while you’re on the go, if needed too.
How to Enable Debug Console on Older iOS Versions
If you have an older version of iOS on an older iPhone or iPad, the whole debug experience is on the device and you don’t have the ability to connect it to Safari on a Mac. Nonetheless it’s still quite useful, here’s how it works:
- Launch “Settings” and tap on “Safari”
- Tap on “Advanced”
- Slide “Debug Console” to ON
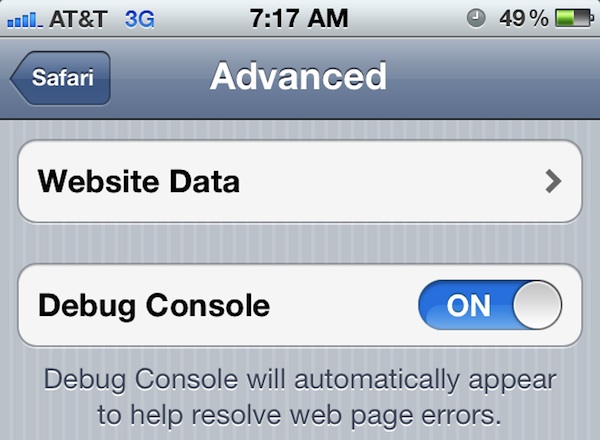
Once enabled, tap on the Debug Console at the top of any Safari screen to see web page errors.
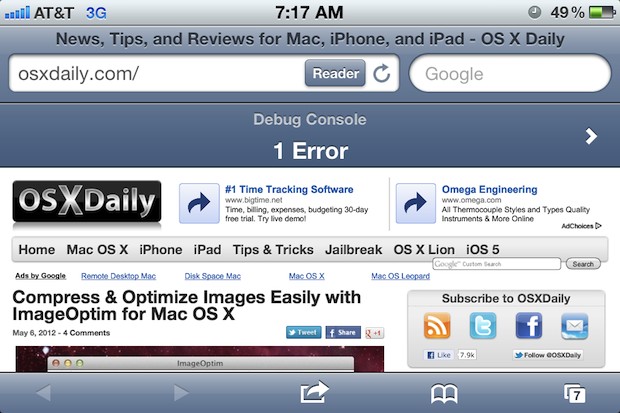
The default list shows all errors, but you can drill down to more specific HTML, JavaScript, and CSS errors by tapping them individually.
Another useful tool for mobile web developers is Firebug Lite for iOS , which utilizes a javascript bookmarklet to load a simpler version of the popular Firebug development tool. That functionality is probably most useful for the older iOS versions as well, since newer releases have new capabilities.
Do you use any web developer tools for iPhone or iPad? Share with us any tips, tricks, apps, or techniques in the comments below.
Enjoy this tip? Subscribe to our newsletter!
Get more of our great Apple tips, tricks, and important news delivered to your inbox with the OSXDaily newsletter.
You have successfully joined our subscriber list.
Related articles:
- Enable Safari Hidden Debug Menu in Mac OS X
- Make Console Easier to Read in Mac OS X with PID, Icons, & Bold View Options
- Enable Mac App Store Hidden Debug Menu
- How to Enable a Hidden Debug Menu in Photo Booth for Mac OS X
» Comments RSS Feed
out dated — no longer accurate
The topmost section is accurate for new iOS versions using Web Inspector, the lower portion is for older versions with Debug Console. Hope that helps!
Leave a Reply
Name (required)
Mail (will not be published) (required)
Subscribe to OSXDaily
- - 15 Keynote Keyboard Shortcuts for iPad
- - How to Install Java on Mac with M3, M2, M1 Apple Silicon Chip
- - Install & Run iTunes, Aperture, or iPhoto in MacOS Sonoma with Retroactive
- - 17 Numbers Keyboard Shortcuts for iPad
- - How to Find a Misplaced Apple Watch with iPhone’s Ping My Watch
- - PSA: Updating to MacOS Sonoma or iOS 17 May Enable iCloud Keychain
- - iOS 17.5.1 & iPadOS 17.5.1 Update Released to Fix Reappearing Deleted Photos Bug
- - MacOS Ventura 13.6.7 & macOS Monterey 12.7.5 Updates Available
- - iOS 16.7.8 & iPadOS 16.7.8 Updates for Older iPhones & iPads Available
- - iOS 17.5 & iPadOS 17.5 Updates Released with Bug Fixes
iPhone / iPad
- - How to Change the Voice of ChatGPT on iPhone, Mac, iPad
- - sysmond on Mac Using High CPU? Here’s the Likely Reason & How to Fix It
- - How to Install VMWare Tools in Windows on VMWare Fusion for Mac
- - How to Factory Reset Mac (MacOS Sonoma & Ventura)
- - How to Fix the Apple Watch Squiggly Line Screen
- - What Does the Number Badge Mean on Microsoft Edge Icon?
- - How to Hide iPhone Keyboard When It’s Covering Buttons & Won’t Go Away

About OSXDaily | Contact Us | Privacy Policy | Sitemap
This website is unrelated to Apple Inc
All trademarks and copyrights on this website are property of their respective owners.
© 2024 OS X Daily. All Rights Reserved. Reproduction without explicit permission is prohibited.
Freelance iOS, macOS, Apple Watch, and Apple TV Developer
Web inspector on ios devices and simulators.
Want to keep up to date? Sign up to my free newsletter which will give you exclusive updates on all of my projects along with early access to future apps.
Over the past few weeks I’ve worked on a number of projects that have necessitated me working with HTML and JavaScript be that via Safari on iOS, an SFSafariViewController, or in an embedded WKWebView. In all of these cases, I’ve needed to dive into the DOM to see what styles are being applied to certain elements or dig into a JavaScript Console to work out why some code isn’t working. On desktop, this is trivial as Safari has a Web Inspector panel built in similar to other browsers. It turns out it is also trivial on mobile as the exact same tool can be used with both iOS simulators and physical devices.
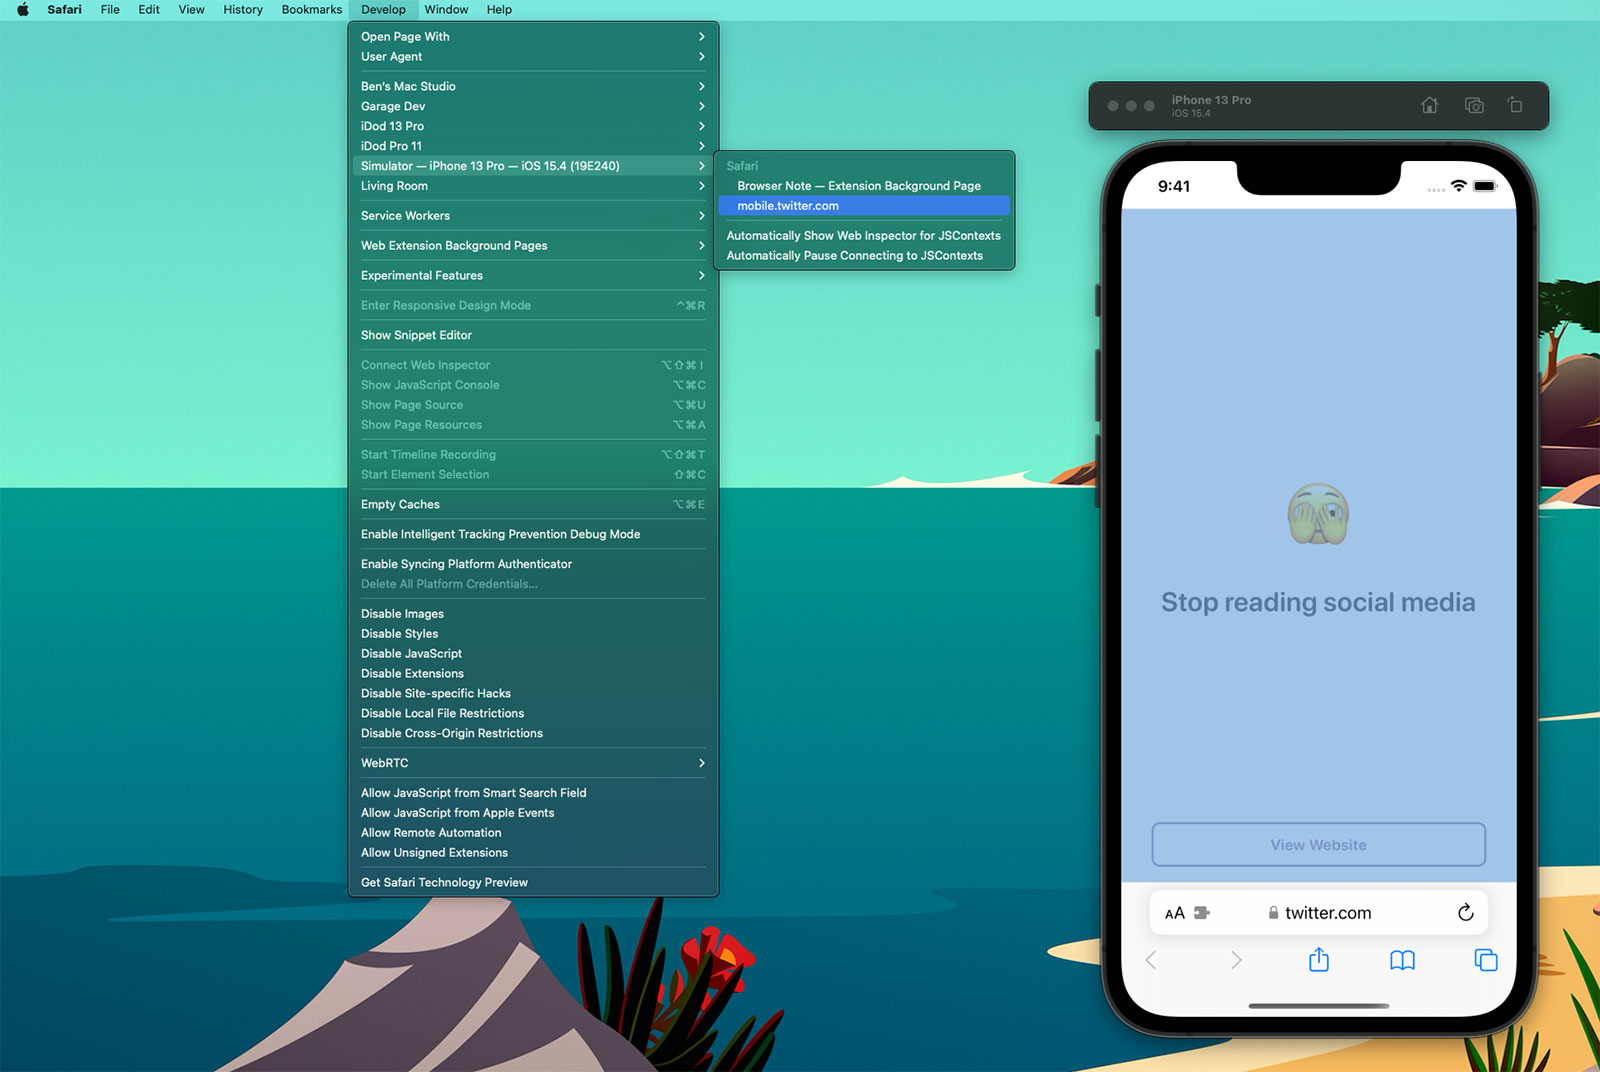
If you select the ‘Develop’ tab from the menu bar of Safari on macOS, you’ll see a list of all of your connected devices and actively running simulators 1 . Drilling into this will then show all of the active web instances you can interact with; notice how the content within Safari has highlighted blue within the Simulator as I’ve moused over the twitter.com web instance above. When you click, a web inspector panel is then produced which allows you to make all the usual interrogations and changes you can within desktop Safari such as interacting with the console or changing CSS values of elements to see how they would look in realtime.
Here’s an example using a WKWebView within one of my client projects, Yabla Spanish :
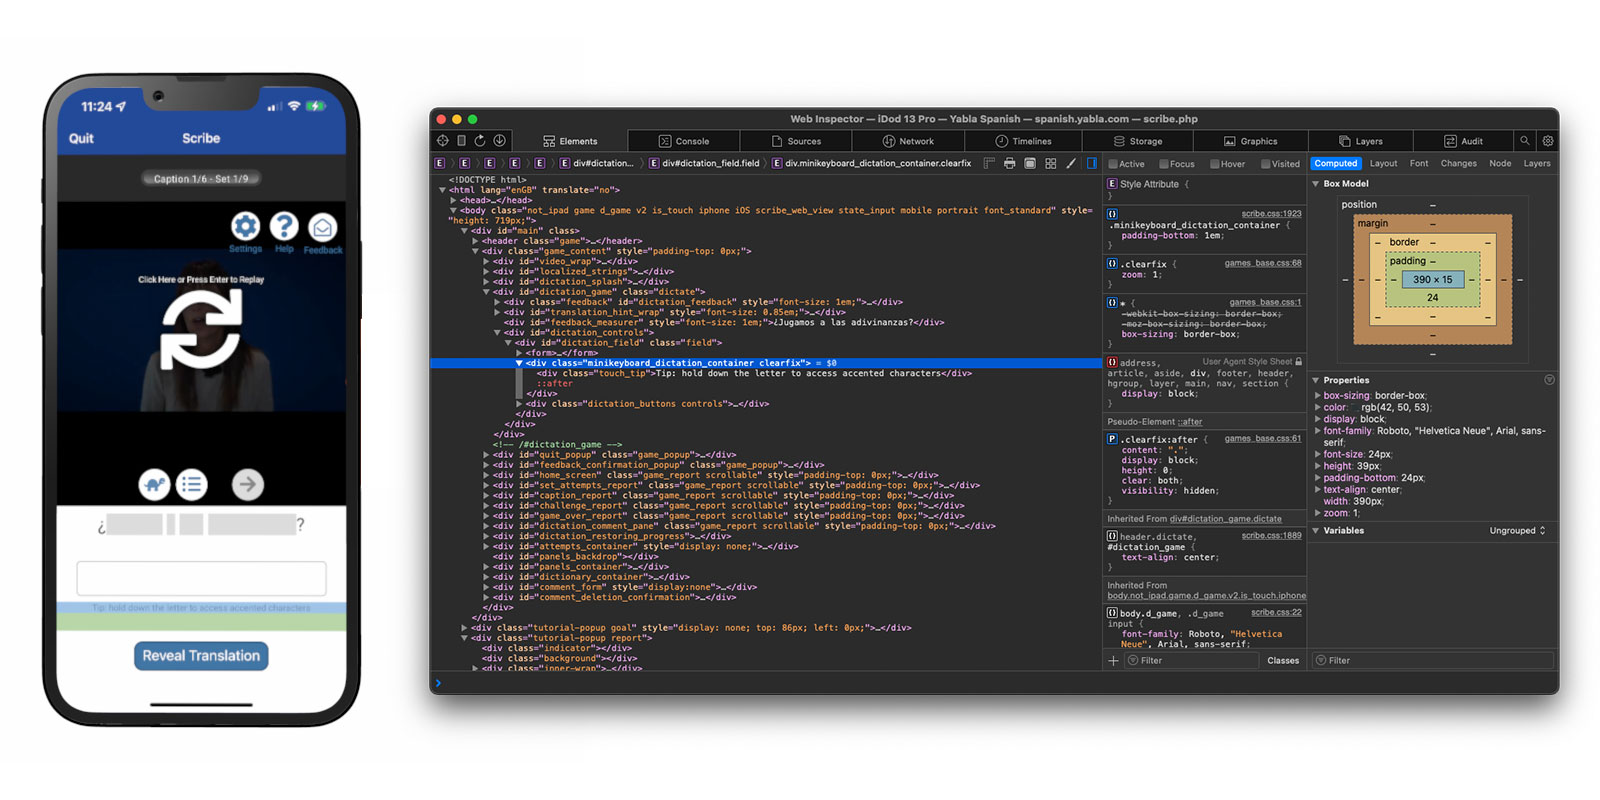
Discovering that simulators and devices could be interacted with in this way has been a huge timesaver for me. Whilst developing Browser Note , I was constantly needing to tweak CSS values and investigate the current state of the DOM as websites have various tricks to try and make ads or cookie notices appear on top of all content (and the note needed to be on top at all times - you should totally take a look at Browser Note whilst you’re here). In doing this, I was then able to put this knowledge to use on no less than 3 client projects in the past month; this validates my theory that by working on your own side projects you can improve your efficiency when it comes to work projects.
There are a few caveats to be aware of when using the Web Inspector with an iOS device or simulator:
- If you want to use this on an actual device you’ll first need to enable the Web Inspector on iOS. To do this, go to the Settings app and then Safari > Advanced and toggle the Web Inspector on.
- Whilst the Web Inspector can interrogate WKWebView, it can only do this for apps you are running via Xcode. You cannot look at the WKWebView of apps you did not create nor of your own apps from TestFlight / the App Store. However, you can inspect debug builds installed via Xcode even if the debugger is not active (i.e. you build to the device then quit Xcode).
- Conversely, you can use the Web Inspector with any SFSafariViewController even if it is not in your own app.
- Whilst it is still possible to submit apps that use UIWebView, the web inspector will not work with them; it needs to be WKWebView .
- This also works for AppKit, SwiftUI, and Catalyst apps on macOS.
I use an “iDod” naming prefix for all of my devices; a throwback pun to my first Apple product, the iPod. ↩︎
Safari User Guide
- Get started
- Go to a website
- Bookmark webpages to revisit
- See your favorite websites
- Use tabs for webpages
- Import bookmarks and passwords
- Pay with Apple Pay
- Autofill credit card info
- View links from friends
- Keep a Reading List
- Hide ads when reading
- Translate a webpage
- Download items from the web
- Add passes to Wallet
- Save part or all of a webpage
- Print or create a PDF of a webpage
- Interact with text in a picture
- Change your homepage
- Customize a start page
- Create a profile
- Block pop-ups
- Make Safari your default web browser
- Hide your email address
- Manage cookies
- Clear your browsing history
- Browse privately
- Prevent cross-site tracking
- See who tried to track you
- Change Safari settings
- Keyboard and other shortcuts
Use the developer tools in the Develop menu in Safari on Mac
If you’re a web developer, the Safari Develop menu provides tools you can use to make sure your website works well with all standards-based web browsers.
If you don’t see the Develop menu in the menu bar , choose Safari > Settings, click Advanced, then select “Show features for web developers.”
Open Safari for me
How to quickly translate web pages in Safari on iOS and iPadOS
Easily translate web pages in Safari for iPhone and iPad.
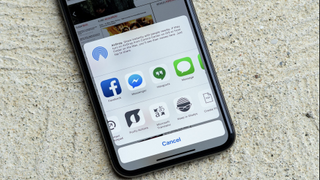
What you'll need
- How to translate web pages in Safari in iOS 16 and iPadOS 16
How to activate the Microsoft Translator extension in Safari
How to translate a web page on iphone with microsoft translator.
If you're running iOS 17 , Safari now comes with a translation feature baked into the browser, making it easier than ever to translate a web page on iPhone and iPad.
Once enabled, text is translated in-line on the webpage that you're viewing. It's a handy tool if you want to read websites that are written in different languages, and it's available right in the address bar in Safari.
With this in mind, here's how you can translate web pages in Safari on iPhone and iPad.

iPhone 15 Pro, iPad 9th gen, and Apple Watch SE for free at Verizon
Choose Verizon's Unlimited Ultimate Plan and trade in an old device to get Apple's iPhone 15 Pro , iPad 9 , and an Apple Watch SE for absolutely nothing. A fantastic deal if you're looking to upgrade all of your Apple devices.

iPad Pro M4 | $999
The brand-new iPad Pro M4 is the best tablet Apple has ever released. With an OLED display and the fastest chip Apple has ever made, this is a very powerful iPad.
How to translate a web page on iPhone in iOS 16 and iPadOS 16
In iOS 15 and later, the ability to translate a web page's language to your native language is now a built-in part of Safari. As such, you no longer need a third-party app to translate. Here's how to use built-in language translation in Safari in iOS 14, iOS 15, and later.
- Tap the action button on the left side of the address bar while visiting a site that you need to translate. The button looks like two A's next to each other.
- Tap Translate to [Your Device Language] .

- Tap Enable Translation if prompted.
Your page will then be translated into the primary language that you've set on your device. If you want to revert back to the page's original language, take the following steps.
- Tap the translate button in the Safari address bar. It takes the place of the standard action button on the left side of the address bar.
- Tap View Original .

The page will revert to its original language.
If you're running a version of iOS 13 or earlier on your device, then a third-party app with a translation extension is what you'll want to use. Microsoft's Translator extension is an excellent tool for the task, as it translates the web page in place when activated.
Master your iPhone in minutes
iMore offers spot-on advice and guidance from our team of experts, with decades of Apple device experience to lean on. Learn more with iMore!

Microsoft Translator
Microsoft Translator is a great third-party solution for translating web pages, and its translations take place in-line on the web, rather than taking you to another, translated version of the page like some other apps.
Once you've got it downloaded, you can set up the action extension for translation web pages.
- Open Safari on your iPhone or iPad.
- While viewing a web page, tap the share button .
- Scroll to the left on the bottom row of icons.

- Tap the More button.
- Turn the switch next to Microsoft Translator to the green 'on' position.
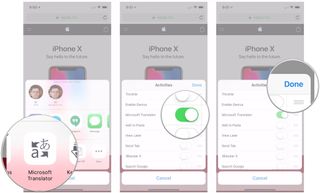
Now that you have the app installed, you can use it in Safari from the share menu.
- Head to the web page that you want to translate.
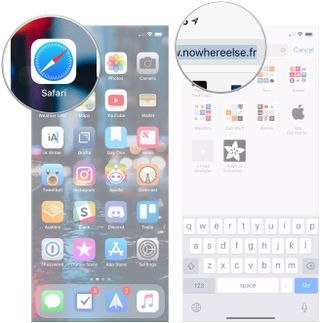
- Tap the share button at the bottom of the display.
- Tap the Microsoft Translator button. The extension will then translate the entire page for you.

Joseph Keller is the former Editor in Chief of iMore. An Apple user for almost 20 years, he spends his time learning the ins and outs of iOS and macOS, always finding ways of getting the most out of his iPhone, iPad, Apple Watch, and Mac.
Apple just dropped another hint at iOS 18's massive Siri upgrade — WWDC 24 logo latest sign of the change we've all been waiting for
Here are the five biggest changes coming to iPhone with iOS 18
Get the latest Apple TV 4K streamer for just $89.99 while this rare deal lasts — and it might not stick around for long
- Annie_M Thank you for this... it's good to know. Reply
- View All 1 Comment
Most Popular
- 2 Apple's AirPods Conversation Awareness needs this AI upgrade
- 3 The thinnest bezels ever? Another iPhone 16 Pro rumor suggests Apple might be focusing on all the wrong things for its next flagship release
- 4 Apple just dropped another hint at iOS 18's massive Siri upgrade
- 5 Spotify Premium is now more expensive than Apple Music — But is it worth the extra?
Safari Web Inspector Guide
- Table of Contents
- Jump To…
- Download Sample Code
Retired Document
Important: This document no longer represents the most current version of Safari developer tools. Links to downloads and other resources may no longer be valid. For new documentation on Safari Web Inspector, please visit Safari Developer Help .
The Console
The console offers a way to inspect and debug your webpages. Think of it as the Terminal of your web content. The console has access to the DOM and JavaScript of the open page. Use the console as a tool to modify your web content via interactive commands and as a teaching aid to expand your knowledge of JavaScript. Because an object’s methods and properties autocomplete as you type, you can see all available functions that are valid in Safari.
For example, open the console and type $$(‘p’)[1] . ( $$ is shorthand for document.querySelectorAll —see more shorthand commands in Table 5-1 .) Because this paragraph is the second instance of the p element on this page ( [1] in a 0-based index), the node represents this paragraph. As you hover over the node, its position on the page is visibly highlighted. You can expand the node to see its contents, and even press Command-C to copy it to your clipboard.
Command-Line API
You can inspect HTML nodes and JavaScript objects in more detail by using the console commands listed in Table 5-1 . Type the command-line APIs interactively within the console.
If your scripts share the same function name as a Command-Line API function, the function in your scripts takes precedence.
The functions listed in Table 5-1 are regular JavaScript functions that are part of the Web Inspector environment. That means you can use them as you would any JavaScript function. For example, you can assign a chain of Console API commands to a variable to create a useful shorthand. Listing 5-1 shows how you can quickly see all event types attached to the selected node.
Listing 5-1 Find the events attached to this element
After defining this function, inspect the magnifying glass in the top-right corner of this webpage, and type evs() in the console. An array containing the string “click” is returned, because there is a click event listener attached to that element.
Of course, these functions shouldn’t be included in your website’s JavaScript files because they are not available in the browser environment. Only use these functions in the Web Inspector console. Console functions you can include in your scripts are described in Console API .
Console API
You can output messages to the console, add markers to the timeline, and control the debugger directly from your scripts by using the commands listed in Table 5-2 .
Copyright © 2018 Apple Inc. All Rights Reserved. Terms of Use | Privacy Policy | Updated: 2018-02-07

IMAGES
VIDEO
COMMENTS
Here's how: Open the iPhone Settings menu. On an iPhone with an early version of iOS, access the Debug Console through Settings > Safari > Developer > Debug Console. When Safari on the iPhone detects CSS, HTML, and JavaScript errors, details of each display in the debugger. Scroll down and tap Safari to open the screen that contains everything ...
Overview. Web Inspector helps you inspect all the resources and activity on webpages, Service Workers, Mac and Home Screen web apps, and JavaScript running inside your applications, making development more efficient across Apple platforms. The clean, unified design puts each core function in a separate tab, which you can rearrange to fit your ...
Web development tools. Apple has brought its expertise in development tools to the web. Safari includes Web Inspector, a powerful tool that makes it easy to modify, debug, and optimize websites for peak performance and compatibility on both platforms. And with Responsive Design Mode, you can preview your web pages in various screen sizes ...
Enabling inspecting your device from a connected Mac. Before you can connect your device to a Mac to inspect it, you must allow the device to be inspected. Open the Settings app. Go to Safari. Scroll down to Advanced. Enable the Web Inspector toggle. Now, connect the device to your Mac using a cable. In Safari, the device will appear in the ...
Connect the iOS device to the machine. Enable the Web-Inspector option. To do so: Go to Settings > Safari > Scroll down to the bottom > Open Advanced Menu>. Turn on Web Inspector. Open the desired web page to debug or preview on your mobile Safari browser. Once done, enable the Develop menu on the Mac device.
Touch the On button to activate the Debug Console. After the Debug Console is enabled, Safari reports any errors it encounters when accessing a website. At the top of every web page, just under the address bar, the Debug Console reports any HTML, JavaScript, or CSS errors.
On your Mac, in Safari, click the Develop menu. Near the top of the menu you should see your iPad or iPhone listed. Hover over your device in the menu and you'll see Safari with each tab listed below. Click the one you want to debug. The Web Inspector should then appear, now debug it: Elements, Console, Sources, Network, all of it should work!
Enable Web Inspector on iOS : Open the Settings app on your iPhone or iPad. Scroll down and tap Safari. Scroll to the bottom of the page and tap Advanced. Tap the toggle next to Web Inspector to the On position. Enable Safari Developer Mode on Mac : Open Safari on your Mac. Click Safari in the top left corner of your Menu Bar.
Once the Safari console is open, you can now see the interaction between the console and the DOM on your mobile web browser. You can see that it works similarly to the Chrome Console. When you open the inspector and hover over an HTML element, that element will be highlighted in the DOM.
There are two ways to inspect an element in Safari Developer Tools: In the browser window, right-click on any element and select 'Inspect Element'. In the menu toolbar, select Develop > Show Web Inspector (or use the keyboard shortcut Option-Command-I ). This will display the current DOM of the page.
32. plug iphone into computer. settings > safari > advanced > web inspector (turn on) open safari on your computer. run your web app on your iphone in the safari browser. on your computer in safari, go to Develop -> "name of your iphone" and then find the correct tab under "Safari" opens Web Inspector. doing these steps enables the safari debug ...
Open the Settings app on your iPhoned. 2. Go to Safari. 3. Scroll down to the bottom and tap the Advanced button. 4. On the Advanced settings page, enable the toggle for Web Inspector. This is all you have to do to enable the Web Inspector tool on iOS.
Overview. Safari includes features and tools to help you inspect, debug, and test web content in Safari, in other apps, and on other devices including iPhone, iPad, Apple Vision Pro, as well as Apple TV for inspecting JavaScript and TVML. Features like Web Inspector in Safari on macOS let you inspect and experiment with the layout of your ...
Safari for iOS includes an optional debug console to help web developers track down and resolve issues with webpages on iPhone and iPad. Even better, with the latest versions of iOS it actually uses the same Web Inspector that Safari on desktop does too, meaning if you connect the iPhone or iPad to the computer you can use the Safari debugging tools directly with your iOS or iPadOS device
Hover over the desired iPhone or iPad. Choose from two browsers - Safari and Chrome. Select Safari. Click on the Safari browser, and a new Safari session will be initiated on a real iPhone 11 pro. Once the session begins, click on the DevTools from the floating menu, as shown in the image below.
Before iOS 6, the iPhone's Safari web browser had a built-in Debug Console that developers used to track down web page defects. If you have an iPhone running an early version of iOS, you can access the Debug Console through Settings > Safari > Developer > Debug Console. Whenever Safari on the iPhone detects CSS, HTML, and JavaScript errors ...
There are a few caveats to be aware of when using the Web Inspector with an iOS device or simulator: If you want to use this on an actual device you'll first need to enable the Web Inspector on iOS. To do this, go to the Settings app and then Safari > Advanced and toggle the Web Inspector on. Whilst the Web Inspector can interrogate WKWebView ...
New iOS 6 Safari comes with Web Inspector feature which allows to connect to it from your desktop Safari via USB cable. It then allows you to debug pages opened in iOS Safari from your desktop. ... Eruda Mobile Console - Basically add the following bookmarklet to your mobile device: javascript:(function { var script = document.createElement ...
The name of your device appears in the Develop menu of Safari. Alternately, you can use iOS Simulator to take advantage of Web Inspector's debugging capabilities, which comes free with Xcode from the Mac App Store. Use the same instructions, To enable Web Inspector on iOS, from within the iOS Simulator's Settings app.
If you're a web developer, the Safari Develop menu provides tools you can use to make sure your website works well with all standards-based web browsers. If you don't see the Develop menu in the menu bar, choose Safari > Settings, click Advanced, then select "Show features for web developers.". Open Safari for me.
Safari for developers. Safari is the best way to experience the internet on iPhone, iPad, and Mac. Thanks to blazing-fast performance and industry-leading energy efficiency, millions of users enjoy exploring the web with Safari. Take advantage of powerful new features, advanced developer tools, and cutting-edge technologies in Safari to deliver ...
How to translate a web page on iPhone in iOS 16 and iPadOS 16. In iOS 15 and later, the ability to translate a web page's language to your native language is now a built-in part of Safari. As such, you no longer need a third-party app to translate. Here's how to use built-in language translation in Safari in iOS 14, iOS 15, and later.
Or is it "just" a website (not installed, nor added to home screen). At the moment it seems only Web Apps that are "added to the homescreen" (on iOS >=16.4) can receive Web Push notifications. "Normal apps" (=wrapped web apps using something like pwabuilder) cannot receive Web Push notifications at the moment. -
Safari Web Inspector Guide ... Think of it as the Terminal of your web content. The console has access to the DOM and JavaScript of the open page. Use the console as a tool to modify your web content via interactive commands and as a teaching aid to expand your knowledge of JavaScript. Because an object's methods and properties autocomplete ...