Efficient Cyclist


From Past to Present: Average Tour de France Speeds
The Tour de France, the world’s most prestigious and grueling cycling race, has captivated audiences for over a century. Spanning three weeks and covering thousands of kilometers, the Tour de France is a true test of endurance, strategy, and sheer athletic ability. One of the most intriguing aspects of this iconic race is the average speed achieved by the peloton over the years.
The overall trend of winner’s average speed has steadily increased during the Tour’s history. In this article, I explore the factors that have contributed to its continual increase.

Table of Contents
The Early Years: Humble Beginnings
The Tour de France was first held in 1903, and the average speeds achieved in those early editions were significantly lower compared to modern standards. Factors such as the heavy steel bicycles, rough road conditions, and limited technological advancements contributed to relatively slow average speeds. For many of those early years, average speeds hovered around 25 kilometers per hour, with individual stages often taking several hours to complete.
The winner of the very first 1903 Tour de France achieved only 25.7 km/h average speed, while the slowest race was just 24.1 km/h in 1919.
In the early years of the Tour, the sport was very much one of breakaways. Race reports suggest that there were hardly any pelotons back then, which would have increased the speed considerably. Being in the front allowed leading riders the clearest view ahead, and would ensure that, after being delayed by a mechanical or a puncture (very common back then), they would have other strong riders around them. And there was presumably quite a lot of time spent fixing the mechanical issues, which was included in the total time.
Until 1910, there were no high mountains in the Tour, so you can imagine the average speeds would have been even lower if they had to climb, too.
Advancements in Technology
Advancements in technology have had a profound impact on cycling, revolutionizing the sport and pushing the boundaries of what is possible in terms of speed.
Lightweight equipment
The development of lightweight bicycles has been a game-changer. With the introduction of materials like carbon fiber, bike frames have become significantly lighter, while maintaining strength and rigidity. This reduction in weight allows riders to accelerate more effortlessly and tackle climbs with greater ease.
Aerodynamics
Aerodynamics have also become a crucial focus in bike design. By utilizing wind tunnel testing and computational fluid dynamics, engineers can optimize the shape of bike frames, wheels, and other components to minimize drag. This results in more streamlined and efficient designs, reducing the resistance cyclists face when riding at high speeds. The integration of components, such as internal cable routing and hidden brakes, further improves the aerodynamic performance of modern bicycles.
It’s not only about bikes, either. Cycling clothing, helmets, shoes etc. also have a huge influence on aerodynamics .
Gear systems have seen significant advancements as well. The derailleur was only introduced in the Tour de France in 1937 – it was all single-speed before then. The Tour’s founder Henri Desgrange has famously said “I still feel that variable gears are only for people over 45. Isn’t it better to triumph by the strength of your muscles than by the artifice of a derailer?”
The introduction of index shifting has revolutionized gear changes, providing precise and instantaneous shifts at the touch of a button. This allows riders to maintain their momentum and power output, resulting in smoother transitions between gears.
Then came electronic shifting. Its impact is far less than that of indexed shifting but it still adds further improvements: It eliminates the need for manual adjustments and reduces the risk of misshifting, providing riders with more confidence and focus on their performance.
Wheels, an essential component of a bike, have undergone substantial improvements. Up until 1934 bicycle rims were all wooden – previously metal rims had been banned. Wooden rims tend to have more flex, which saps power.
Aluminum rims were standard for more than half a century; carbon fiber wheels only became mainstream in the pro cycling in the late 90s to early 00s. Carbon fiber wheels are lighter, resulting in improved climbing speeds. Their lightweight construction also allows for the creation of deep aerodynamic profiles, which can accommodate more material without adding substantial weight. Such wheels are standard on flat stages, as they reduce drag.
Then there are improvements in tires, offering reduced rolling resistance, which can make a significant impact, especially on the climbs, when aerodynamic drag matters less.
Moreover, the progress made in hub designs and bearing technologies has significantly reduced friction, resulting in improved overall efficiency of wheelsets.
Data-driven performance
Data-driven performance in pro cycling has revolutionized the way teams and riders approach training, racing, and performance analysis.
In the old days, cycling heavily depended on subjectivity and intuition, with limited access to measurable metrics. But with the advent of advanced technologies and the proliferation of cycling data sensors, the sport has undergone a significant transformation. Nowadays, riders and teams have an abundance of data at their disposal, encompassing metrics such as power output, heart rate, cadence, speed, and even muscle monitoring. This wealth of data is gathered during training rides, races, and even within controlled laboratory settings.
This helps coaches, and riders gain deep insights into performance, identify strengths and weaknesses, optimize training programs, and make strategic decisions during races. The result is more precise and individualized training plans, race strategies, and equipment choices, leading to improved performance and thus, higher speeds.
The understanding of sports science, training methodologies, and nutrition has also played a vital role. Athletes now benefit from access to state-of-the-art training programs, scientific testing, and advanced nutritional strategies aimed at optimizing their performance. The focus on recovery, specialized training camps, and individualized coaching has propelled riders to attain heightened levels of physical and mental readiness, ultimately resulting in faster average speeds.
Race Tactics and Strategies
Race tactics and strategies have also evolved over time, leading to faster racing. The introduction of team-based racing, with riders working together to protect their leaders and create tactical advantages, has significantly influenced the pace of the peloton.
This evolution took the better part of the century: from basically solo breakaway riding in the early 1900s to ‘one-man teams’, such as in Bartali/Coppi and later Mercx, times, to full-fledged team tactics from the late 20th century onwards. This meant more coordinated team efforts, for example utilizing domestiques to support their leaders in the mountains, providing pacing, protection, and strategic assistance. That allows leaders to save effort for when it really matters, and ride at higher speeds.
Route distance
The race distance has trended down throughout the 20th century, and I wonder if that may have contributed to the increases in average speeds. See the graph below. (The three outliers are the very first three years of the Tour.)

Similar Posts

Overview on Bike Drivetrain Efficiency
It’s no secret that bicycle drivetrain efficiency is crucial for optimizing power transfer and enhancing performance. It lets you convert pedalling force into forward motion with as small a loss as possible. An efficient drivetrain minimizes energy losses, enabling riders to achieve faster speeds with less effort. Components such as the chain, crankset, cassette, derailleurs,…

The Evolution of Bicycle Brakes
Generally brakes are not the first thing that comes to mind when talking about bikes. Typically we like to boast about stuff that gives us speed, looks good or is comfortable: the frame, the wheels, the handlebar. Aerodynamics. Rolling resistance. Drivetrain friction. But stopping isn’t as sexy, though it saves our lives. Let’s see what…

Can Listening to Music Enhance your Cycling Performance?
Can the rhythm of music harmonize with the cadence of my pedal and somehow elevate my cycling performance? Here I’ll explore the science behind the connection between music and cycling performance. I’ll delve into the contrasting effects of music on aerobic and anaerobic performance, explore how music influences distance perception, and examine the impact of…

Improve Aerodynamics with the Right Cycling Apparel
Cycling is a sport where every second counts. In the pursuit of optimal performance, athletes and enthusiasts alike seek ways to gain that competitive edge. Among the various factors that influence cycling performance, aerodynamics is by far the most important one. At speeds over 10 mph (16 kph), aerodynamic (aero) drag becomes the primary force…

Riding Uphill: Efficiency of Seated and Standing Cycling
When it comes to climbing, there are two primary body positions: seated and standing. Often, the decision of whether to get out of the saddle is made instinctively, trying to provide some rest to fatigued muscle groups or to add some explosive power. But which is more efficient? Let’s explore different aspects of seated vs…

When to replace the bicycle chain?
Learn how to keep your bicycle running smoothly while saving money along the way. By understanding how to check your bike chain for wear, you can avoid unexpected breakdowns, ensure optimal performance, and stretch your budget. Here I explore the ins and outs of chain wear, its significance, and provide you with simple yet effective…
Leave a Reply Cancel reply
Your email address will not be published. Required fields are marked *
Save my name, email, and website in this browser for the next time I comment.
What Is the Tour de France Average Speed?
We examine the average speed and other metrics of the world’s best cyclists. How would you stack up?
Gear-obsessed editors choose every product we review. We may earn commission if you buy from a link. How we test gear.
We all know that the pro cyclists that race in the men’s Tour de France are the best in the world. We also know that they’re fast— really fast. Have you ever wondered about the Tour de France average speed, though, and how you’d fare against a pro? Well, now you can see for yourself.
Average Time Trial Speed
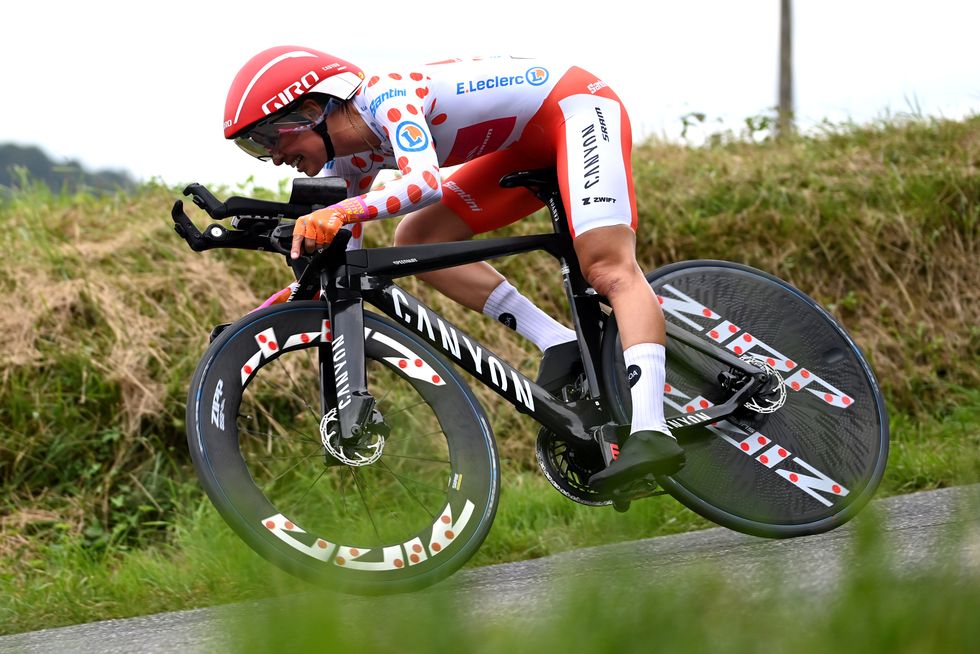
A Tour pro’s ability to produce more power for longer means that he would complete a 30K time trial about 20 minutes faster than the average rider. In other words, he’s really hammering.
Average Rider: 19 to 20 mph
Tour Pro: 29 to 31 mph
Average Speed on Flat Terrain
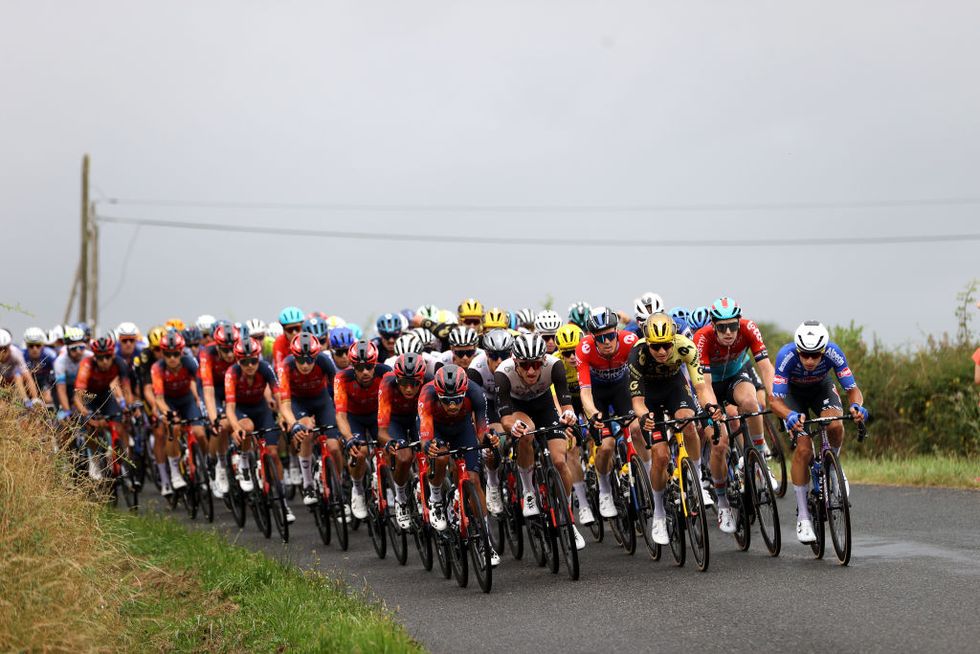
Even on flat land, a pro’s average speed in the Tour de France needs to be way up there in order to stay in the race. In fact, it’s usually about double that of an average rider.
Average Rider: 17 to 18 mph
Tour Pro: 25 to 28 mph
Maximum Sprint Power
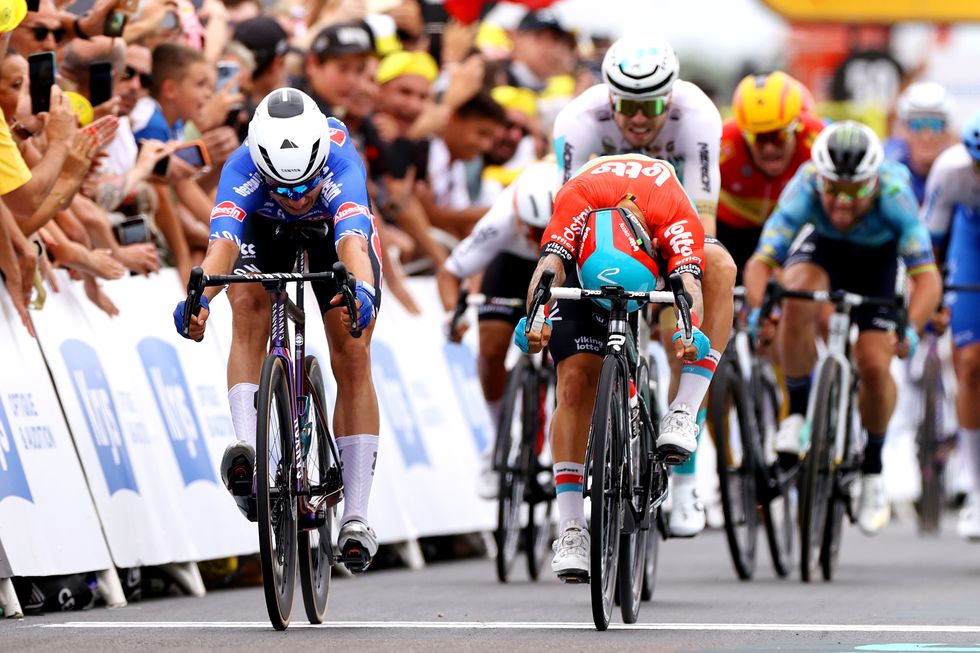
Sprinters generate incredible amounts of power in the final 15-second dash for the line. A rider like Mark Cavendish might hit 1,500 watts at the end of a flat field sprint.
Average Rider: 600 to 800 watts
Tour Pro: 1,200 to 1,400 watts
Average Speed Over Cobblestones
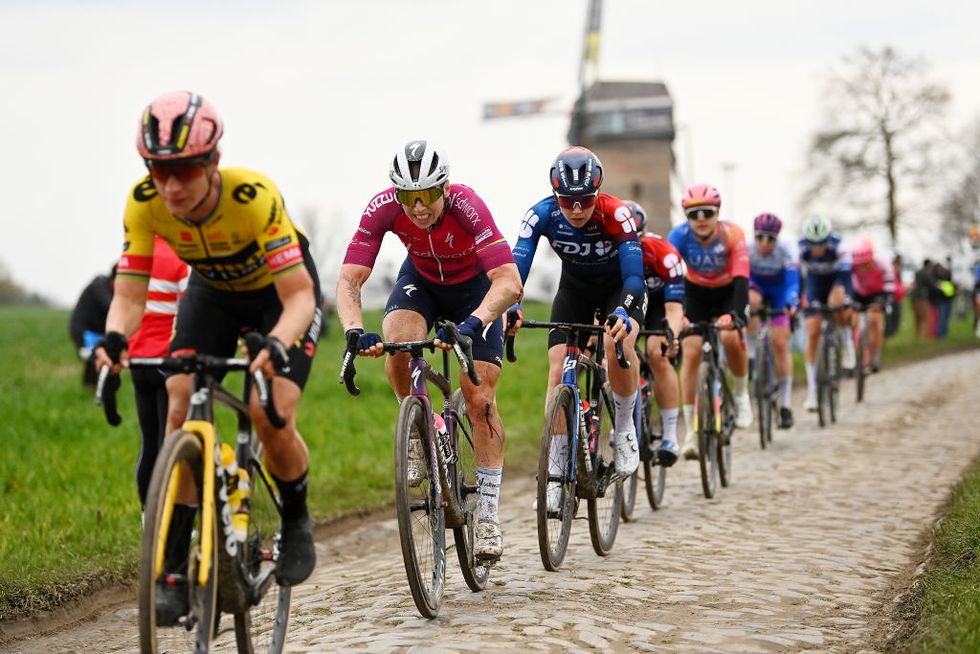
The Tour de France often features at least one section of cobblestones , known locally as pavé (though sometimes that’s exchanged for a stretch of gravel) . On a tough section, pros can average an incredible 22 to 24 mph.
Average Rider: 14 to 16 mph
Tour Pro: 22 to 24 mph
Average Resting Heart Rate
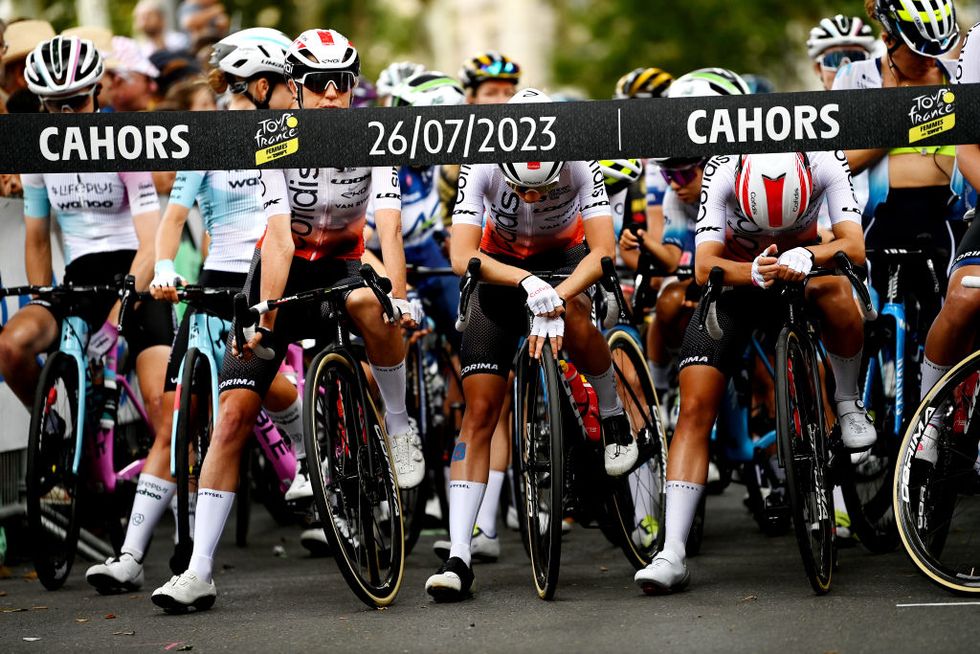
Team EF Education-EasyPost utilized WHOOP straps during the 2020 Tour to collect detailed biometric data on the athletes 24/7 over the course of the entire 21-stage race, with remarkable results. The data showed an average resting heart rate of 42 beats per minute for the team before the start of the Tour, and 40 bpm after the first rest day. And in other jaw-dropping heart rate stats, team cyclist Neilson Powless spent 38 percent of Stage 8 that year in the 90- to 100-percent zone for his max heart rate .
Average Rider : 60 to 100 bmp
Tour Pro : ~40 bmp
Sandwiches Consumed
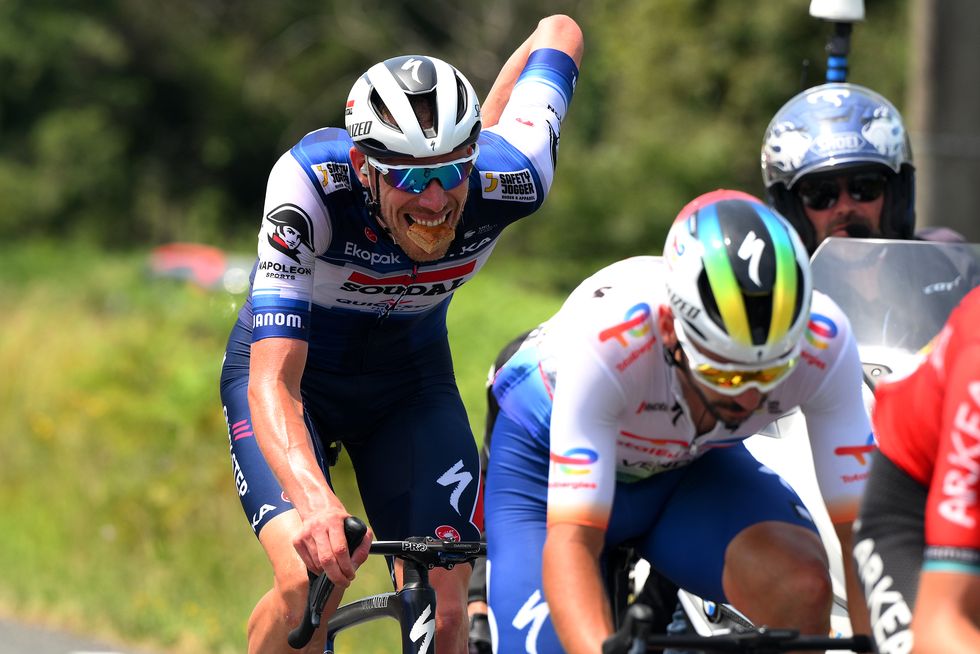
Soigneurs (all-purpose team assistants) make lunches for everyone on the team, including the staff. With about 12 to 15 staffers supporting a given team’s nine riders in France, that’s a lot of bread and a lot of sandwiches consumed over the course of three weeks.
Average Rider: 1 to 3 sandwiches
Tour Pro: ~30 sandwiches
Daily Bottles of Drink Mix Guzzled
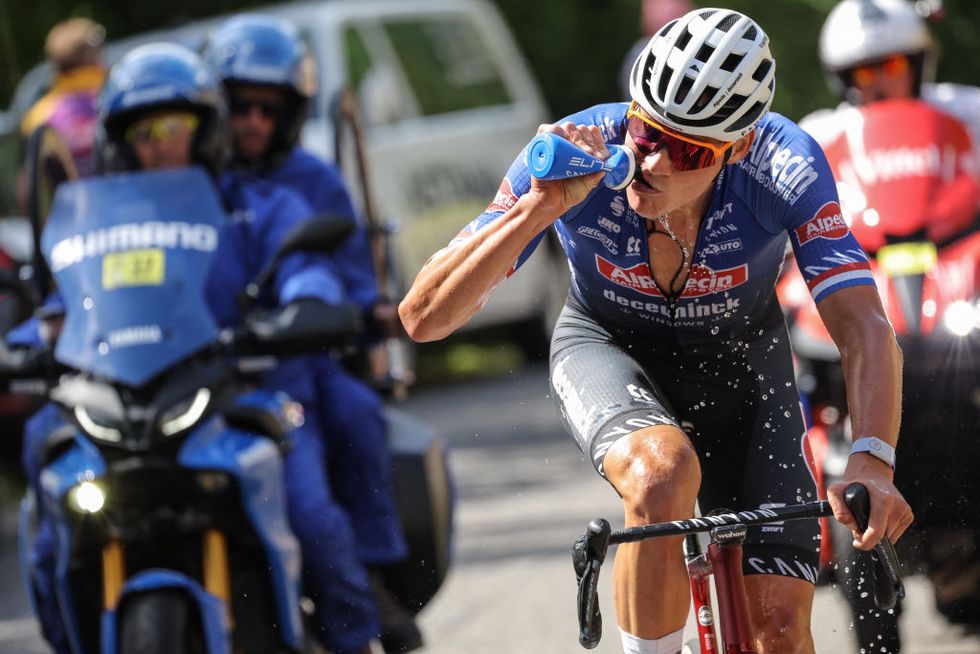
Depending on conditions, you might mix one or two bottles during one of your ride. A Tour de France soigneur might mix between 40 and 120 bottles for the team on each stage, which means an individual rider may throw back up to a dozen bottles or more.
Average Rider: 1 to 2
Tour Pro: 4 to 13
How Long it Takes to Climb the Col du Tourmalet
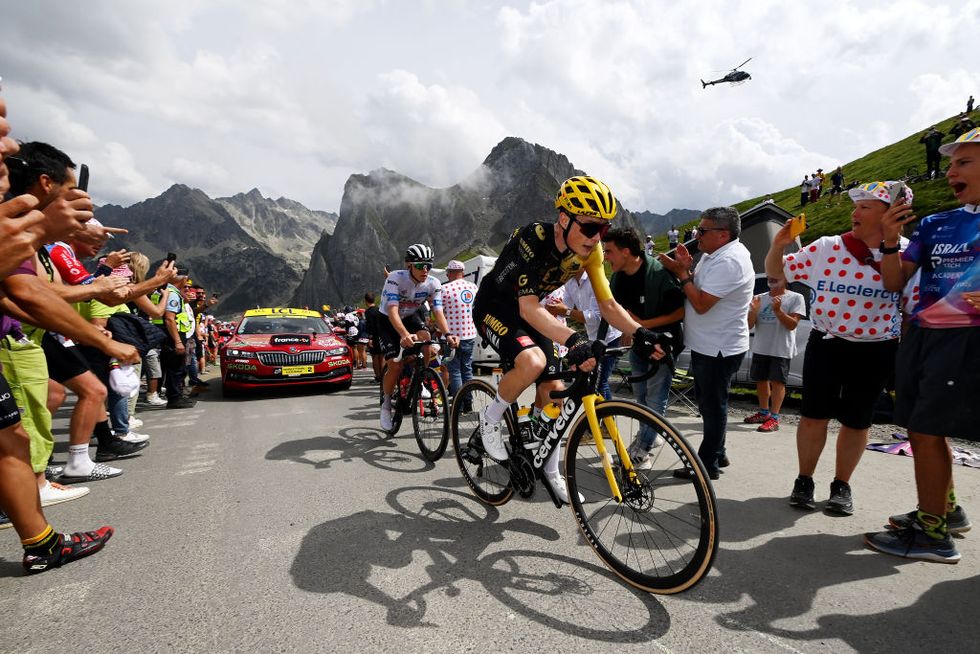
A pro climber will probably average about 350 to 375 watts on the climb up the Col du Tourmalet , one of the most famous climbs not just in the Tour, but in the entire cycling world. An ordinary rider would generate closer to 175 to 200—which means the Tour’s top climbers could ascend the Col nearly twice during your trip to the top.
Average Rider: 115 minutes
Tour Pro: 60 minutes
Bikes at Your Disposal
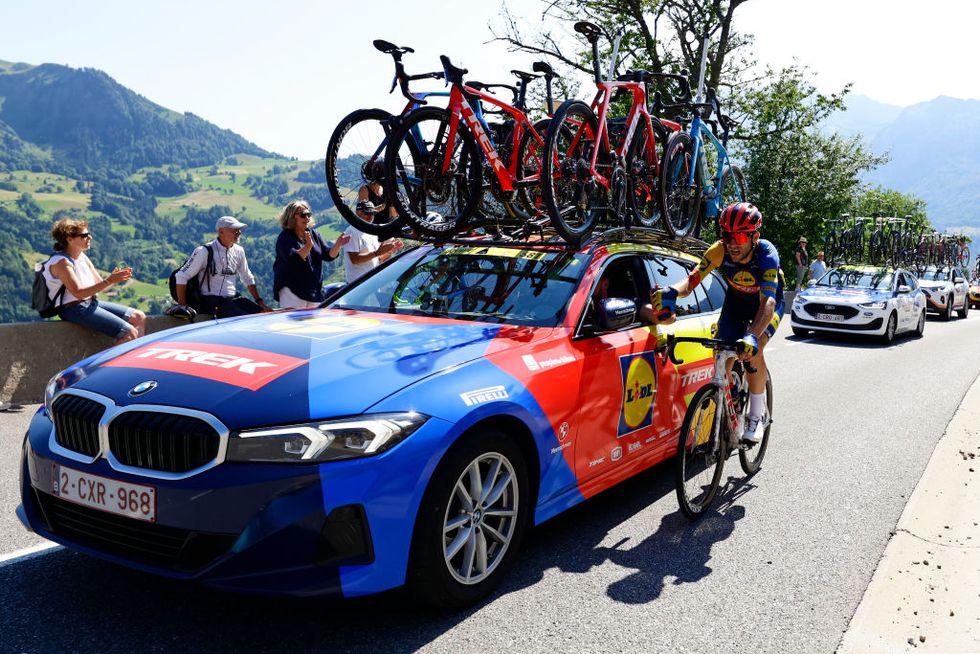
Depending on the rider and the team’s bike sponsor, most pros come to the Tour with an aero road bike for flatter stages, a climbing bike for the mountains, and a time-trial bike—not to mention spares. A general classification contender like Tadej Pogačar might have two or three of each.
Average Rider: 1 to 2 bikes
Tour Pro: 4 to 5 bikes
Since getting hooked on pro cycling while watching Lance Armstrong win the 1993 U.S. Pro Championship in Philadelphia, longtime Bicycling contributor Whit Yost has raced on Belgian cobbles, helped build a European pro team, and piloted that team from Malaysia to Mont Ventoux as an assistant director sportif. These days, he lives with his wife and son in Pennsylvania, spending his days serving as an assistant middle school principal and his nights playing Dungeons & Dragons.
.css-1t6om3g:before{width:1.75rem;height:1.75rem;margin:0 0.625rem -0.125rem 0;content:'';display:inline-block;-webkit-background-size:1.25rem;background-size:1.25rem;background-color:#F8D811;color:#000;background-repeat:no-repeat;-webkit-background-position:center;background-position:center;}.loaded .css-1t6om3g:before{background-image:url(/_assets/design-tokens/bicycling/static/images/chevron-design-element.c42d609.svg);} Cycling Tips
Cycling Tips for Older Riders

Allergies Ruining Your Ride? Here’s What to Do.
How to Avoid Bonking on Rides
5 Spring Training Mistakes
Not Reaching Your Goals? Here are Twelve Fixes.
How to Plan a Century Ride Route
Hill Repeats to Help You Dominate Mountain Races
How to Tell if You’re Ready for a Century Ride
15 Ways to Cycle Faster
How to Improve Cadence, According to Pros
How to Corner on the Bike, According to a Pro
- Race Previews
- Race Reports
- Race Photos
- Tips & Reviews
From Cobbles to Cubicles: Charting the Champions in the Roubaix Showers
Lily williams commits to human powered health until 2026, paris roubaix femmes 2024 race preview, elisa longo borghini sets sights on ardennes, skips paris-roubaix femmes, michaela drummond triumphs in inaugural région pays de la loire tour for women.

Email: [email protected]
The Evolution of Speed in the Tour de France
Mathew Mitchell
- Published on June 23, 2023
- in Men's Cycling

One of the most intriguing aspects of the Tour de France, beyond the dazzling victories and dramatic rivalries, is the evolution of the race’s average speed. Throughout its history, a multitude of factors have contributed to significant changes in the pace of the peloton, from technological advancements to race strategies. Let’s embark on a journey through the annals of the Tour to examine this transformation.
Table of Contents
The early editions
The early years of the Tour de France were characterised by lengthy stages often exceeding 400 km, rudimentary bicycles, and rugged roads, which resulted in a slow pace compared to today’s standards. Maurice Garin, the winner of the first Tour in 1903, achieved an average speed of 25.7 km/h, or approximately 16 mph. This may seem leisurely in the modern era, but given the conditions at the time, it was an impressive feat.
From these humble beginnings, the Tour’s average speed gradually increased as a result of several key factors. First and foremost, technological advancements played a significant role. Innovations such as derailleur gears, lighter frames made from aluminium or carbon fibre, aerodynamic clothing, and improvements in nutrition and training regimes all contributed to an upward trend in the peloton’s pace.
Fastest editions of the Tour de France
Among the fastest five editions of the Tour de France, the 2005 edition holds the record, with an astonishing average speed of 41.7 km/h, or approximately 25.9 mph, achieved by Lance Armstrong. However, it’s worth noting that Armstrong was later stripped of his titles due to doping . 2003, 2015, 2017, and 2019 Tours are also among the fastest, with average speeds ranging from 40.7 km/h (25.3 mph) to 40.9 km/h (25.4 mph). 2022’s Tour de France , won by Jonas Vingegaard, saw a new record set with an average speed of 42.03 km/h (26.1mph). That’s now a jump in the Tour de France average mph of 10mph since the inaugural edition in 1903.
Slowest editions of the Tour de France
Contrastingly, the slowest Tours de France typically date back to the early 20th century, primarily due to the aforementioned factors of longer stages, simpler bicycles, and challenging road conditions. The five slowest Tours were the editions from 1919, 1922, 1923, 1924, and 1926, with average speeds ranging from 24.1 km/h (15 mph) to 24.3 km/h (15.1 mph).

How and why the average speed has changed over time
It’s crucial to mention that strategies have also evolved significantly, with modern cycling teams employing more sophisticated tactics, optimising rider roles, and using advanced data analysis to gain an edge. The increased professionalism in the sport has contributed to the upward trend in speed.
Looking forward, it’s exciting to contemplate what could further increase the Tour de France’s average speed. Advancements in bicycle technology continue at a rapid pace, with continuous improvements in weight, aerodynamics, and power transfer. Similarly, cutting-edge training techniques, informed by genetics and sophisticated performance data, will continue to enable cyclists to push the boundaries of human endurance and speed.
Furthermore, improvements in road surfaces, planning of race routes, and even changes in race rules could have an impact. For example, more downhill finishes could raise the overall average speed, although the safety of riders would always be paramount.
In conclusion, the evolution of speed in the Tour de France is a fascinating aspect of this iconic race. From the early Tours, characterised by their gruelling pace and hardy riders, to the high-speed, technology-driven spectacle of today, the race continues to captivate and surprise. As we look to the future, we can expect the boundaries of speed, just like the race itself, to be continuously challenged and redefined.
Related Posts

LaGrange Cycling Classic
La vuelta españa femenina, giro d'italia, uci mtb fort william, tro bro leon (coupe de france), spin the district: college park, tour de hongrie, circuit de wallonie (exterioo cycling c, uci bmx freestyle wcup - fise, 4 jours de dunkerque, vuelta a burgos féminas, veenendaal classic (exterioo cycling cup, uci mtb bielsko bialia poland, uci bmx racing world championships, usa cycling pro road nationals, how does your average bike speed compare with tour de france pros, how does your average bike speed stack up with the fastest riders in the world.
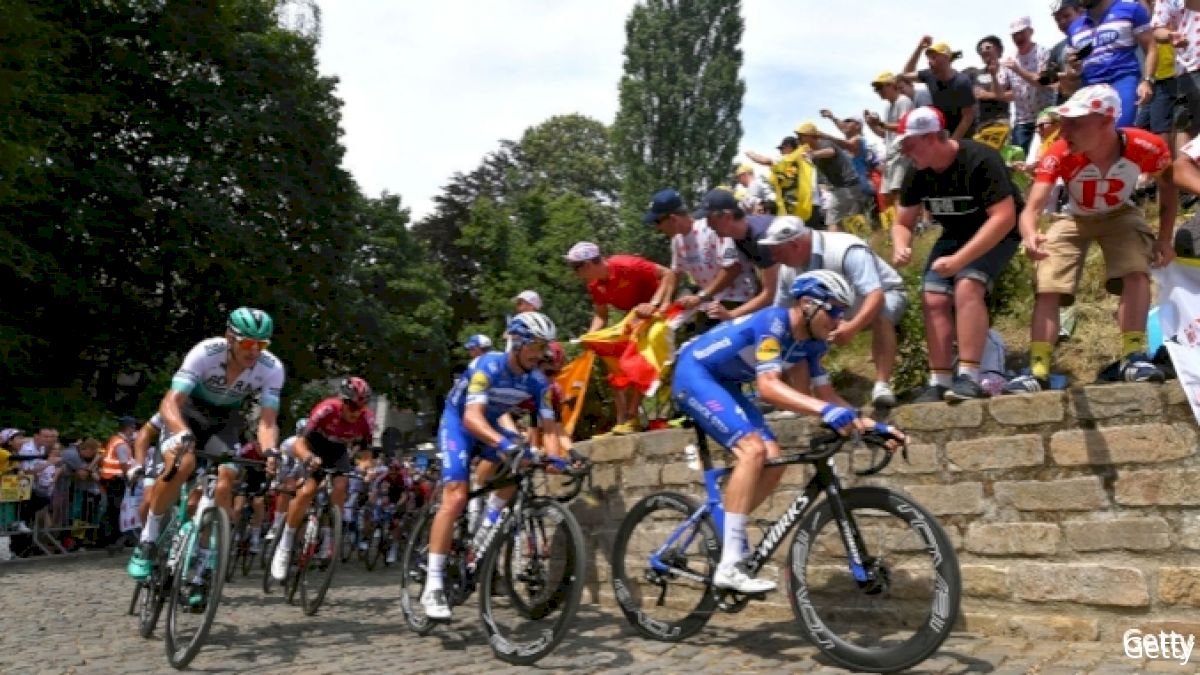
The Tour de France is the pinnacle when it comes to cycling competitions. It is one of the most-watched sporting events in the world and showcases some of the fittest athletes on the planet. The pure athleticism that is on display during this 21-day, 2,200-mile race is inspiring, enlivening, and these cyclists seem somewhat superhuman.
You might be asking yourself, “So how fast are they even going?” Or, “How do I compare to these athletes?” Luckily for you, with today’s technology, various metrics can be tracked during these cycling competitions, so everyone can compare their statistics to those of the pros. As with any metric, the speeds at which the Tour de France pros cycle will vary, but there are averages that have been tracked for decades now.
Here are a few of the average speeds for the professional cyclists that race in the Tour de France:
Average Speed on Flat Ground: 25-28 mph
The average speed for professional cyclists while traversing on flat terrain is 25-28 mph. The average amateur cyclist travels about 17-18 mph while on flat ground. For many pro athletes racing in the Tour de France, being able to maintain a fast speed on flat terrain allows them to simply stay competitive with the other athletes. It is in the climbing portions of the Tour de France that the best gain separation from the peloton.
Average Cobblestone Speed: 22-24 mph
In every Tour de France, there is at least one section of cobblestone that the cyclists must ride through -- sometimes, though, this is replaced with a stretch of gravel pavement. The small grooves in the road and uneven terrain can be difficult to tread, but these athletes still average an impressive 22-24 mph.
Average Speed Climbing: 12.8 mph
In the 2019 Tour de France, the athletes averaged 12.8 mph while trudging through the infamous climbs of the race. These athletes are literally cycling up and through the Pyrenees and Alps during this phase of the Tour de France, making for some of the most memorable moments of the Tour.
Fastest Recorded Speed: 63.1 mph
The fastest recorded speed of the Tour de France came from German Nils Politt while descending Col de Vars during stage 18 of the race. This was the second of four climbs in the stage, and Politt was the first-ever rider to break the 100 km/hr barrier by traveling at a speed of 101.5 km.hr on this descent.
Jonas Vingegaard Tour de France 2022 | Average Speed: 26.11
Jonas Vingegaard won his first Tour de France in 2022 on his second time participating in the tour. He spent the majority of the race trading leads back and forth with fan-favorite, Tadej Podacar. Vangegaard pushed through stage 19 and crossed the finish line 2 minutes and 43-second ahead of Podačar. After a total of 79 hours, 33 minutes, and 20 seconds on the bike, Jonas Vangegaard became the first Danish Tour de France champion since 1996
Tadej Pogačar Tour de France 2021 | Average Speed: 25.5 mph
Tadej Podačar was only 22 years old when he earned his second consecutive win at the Tour de France. Podačar made the victory look easy when he also earned a polka-dot jersey for top climber and white jersey for best young cyclist. His quick rise to first place had people consider him one of the most exceptional young cyclists the Tour de France had seen in years. He finished the race in 82 hours, 56 minutes and 36 seconds.
Tadej Pogačar Tour de France 2020 | Average Speed: 24.77
Tadej Podačar for UAE Team Emirates shocked fans at his 2020 Tour de France debut. At 21 years old he managed to break all expectations and snatch a victory from Primoz Roglic, who was expected to cruise to a first-place finish. In the final stage of the tour, Podačar sped through a 57-second deficit and earned his first yellow jersey, becoming the youngest Tour de France Winner in 111 years.
Egan Bernal Tour de France 2019 | Average Speed: 25.2 mph
The 2019 Tour de France winner, Egan Bernal of Colombia, averaged 25.2 mph. He is the first Latin American to ever win the Tour de France. At age 22, he is also the youngest Tour de France winner in modern racing history. He finished the 2,091.4 mile race in exactly 82 hours and 57 minutes.
While not every cyclist has aspirations of ever racing in the Tour de France, having these metrics is a fun way for everyday cyclists to compare themselves to the superhuman riders that conquer the most famous cycling race in the world.
- Feature Story
Related Content
May 4, 2024

What’s the Average Speed of Tour de France Riders in MPH?
How fast do pro cyclists ride what's a pro rider's average speed.
16 July, 2015 Bek Ask Alpha Ninja

Reese: “I’ve been watching the pro cyclists in the Tour de France this year, and I’ve heard some speeds thrown out here and there, but I can’t seem to figure out how fast they’re really going. What is a rider’s average speed in miles per hour?”
This is a popular question, Reese. In fact, you’re one of about 30 people to ask us this since the beginning of this year’s Tour de France. While there’s not a simple answer to your question, we can break it down into a few generalities here.
In 2015, Rohan Dennis broke a record for the fastest average speed in a time trial at 34.5 miles per hour (55.446kmph). As a rule, the pack can hammer on flats at around 26-29mph. That certainly varies, and you’ll often hear Paul and Phil talk about how the peloton is moving at well over 30mph.
When the pack hits a sprint finish, it can often stamp out speeds of over 40mph. In fact, Andre Greipel’s uploaded Strava data from Stage 5 showed that he had to hit 43.5mph (70km) in order to win.

Yesterday, Dan Martin was reported as climbing the Pyrenees at 12mph. THE PYRENEES. Based on my research, it seems that most climbs are done at around 12-14mph–and we’re talking about some serious gradients and after several hours in the saddle for days on end. Of course, many of us could probably climb pretty well with all those hours put in. Except for we sprinters, amiright?
WINNING SPEED
Over the last several years, the winner of the tour has posted an overall average speed of right around 25mph (40kmph)–but that encompasses an entire tour. Uphill, downhill, time trial, flatland, it’s all averaged at 25mph. A little faster than us. A little.
But that’s us. How do you stack up?
- average speed of pro riders
- questions and lists
- tour de france
12 Comments
I have held 32 mph for a couple miles aided by a tailwind.
Yesterday, Cavendish posted a photo of his Garmin showing a max speed of nearly 102 kph. He said he reached that speed descending Tormelet. My highest is 54.5 mph.
Geez! I guess I am not as fast as I thought: avg 20 mph. RobinsonBball.com
It probably helps to have a couple dozen other riders helping to drag you along, huh?
A crit can easily average 28 mph. No hills.
Good amateurs maybe average 21MPH on the flat.
Chris Froome probably averages 16MPH riding up a category 2 climb.
I average 14+ On solo rides. Unless, of course, there is another rider in my peripheral. Just keep them looking ass and elbows, I haven’t had the very closest outside of the block.
Upon review, that last sentence didn’t dictate right… Stay off my wheel motherf-ers
With an average speed of 14mph, no serious cyclist is going to be on your wheel. They are going to leave you in the dust…
Can anyone please tell us what the approximate number of pedals (each leg) were per kilometer for Chris Froome and the group who completed the 2017 TdF? We are trying to get an estimate of the number of pedals (per leg) for the full 3.500 km. Eg if the pedals per km was, say, 1.000 then the total number of pedals was 3.500.000. We cannot believe there is any accurate record of the actual figures. Thank you
Simple math can give you that. Take Froome’s average cadence and multiply it by his total hours ridden to get the units, you can also do the inverse with speed divided by distance to get the time.
i.e. if the total distance of race ‘x’ was 2500 km and he averaged 50km/h we know it took him 50 hours exactly to finish the race and lets say his average cadence was 100 RPMs – then we can conclude 50x60x100 = 300,000 rotations to finish the race. From that and the distance, along with all the other data – you can basically extrapolate F1 type numbers on the power, wattage, gearing, etc. etc. To say ‘We cannot believe there is any accurate record of the actual figures’ is absurd – they know the temperature of the air, ground, psi in both tires, L/R balance of power, coefficient of drag of the bike and the person, head and crosswinds, etc. etc.
Heck, I am super amatuer and have a garmin bike computer with more data than I know what to do with.
48 kph for 30 min on stationary bike – age 59 – trying to lose weight
1 Trackback / Pingback
- How to select a bicycle according to your needs and budget? - Page 35
Leave a Reply Cancel reply
Your email address will not be published.
Sign me up to get new articles via email!
Notify me of follow-up comments by email.
This site uses Akismet to reduce spam. Learn how your comment data is processed .
Copyright © 2019 | SLO Cyclist
Tour de France Statistics
Updated for the 2021 edition
Profiles year-by-year
Figure 1: Tour de France stage profiles year-by-year since 2012.
Back to top
Cumulative distance
Figure 2: Tour de France cumulative distance per year over all stages since 2012.
Most frequent participants
Figure 3: Most Tour de France participations since 2012. Only the top 20 riders are shown.
Most stage wins
Figure 4: Most Tour de France stage wins since 2012. Only the top 20 riders are shown.
Most top 10 classifications
Figure 5: Most Tour de France stage top 10 positions since 2012. Only the top 20 riders are shown.
Number of participants per country
Figure 6: Number participants per country since 2012.
Most stage wins by country
Figure 7: Most Tour de France stage wins since 2012 by country. Only the top 20 countries are shown.
Stage wins per participant per country
Figure 8: Number of stage wins per number of participants per country since 2012.
Most top 10 classifications by country
Figure 9: Most Tour de France stage top 10 positions since 2012 by country. Only the top 20 countries are shown.
Top 10 classifications per participant per country
Figure 10: Number of stage top 10 classifications per number of participants per country since 2012.
General classification winners
Figure 11: Tour de Franceclassifications winners since 2012. GC=general classification, PC=points classification, YC=youth classification and MC=mountain classification.
Cumulative number of abandoned riders
Figure 12: The cumulative number of abandoned riders over the Tour de France stages since 2012, excluding Team Time Trials (TTT).
Mountain points since 2012
Figure 13: Most Tour de France mountain points since 2012. Only the top 20 riders are shown.
Sprint points since 2012
Figure 14: Most Tour de France mountain points since 2012. Only the top 20 riders are shown.
Position GC winner stage-by-stage
Figure 15: Position in GC through the stages for Tour de France winners since 2012.
In our last analysis, shown in Figure 15 , we take a look at how the GC winner moves within the GC as the race matures. The figure is a bit complex, but what you see is the following:
The horizontal axis shows each stage of the race, the vertical axis is the time difference with respect to the GC leader after each stage.
Each line is the overall GC winner from 2012 up to now. So from each year there is one name.
The height of the line shows the lead (negative values) or the lag of the GC winner from stage 1 until the end. If the dot is above 0 the GC winner is still behind, once the dot is below zero the GC winner is in the lead. The further below zero it gets the larger the gap with the runnerup in the general classification.
The figure is interactive so by hovering over the dots you can see the exact details and the full GC top 3.
- Sports & Recreation ›
Professional Sports
Industry-specific and extensively researched technical data (partially from exclusive partnerships). A paid subscription is required for full access.
- Winner average speed in the Tour de France 1903-2023
Tour de France winner's average speed from 1903 to 2023 (in kilometers per hour)
- Immediate access to 1m+ statistics
- Incl. source references
- Download as PNG, PDF, XLS, PPT
Additional Information
Show sources information Show publisher information Use Ask Statista Research Service
September 2023
1903 to 2023
All figures have been rounded.
Other statistics on the topic Tour de France
Sports & Fitness
- Tour de France riders with the most victories 1903-2022
- Budget of selected Tour de France teams 2023
- Tour de France riders with the most stage wins 1903-2023
- Most Tour de France wins 1903-2022, by country
To download this statistic in XLS format you need a Statista Account
To download this statistic in PNG format you need a Statista Account
To download this statistic in PDF format you need a Statista Account
To download this statistic in PPT format you need a Statista Account
As a Premium user you get access to the detailed source references and background information about this statistic.
As a Premium user you get access to background information and details about the release of this statistic.
As soon as this statistic is updated, you will immediately be notified via e-mail.
… to incorporate the statistic into your presentation at any time.
You need at least a Starter Account to use this feature.
- Immediate access to statistics, forecasts & reports
- Usage and publication rights
- Download in various formats
You only have access to basic statistics. This statistic is not included in your account.
- Instant access to 1m statistics
- Download in XLS, PDF & PNG format
- Detailed references
Business Solutions including all features.
Statistics on " Tour de France "
- Tour de France winners 1903-2021, by podium position
- Tour de France entrants and finishers 1903-2023
- Tour de France 2021: general riders ranking, by times
- Tour de France 2021 : general teams ranking, by times
- Tour de France 2021: best sprinters, by number of points
- Tour de France 2021: Best climbers, by number of points
- Salaries of the highest-paid Tour de France riders 2021
- Tour de France performance bonuses 2021
- Riders with the most Tour de France yellow jerseys 1903-2023
- Riders with the most Tour de France entries 1903-2023
- Tour de France best-performing countries 1903-2021, by podium position
- Tour de France total French TV audience 2022-2023
- TV channels broadcasting Tour de France 2021
- Tour de France live broadcasters 2021, by geographical area
- Tour de France sponsor partners 2021, by type
- Tour de France revenue distribution 2019
- Interest in watching Tour de France 2020 and 2021, by country
- Share of the French population intending to follow the Tour de France 2021
- Influencing factors for watching Tour de France 2021, by nation
- Deterrents for not watching Tour de France 2021, by nation
- Sports with the most anti-doping rule violations worldwide 2020
- Tour de France riders who committed anti-doping violations 1968-2023
- Confidence in Tour de France teams for complying with the anti-doping rules 2023
Other statistics that may interest you Tour de France
Event history
- Premium Statistic Tour de France winners 1903-2021, by podium position
- Premium Statistic Tour de France entrants and finishers 1903-2023
- Basic Statistic Most Tour de France wins 1903-2022, by country
- Premium Statistic Winner average speed in the Tour de France 1903-2023
2021 edition
- Premium Statistic Tour de France 2021: general riders ranking, by times
- Premium Statistic Tour de France 2021 : general teams ranking, by times
- Premium Statistic Tour de France 2021: best sprinters, by number of points
- Premium Statistic Tour de France 2021: Best climbers, by number of points
- Premium Statistic Salaries of the highest-paid Tour de France riders 2021
- Premium Statistic Budget of selected Tour de France teams 2023
- Premium Statistic Tour de France performance bonuses 2021
- Basic Statistic Tour de France riders with the most victories 1903-2022
- Basic Statistic Riders with the most Tour de France yellow jerseys 1903-2023
- Basic Statistic Tour de France riders with the most stage wins 1903-2023
- Premium Statistic Riders with the most Tour de France entries 1903-2023
- Premium Statistic Tour de France best-performing countries 1903-2021, by podium position
TV audience and sponsorship
- Premium Statistic Tour de France total French TV audience 2022-2023
- Premium Statistic TV channels broadcasting Tour de France 2021
- Premium Statistic Tour de France live broadcasters 2021, by geographical area
- Premium Statistic Tour de France sponsor partners 2021, by type
- Premium Statistic Tour de France revenue distribution 2019
Fan interest
- Premium Statistic Interest in watching Tour de France 2020 and 2021, by country
- Premium Statistic Share of the French population intending to follow the Tour de France 2021
- Premium Statistic Influencing factors for watching Tour de France 2021, by nation
- Premium Statistic Deterrents for not watching Tour de France 2021, by nation
Anti-doping rule violations
- Premium Statistic Sports with the most anti-doping rule violations worldwide 2020
- Premium Statistic Tour de France riders who committed anti-doping violations 1968-2023
- Premium Statistic Confidence in Tour de France teams for complying with the anti-doping rules 2023
Further related statistics
- Premium Statistic Opinion of cycling fans in France on the future winner of the Tour de France 2017
- Premium Statistic Tour de France presumed winners in France 2021
- Basic Statistic Tour de France: the French's favorite national cyclists in 2016
- Basic Statistic French cyclists who marked the Tour de France according to cycling enthusiasts 2017
- Basic Statistic Opinion of French tennis fans on the future winner of Roland Garros 2017
- Basic Statistic Tour de France: Spanish winners 1903-2023
- Premium Statistic Public interest in Tour de France among French 2018
- Basic Statistic Number of cyclists wearing the Tour de France Yellow Jersey 1919-2019, by country
- Basic Statistic Average vehicle speed on motorways in the United Kingdom (UK), 2014
- Basic Statistic "Best Actress" winners at the Tony Awards 1982-2015, by ethnicity
- Premium Statistic Average connection speed from Q1 2014 to Q1 2017 in Finland
- Premium Statistic Average connection speed from Q1 2014 to Q1 2017 in Switzerland
- Premium Statistic Average internet connection speed in Indonesia Q1 2014-Q1 2017
- Premium Statistic Number of victories of members of Spanish film industry at the Oscars 1969-2020
- Premium Statistic Share of French wishing to follow the 2017 Tour de France
- Premium Statistic Generation Z preferred work model in Poland 2020
- Premium Statistic Repair of household appliances, garden equipment revenue in Luxembourg 2010-2022
Further Content: You might find this interesting as well
- Opinion of cycling fans in France on the future winner of the Tour de France 2017
- Tour de France presumed winners in France 2021
- Tour de France: the French's favorite national cyclists in 2016
- French cyclists who marked the Tour de France according to cycling enthusiasts 2017
- Opinion of French tennis fans on the future winner of Roland Garros 2017
- Tour de France: Spanish winners 1903-2023
- Public interest in Tour de France among French 2018
- Number of cyclists wearing the Tour de France Yellow Jersey 1919-2019, by country
- Average vehicle speed on motorways in the United Kingdom (UK), 2014
- "Best Actress" winners at the Tony Awards 1982-2015, by ethnicity
- Average connection speed from Q1 2014 to Q1 2017 in Finland
- Average connection speed from Q1 2014 to Q1 2017 in Switzerland
- Average internet connection speed in Indonesia Q1 2014-Q1 2017
- Number of victories of members of Spanish film industry at the Oscars 1969-2020
- Share of French wishing to follow the 2017 Tour de France
- Generation Z preferred work model in Poland 2020
- Repair of household appliances, garden equipment revenue in Luxembourg 2010-2022
FAQs of the Tour de France: How lean? How much power? How do they pee mid-stage? All that and more explained
Ever wondered why riders have such veiny legs? Do riders share rooms? How does a 60km ride count as a rest day? We take a look at the burning questions and those you never thought to ask
- Sign up to our newsletter Newsletter
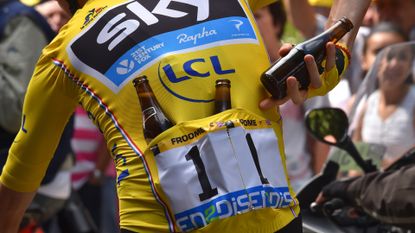
The 2023 edition of the Tour de France is now underway - and if you’ve been following the racing action, there’s probably quite a fair few points that might have piqued your curiosity. That is to be fully expected - a lot is left going on behind the scenes that the cameras aren’t capturing.
Google's autocorrect can provide us with a wealth of information around the general public's deepest thoughts about the pros. For instance, it seems there are enough people desperately searching for ‘how do cyclists pee whilst racing the Tour de France?’ that the search engine is serving up this suggestion for everyone.
Naturally, we couldn’t leave them hanging, and our answer to how exactly cyclists do pee during top level races can be found here. There’s an almost dizzying array of other questions, too, which we'll get fully stuck into here.
We will take a look at Tour de France performance trends and, continuing past the finish line, we’ll also reveal what the riders get up to in their team buses and talk more about how the pros deal with the hotel-to-hotel life that makes up the three weeks of a Grand Tour.
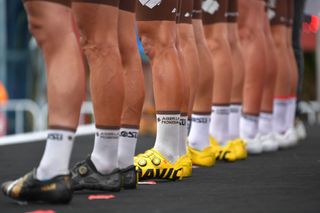
Why are Tour de France cyclist’s legs so veiny?
We’ve all got veins in our legs quite near to the skin surface, but they are hidden by a layer of fat just under the skin.
Tour de France cyclist's legs appear to be uber-veiny for two main reasons: firstly, they have much less body fat than ‘ordinary’ people, and secondly, their veins and arteries have adapted to carry more blood around their bodies. The cardiovascular adaptations are numerous, but a large increase in vein and artery diameter is one of them. You can read more about the science behind why Tour de France rider’s legs are so veiny here.
A post shared by Tomasz Marczyński 🅻🅾🅲🅾 (@tmarczynski) A photo posted by on

What do Tour de France riders do on their rest days?
They ride, and not just a little amble around the streets. Most will be on their bikes for two hours and some even more.
In the early days of Team Sky, Russell Downing found out why after the first rest day of his Grand Tour debut in the 2011 Giro d’Italia: “It was a hard race, the weather was bad and by the first rest day I was really tired. The others asked if I was going with them, but it was cold and raining and I said I’d go on the turbo in the hotel basement instead. I did that for about 45 minutes, just very easy, then went back upstairs to lie down. Next day I was nailed for the whole stage, just hanging on. I was okay the day after, but I’d learnt my lesson and rode with the boys on the next rest day. If you don’t ride reasonably hard on the rest day , your body thinks you’ve stopped and switches off ready for deep recovery. You’ve got to keep it firing for the whole three weeks.”
What is a soigneur in cycling and what are their duties during the Tour de France?
Soigneur is the French word for ‘carer’, and basically soigneurs care for riders. They prepare them for each stage, looking after them at the finish and back the hotel, with massage and rehab therapies. And they care in other ways too.
Dirk Nachtergaele, a Belgian pro team soigneur for over 40 years says: “A soigneur is also like a priest. We are the one who riders can confide in, confident that anything they tell us goes no further. They can complain about another rider, the sports director even; they can talk about problems at home – anything. They know we will not tell anyone what they said. That role as confidante is as necessary in a team as being a skilled therapist.”
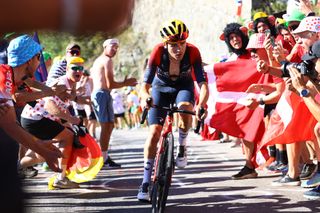
How light and lean are the Tour de France climbers?
Double Tour de France stage winner, the recently retired Irish pro rider Dan Martin was a climbing specialist. His racing weight was 62kg, which is light for his 5ft 9in height, but some shorter climbers weigh under 60kg. However, being super-light is no longer the preserve of the pure climbing specialists. Defending Tour champion Pogacar is the same height as Martin and only slightly heavier at around 66kg, while 2019 winner Egan Bernal , also 5ft 9in, is a true featherweight at just 60kg.
The riders mentioned start the Tour de France with body fat percentages well below 10 per cent, but nutritionists are careful not to allow ‘cutting’ to go too far.
In fact, it can be better to offload a little muscle, as Dr Rob Child, a performance biochemist who worked with several World Tour teams, explains: “It’s sometimes worth losing a bit of muscle to reduce weight because very low body fat has health implications. Tour de France performance is governed by the cardiovascular system, not by the maximum force applied to the pedals. Pro riders don’t need huge amounts of muscle to pedal at 400 watts for 20 or 30 minutes, and that’s often the key to performing well overall in the Tour. They need a highly developed cardiovascular system, not big muscles.”
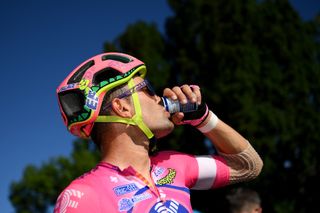
Why do Tour de France riders drink Coca-Cola?
Most team nutritionists would rather the riders didn’t drink coca cola, and some teams even forbid it.
That said, there’s also always one small can of coke in the musettes Trek-Segafredo gives its riders. Drinking a regular fizzy drink such as a cold can of coke after a stage is good for morale – and preserving positivity in a brutal three-week race is vital.
Of course, the most important nutritional consideration for riders is getting enough calories to meet the extreme demands of the race. If you’re wondering how they achieve that, here we look into what exactly goes into fuelling the riders of the Tour de France .
What do Tour de France riders do to recover between stages?
The standard of hotels used by the Tour has improved a lot in recent years, so that helps with sleep and recovery . Even so, teams provide further ‘home comforts’ by carrying all their own bedding, including mattresses and pillows. They also have their own washing machines in the team buses and equipment trucks. Everything is done to promote good sleeping habits and hygiene.
Riders generally do room-share, partly through tradition but also because it’s good to have company. Pairings are decided diplomatically, though.
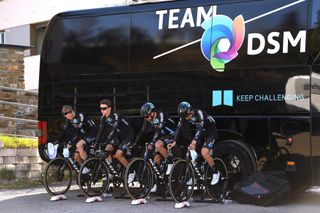
Why and how do riders warm up before each stage?
The ‘why’ is explained by double Tour stage winner Steve Cummings: “There are two races in every stage: the first is to get a breakaway established, and the second is to win the stage. If I saw a stage that suited me, one where a break might stay away and give me a chance to win, I’d focus on the first hour to 90 minutes, nothing else. Typically it was attack after attack right from the start, then a huge effort to get the break established. You had to be fully warmed up for that.”
As to the ‘how’, a Tour warm-up is usually done on a turbo trainer, allowing the whole team to warm-up in one compact space, everyone controlling their effort. Ineos-Grenadiers’s deputy team principal Rod Ellingworth says: “The idea is to prepare the rider’s energy systems for a fast start. They ride steady but progressively harder for at least 20 minutes, then do five minutes of capacity work to open everything up. After that they pedal easily and try to stay loose.”
How much do riders have to eat to meet energy demands?
Riders can burn twice or even three times their usual calorie requirement during a hard day at the Tour. Nigel Mitchell, a nutritional consultant who worked extensively with WorldTour cycling teams, says: “At a Grand Tour, riders can burn more than 5,000kcal on a single stage, depending on the terrain, and that means consuming a huge amount, both off the bike at meal times and on it during the race, in the form of energy drinks, bars and gels.” To put 5,000kcal into perspective, it is roughly equivalent to four large McDonald’s BigMac meals.
What do the riders eat after each stage?
Does each rider have their own bespoke meals? Who does the cooking?
Three questions, but they are related and so are the answers, which come from a former Tour de France rider, UAE Team Emirates former sports director and current race analyst Allan Peiper. The man who oversaw Tadej Pogačar’s first Tour de France win in 2020 told us: “Each rider has a bespoke meal plan based on any needs flagged up by team doctors and physiologists, and on any personal physiological quirks such as intolerances or allergies. The medics talk with nutritionists, and the nutritionists tailor meals to meet specific needs. Each team also has its own chef who works with the nutritionist to prepare tailor-made meals.”
How heavy are the heaviest riders in the race, and how do they get over the mountains inside the time cut?
There are very few riders of over 80kg in the Tour de France nowadays. The limiter when climbing mountains is power-to-weight ratio, and if a rider is too bulky they cannot overcome the disadvantage, no matter how mighty their power output. The heaviest Tour de France rider since 2000 was the Swede Magnus Backstedt, who says: “I had to be the lightest I could be for the Tour, which was around 90kg, and as fit as I could be. But at my weight, every hill is steep, and the mountains were a real challenge. On mountain stages, I’d hang on to the peloton for as long as possible, then look for a good grupetto – that’s what we call the groups of non-climbers who ride together to get inside the time limits. Once in a grupetto with experienced riders, it was just a case of digging deep, sometimes very deep, and hanging on.”
Grit and stubbornness get heavier riders up the mountains, but they have an advantage to deploy on the other side, going down. Tour stage winner Sean Yates was a tall, well-built rider, and he says: “You have to get good at descending if you are bigger. You can’t regain all the time you lost going up, but you can get some of it back by really going for it on the descents.”
What’s the relationship between rider age and Tour de France performance?
It used to be that riders developed into Tour contenders gradually over many years. Those youngsters who did take part would be expected to help the team and gain experience, and possibly even drop out after the first week. That’s all changed. Tadej Pogačar was just 21 when he first won in 2020, and Egan Bernal was 22 when he won in 2019. Pogačar’s coach Inigo San Millan has this to say about his rider’s prodigious ability: “He has extraordinary physiological characteristics, and the correct mental attributes, so he was already good enough to win at 21.”
Until Bernal’s win three years ago, it was thought that riders reached their peak in terms of physiology, psychology and skill at around 26 or 27. According to Allan Peiper: “This may still be true, we just don’t know what the young winners we have now will be like when they are 27 or 28. Will they still be winning, or will the next generation have surpassed them?” At the other end of the scale, the oldest Tour winner of modern times was Cadel Evans in 2011, at the age of 34.
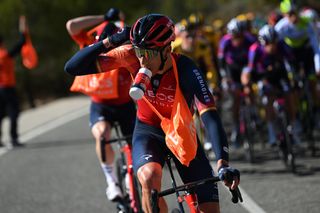
What do the riders’ musettes contain?
Nothing very surprising, just a re-supply of the gels, drinks and energy bars. Musettes were more interesting in times gone by, when they contained cakes and tarts for energy, small ham and cheese baguettes for protein, and all manner of delights. The food was individually wrapped and packed by the soigneurs. The first female soigneur Shelley Verses, who worked for US team 7-Eleven in the 1980s, used to wrap her riders’ food in pages from Playboy magazine. “It was good for their morale,” she commented.
Do Tour de France riders drink alcohol during the three weeks?
Yes, but not much. Stage wins might be celebrated with a glass of champagne, and sometimes a small glass of red wine is taken with the evening meal, but that’s as far as it goes. Teams have tried total bans on alcohol, but most allow small amounts to protect morale.
All rather sensible – not like Tour riders from previous eras. In the early days of the race, riders drank wine and beer during stages because it was less of a threat to health than the contents of some of the primitive water supplies. Right up to the 1960s, some riders enjoyed a mid-Tour tipple or two. One of the most notorious stories is about the 1964 Andorran rest day when race leader Jacques Anquetil went to a party and indulged to such an extent he was hungover the next day and almost lost the race.
How do Tour de France riders stay hydrated through sweltering long stages?
Nigel Mitchell tells us: “I get riders to start drinking as soon as they wake. I mix water with a little fruit juice in a big bottle, because that makes it more interesting than plain water, and I ask them to finish it before breakfast. They drink fruit juice with breakfast for the electrolytes, and another bottle of diluted fruit juice travelling to the stage start.
“During the stage, they drink from two bottles on the bike, one plain water and one energy drink, and they keep getting fresh bottles from the team car or support motorbikes. They get more fluid in a protein shake after the stage, and an electrolyte drink if it’s been hot. I also provide rice cakes, which contain quite a lot of moisture from the water absorbed by the rice during cooking.
“Even then, we still check on hydration by checking the rider’s weight each morning. If they are well hydrated, they will stay at pretty much the same weight throughout the Tour.”
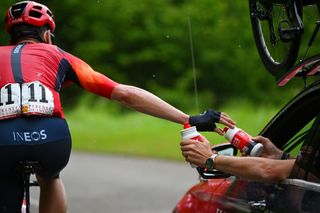
What’s the role of the bottle-carrying domestiques in the Tour de France?
The cycling community uses a lot of French words, with domestiques being one of them. Transporting bottles from the team car to team-mates in the peloton is just one of many duties carried out by domestiques.
This supply chain is overseen by the sports directors, as Allan Peiper explains: “The sports directors have real-time information in the team cars on each rider’s performance metrics. They can tell if anyone is having a bad day, and they won’t ask that rider to drop back to the team car and pick up bottles, because it could just push them further into the red.”
Each team has several domestiques and their role, although complicated in execution, is straightforward in mission. It’s to put the team’s leader (or leaders) in the best position to challenge for victory.
That could involve riding at the front to control the peloton’s pace, leading riders who’ve punctured back to the action, chasing when a breakaway needs to be brought back, leading out sprinters at the end of stages, setting the pace in the mountains, and many other jobs. They even perform a very unglamorous function in comfort stops.
Find definitions of the French cycling terms you hear during the Tour de France , such as domestiques, over here.
In terms of FTP and watts per kilo, what does it take to be a GC contender at the Tour de France?
In 2020 the power meter supplier to Team UAE Emirates, Stages, released the following information on Tour de France winner Tadej Pogačar’s performance metrics from Stage Nine, a mountainous stage in the Pyrenees:
Time: 3:58:16
Average power: 301W (4.5W/kg)
Normalised power: 351W (5.4W/kg)
Peak 5min power: 473W (7.2W/kg)
Peak 20min power: 429W (6.5W/kg)
To put these figures in context, good amateur racers (i.e. cat two) are capable of five-minute power in the region of 4-5W/kg and 20-minute power of 3.5-4.1W/kg. Even for committed amateurs who train hard, a huge gulf in performance separates them from the likes of Pogačar.
Do Tour de France riders use dietary supplements. If so, which ones?
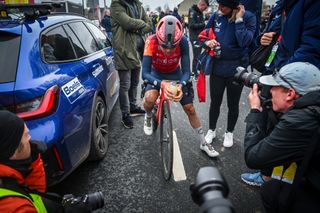
They need lots of protein to help recover, so they drink recovery drinks and eat protein bars to augment the protein they get from food. They sometimes consume vitamin and mineral supplements too. Dr Rob Child says: “I try to meet a rider’s needs through well-cooked, nutritious foods, but I always know what their nutritional state is in detail. We take regular blood tests, and I can use supplements to make good any deficiencies.”
Do riders pee during the Tour de France?
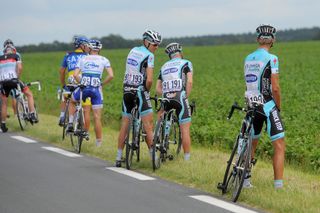
If the race pace isn’t too high, riders can stop by the side of the road, having picked a place where nobody can see – which can be difficult. Peeing on the move is a skill Tour de France pros must have in their toolbox. It’s tricky, as it’s impossible to pedal while peeing, so it’s up to the poor domestique to ride alongside and with a hand on the back to maintain forward momentum.
And here’s how difficult peeing can be…In 1965 British pro Vin Denson rode the 1965 Bordeaux-Paris, a 365-mile single day race, in support of the race winner Jacques Anquetil. As he approached Paris late in the afternoon, Denson realised he hadn’t peed since the start at 2.30am, and he was bursting. He stopped at the side of the road, but found he couldn’t pee at all, even though his bladder was full. Desperate, he shouted to the stationary team car and his soigneur got out, poured a flask of hot coffee down the front of Denson’s shorts, and Denson recalled: “I went like a fountain – it was glorious!”
This full version of this article was published in the print edition of Cycling Weekly. Subscribe online and get the magazine delivered direct to your door every week.
Get The Leadout Newsletter
The latest race content, interviews, features, reviews and expert buying guides, direct to your inbox!
Thank you for reading 20 articles this month* Join now for unlimited access
Enjoy your first month for just £1 / $1 / €1
*Read 5 free articles per month without a subscription
Join now for unlimited access
Try first month for just £1 / $1 / €1
Chris has written thousands of articles for magazines, newspapers and websites throughout the world. He’s written 25 books about all aspects of cycling in multiple editions and translations into at least 25
different languages. He’s currently building his own publishing business with Cycling Legends Books, Cycling Legends Events, cyclinglegends.co.uk , and the Cycling Legends Podcast
British rider remembers his victory at Paris-Roubaix juniors
By Tom Thewlis Published 4 May 24
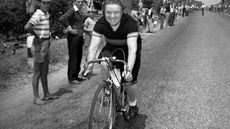
Alfonsina Strada made headlines when she entered the 1924 edition of the Giro d’Italia, under the name 'Alfonsin', and the story of her grit and determination to finish against all odds lives on today
By Giles Belbin Published 4 May 24
Useful links
- Tour de France
- Giro d'Italia
- Vuelta a España
Buyer's Guides
- Best road bikes
- Best gravel bikes
- Best smart turbo trainers
- Best cycling computers
- Editor's Choice
- Bike Reviews
- Component Reviews
- Clothing Reviews
- Contact Future's experts
- Terms and conditions
- Privacy policy
- Cookies policy
- Advertise with us
Cycling Weekly is part of Future plc, an international media group and leading digital publisher. Visit our corporate site . © Future Publishing Limited Quay House, The Ambury, Bath BA1 1UA. All rights reserved. England and Wales company registration number 2008885.
- As it happened: Narváez defeats Pogačar to win opening stage of the Giro
How hard is the Tour de France?
We look at power, calories, recovery data, speed and more to compare a Tour de France rider's efforts to those of an everyday cyclist
Watching the Tour de France from the comfort of your own home, many of us have questioned if it'd be possible to ride the race ourselves. The world's best cyclists at peak fitness can make it look almost too easy at times, which could lead to a skewed perception of how hard the Tour de France actually is.
Obviously, deep down, we are all aware that the race is light-years away from a Sunday coffee ride with your local cycling club, otherwise, we’d all be lining up at the start. But when you watch the likes of Tadej Pogačar (UAE Team Emirates) powering up an Alp, it’s hard not to feel inspired.
It's not a huge logical leap to then wonder how we might compare, and whether we could keep up with the pro peloton. Any cyclist who is familiar with power numbers such as watts per kilo, FTP , etc, will likely have wondered at some point how their numbers would stack up when compared with Wout Van Aert and co.
The question on all our lips is: exactly how hard is the Tour de France? Spoiler alert: it’s hard. Very hard. Of course it’s hard, it’s the Tour de France, arguably the pinnacle of any pro rider’s career. What we really want to know is 'how hard?'
Over the course of this article, we will try to quantify just that: how hard the pros work during the three-week race and compare that, roughly speaking, with the efforts we mere mortals are capable of.
To provide you with meaningful answers, we dived into race road books from the last few editions of the race, dug through the power files of some of the riders to try and fathom their efforts, along with taking a look at their recovery files to gauge the relative strain that their bodies endure. Then, we gathered data from the general public – ‘normal’ cyclists such as you and I – in an attempt to gain some perspective on the difference.
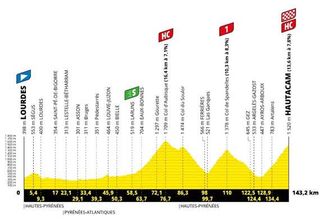
The terrain
At its close, the riders in the 2021 Tour de France covered 3,414 kilometres (2,121 miles) – not including the riding they did on the two rest days. The 2022 edition of the race was actually ever so slightly shorter with a total of 3,328km (2067 miles) of racing.
Get The Leadout Newsletter
The latest race content, interviews, features, reviews and expert buying guides, direct to your inbox!
Put plainly, if you were to get in a car in New York and head west, that'd get you as far as Salt Lake City. If you were to get onto a plane in London, you could get to Paris and back again five times. If you were in Australia you'd make it from Melbourne right over to Perth on the western coast.
Throughout this distance, riders face a whole host of climbs, from small hills to enormous mountain passes. For the 2023 edition this year, riders will cover 3,404km (2,115 miles) including ascents of the Puy de Dôme and the Grand Colombier in the Pyrenees.
According to data published to Strava by Tour debutant Tom Pidcock (Ineos Grenadiers), in the 17 stages leading up to his impressive Stage 18 victory atop Alpe D'Huez last year, he had ascended a total of 43,110m. That's almost five times the height of Mount Everest.
In addition, while it's easy and obvious to focus on the difficulty of going uphill, there's a level of difficulty involved in coming down the other side too.
For us average Janes and Joes, coming downhill might seem like the easy part – you can often stop pedalling and simply let gravity do the work – but let's not forget these riders are in a race so will be sprinting out of corners and pushing the limits of physics to go as quickly as possible, which in itself takes an enormous amount of mental energy and focus.
As an example of this, according to that same data from Pidock, the maximum speed he hit during Stage 18 of last year's Tour was 62.7mph (100.91km/h). Stage 18 will long be remembered in particular for the jaw-dropping descent of the Col Du Galibier that Pidcock executed on the way to a solo win atop Alpe D'Huez. Although he actually clocked his maximum speed later on in the stage on the descent of the Croix de Fer / Glandon. He also hit a huge maximum cadence of 200rpm during the stage. Descending like this takes a large amount of skill and concentration, it is hard to begin to imagine the amount of focus this requires and the cognitive load it creates.
The training
The Tour de France is ridden by the world's best road cyclists, all of whom are full-time professionals that ride for around 20 to 30 hours per week. But wait, before you quit your nine-to-five job and start cycling all day, know that these riders aren't just riding their bike for fun, they are completing highly tailored structured training programs designed by some of the best physiologists and coaches in the world.
Sadly, even if we did have that expertise at our disposal, most of us still couldn't quit the day job, because professional cyclists are also blessed with the right mix of genetic potential that enables them to respond to such a high training stimulus and recover quickly enough to go again the next day, day after day, week after week.
To try and quantify this, we reached out to TrainerRoad – a popular training-based indoor cycling app turned all-around training platform that boasts a dataset of over a million users – to get a sense of the amount of structured training that the 'average' cyclist tackles.
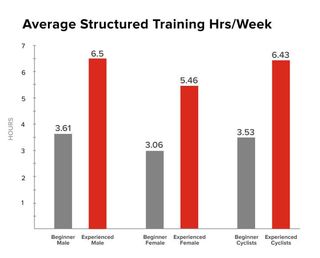
According to TrainerRoad's data, an average 'beginner cyclist' performs 3.53 hours of structured training per week, split at 3.61 hours for men and 3.06 hours for women. While 'experienced cyclists' perform 6.43 hours per week (6.5 hours for men, 5.46 for women).
What this means is that your average beginner is performing just 10% of the training hours of a Tour de France cyclist.
The time cut
To complete the Tour de France, you cannot simply commit to finishing the route, you'll need to do so within the constraints of a time cut on each stage.
According to rule 2.6.032 of the UCI rulebook, exactly what that time cut will be is defined as follows:
"The finishing deadline shall be set in the specific regulations for each race in according with the characteristics of the stage.
“In exceptional cases only, unpredictable and of force majeure [unforeseeable circumstances], the commissaires panel may extend the finishing time limits after consultation with the organisers."
So in layman's terms, the organisers will decide the time cut based on the difficulty of the stage. We won't go into the details of how they then calculate it, but depending on the difficulty of the stage and the pace of the fastest rider, it will usually be the winner's time plus anything between 4% and 18%.
To turn that into an example, if a stage took the winner exactly four hours to complete, the time cut would be anywhere between 9m36s and 43m12s later.
It was a hotly discussed topic last year, with sprinter Fabio Jakobsen fighting on every mountain stage, and in particular on Stage 17, where he pushed himself to the very limit to make the time cut by a mere 15 seconds.
This essentially means that to complete the Tour de France, you need to not only finish the route, you need to be able to do so within a percentage of the winner's time, which leads us nicely onto speed.
In trying to work out how hard the Tour de France actually is, you will need to know what speed you'll need to be able to ride in order to keep up. The 2022 edition of the Tour was the fastest in the race's history. The average speed of winner Jonas Vingegaard for the 21-stage race set a new record at 42.03km/h (26.12mph)
Combining every edition of the Tour since 2007, the average pace of the winner has been 40.07km/h (24.89mph). Anyone who has ridden a local time trial will know that it's difficult to maintain this pace for 10 miles, let alone the 2000-plus miles covered in the Tour.
However, of course, anyone who's ridden in a group will also know that there's an enormous benefit from being in the draft. That is, of course, until the road points up and gravity does its best to slow you down.
After Ben O'Connor's victory into Tignes on stage 9 of the 2021 Tour, we analysed his performance and saw just how strong the AG2R Citroën rider had to be to win a stage of the Tour de France. The final climb on this stage was Montée de Tignes, which is 31.1km long with an average gradient of 4.1%. This climb took O'Connor 1 hour and 12 minutes, during which he rode at an average speed of 26kph (16.15mph), naturally taking the Strava KOM along the way.
But even if you're not vying for a win, and you're simply trying to make it to the finish line within the time cut, you'll still need to maintain a very high pace. In 2020, Roger Kluge finished at the very bottom of the GC standings, at 6:07:02 behind Tadej Pogačar's winning time of 87:20:13. With that, Kluge still maintained an average speed of 39.09km/h (24.29mph).
A commonly used and widely understood assessment of a rider's ability is FTP, or Functional Threshold Power, which is said to be the maximum amount of power that a rider can sustain for an hour. It is often tested with a sustained 20-minute effort, with the average power from this effort multiplied by 0.95.
Measured in watts, this can be quoted in an absolute figure, or in 'watts per kilogram' where the absolute figure is divided by the rider's weight. So for example, a 75kg rider with an absolute FTP of 300 watts would have a weight-adjusted FTP of 4w/kg.
In our analysis of O'Connor's data, we calculated his absolute FTP to be 395 watts, and according to ProCyclingStats, his weight is 67kg, meaning he boasts an FTP of 5.89w/kg.
Similarly, during the 2020 Tour, we analysed the power file of Tadej Pogačar after his record-breaking ascent of the Col de Peyresourde and calculated his FTP to be 410 watts, or 6.2w/kg.
To compare this to an average cyclist, we went back to TrainerRoad, who supplied the average FTP of its entire database.
- Male beginners, the average FTP sits at 214 watts (2.81w/kg)
- Experienced male cyclists, the average jumps to 271 watts (3.75w/kg)
- Female beginners, the average FTP sits at 146 watts (2.45w/kg)
- Experienced female cyclists, the average jumps to 189 watts (3.25w/kg)
- All beginner cyclists combined, the average FTP sits at 204 watts (2.75w/kg)
- All experienced cyclists combined, the average FTP sits at 266 watts (3.72w/kg)
That means Pogacar's 410w FTP is more than 50% better than the average experienced cyclist (266w), and more than double that of the average beginner cyclist (204w). Of course, beyond this simple metric, there are a lot of other factors at play too. Not least fatigue resistance, which is the ability to output the same high power numbers at the end of a long day or at the end of three weeks of back-to-back racing.
For his ascent of Montée de Tignes in 2021, O'Connor needed to put out an average of 345 watts (5.1w/kg) for the 1h12 duration, on a day where, in total, he averaged 311 watts (4.6w/kg) for over 4.5 hours.
And for Pogačar's ascent of the Col de Peyresourde in 2020, which came on stage 8, he averaged 429 watts (6.7w/kg) for 24h08 at the end of a four-hour stage that included three mountains.
For a reference of just how good this is, anyone who's spent time racing on Zwift may be familiar with the five Zwift Power categories (A+, A, B, C and D). A+ is the highest here, and to get yourself into this category, you'll need an FTP of 4.6 W/kg.
To maintain all this effort, a rider needs to eat. A lot.
Going back to Tom Pidcock and adding up his calorie expenditure up to stage 18 during last year's race, the Brit had burnt a total of 59,609 calories. That's the equivalent of about 232 McDonald's Big Macs.
So how hard is it for the professional riders?
By now we have a pretty good idea of just how hard the Tour de France is, but these are professional athletes, they're the best road racing cyclists in the world and this is their job. So while it might be an impossible task for us mere mortals to even consider getting round, surely it's just another day at the office for them. Not exactly.
To quantify this, we reached out to Whoop , sponsor to EF Education-EasyPost , and makers of a wearable wrist strap that uses an optical heart rate sensor to continuously monitor heart rate and heart rate variability to quantify various metrics.
For those interested in how this works, Dr Stephanie Shell, a Senior Physiologist specialising in recovery at the Australian Institute of Sport explained the science a little more as part of our Whoop 3.0 review but put simply, it uses these metrics to allocate a 'strain' and 'recovery' score. Both are calculated using proprietary Whoop algorithms, and strain is scored out of 21, while recovery is scored as a percentage out of 100.
Whoop duly shared data for a number of its riders on various stages in the 2021 race. The most complete of these datasets is for time trialling specialist Stefan Bissegger.
Looking at his data, we're able to see how these algorithms rate the difficulty of Bissegger's days in comparison to his own baseline, thus quantifying how hard the days must be for Bissegger himself.
The data here is threefold, covering strain, recovery, and sleep performance data.
Across the nine stages for which we have data, Bissegger didn't have a day with a strain score below 17.4, with all of stages 9 to 13 scoring above 20 out of 21. This suggests that even for him, racing the Tour de France put his body through extreme strain.
Alongside this, his recovery ranged widely. His lowest score was 30%, with his highest being 81%.
All in all, it's safe to conclude that the Tour de France is truly brutal in its difficulty. It's well in excess of the capabilities of the general public and still beyond the reach of experienced, trained cyclists. Even for many of the professional athletes who start the Tour de France, actually finishing it is an altogether different proposal, and each year, dozens of riders miss the time cut.
For those who do make it to Paris, it's still right at the upper limits of their capability and that's what makes it such a thrilling sport for us viewers to consume.

Thank you for reading 5 articles in the past 30 days*
Join now for unlimited access
Enjoy your first month for just £1 / $1 / €1
*Read any 5 articles for free in each 30-day period, this automatically resets
After your trial you will be billed £4.99 $7.99 €5.99 per month, cancel anytime. Or sign up for one year for just £49 $79 €59

Try your first month for just £1 / $1 / €1

Josh is Associate Editor of Cyclingnews – leading our content on the best bikes, kit and the latest breaking tech stories from the pro peloton.
Josh has been with us since the summer of 2019 and throughout that time he's covered everything from buyer's guides and deals to the latest tech news and reviews. On the bike, Josh has been riding and racing for over 15 years.
He started out racing cross country in his teens back when 26-inch wheels and triple chainsets were still mainstream, but he found favour in road racing in his early 20s, racing at a local and national level for Somerset-based Team Tor 2000.
These days he rides indoors for convenience and fitness, and outdoors for fun on road, gravel, 'cross and cross-country bikes, the latter usually with his two dogs in tow.
New Bianchi Infinito endurance bike gets internal cable routing, purple colour option
New woes for Peloton as CEO resigns, workforce cut by 400
Benoît Cosnefroy wins Grand Prix du Morbihan
Most Popular
Home Explore France Official Tourism Board Website
- Explore the map
The 5-minute essential guide to the Tour de France
Inspiration
Cycling Tourism Sporting Activities

Reading time: 0 min Published on 8 January 2024, updated on 18 April 2024
It is the biggest cycling race in the world: a national event that France cherishes almost as much as its Eiffel Tower and its 360 native cheeses! Every year in July, the Tour de France sets off on the roads of France and crosses some of its most beautiful landscapes. Here’s everything you should know in advance of the 2018 race…
‘La Grande Boucle’
In over a century of existence, the Tour has extended its distance and passed through the whole country. Almost 3,500 kilometers are now covered each year in the first three weeks of July, with 22 teams of 8 cyclists. The 176 competitors criss-cross the most beautiful roads of France in 23 days, over 21 stages. More than a third of France’s departments are passed through, on a route that changes each year.
A little tour to start
The first ever Tour de France took place in 1903. It had just six stages – Paris-Lyon, Lyon-Marseille, Marseille-Toulouse, Toulouse-Bordeaux, Bordeaux-Nantes and Nantes-Paris – and 60 cyclists at the start line. At the time, the brave cycled up to 18 hours at a stretch, by day and night, on roads and dirt tracks. By the end, they’d managed 2,300 kilometers. Must have had some tight calves!
Mountain events are often the most famous and hotly contested. Spectators watch in awe as the riders attack the passes and hit speeds of 100 km/h. In the Pyrenees and the Alps, the Galibier and Tourmalet ascents are legendary sections of the Tour, worthy of a very elegant polka dot jersey for the best climber…
The darling of the Tour
In terms of the number of victories per nation, France comes out on top, with 36 races won by a French cyclist. In second place is Belgium with 18 wins, and in third is Spain with 12. The darling of the Tour remains Eddy Merckx, holding the record of 111 days in the yellow jersey. This Belgian won 5 times the Great Loop as Jacques Anquetil, Bernard Hinault and Michael Indurain.
‘Le maillot jaune’
The yellow jersey is worn by the race winner in the general classification (calculated by adding up the times from each individual stage). This tradition goes back to 1919. It has nothing to do with the July sunshine or the sunflower fields along the roads; it was simply the colour of the pages of newspaper L’Auto, which was creator and organiser of the competition at the time.
The Tour de France is the third major world sporting event after the Olympic Games and the World Cup, covered by 600 media and 2,000 journalists. The race is broadcast in 130 countries by 100 television channels over 6,300 hours, and is followed by 3.5 billion viewers.
The Champs-Élysées finish
Each year the Tour departs from a different city, whether in France or in a neighbouring country. Since 1975, the triumphal arrival of the cyclists has always taken place across a finish line on Paris’ Champs-Élysées. It’s a truly beautiful setting for the final sprint.
And the winner is…
Seen from the sky and filmed by helicopters or drones, the Tour route resembles a long ribbon winding its way through France’s stunning landscapes: the groves of Normandy, the peaks of the Alps, the shores of Brittany and the beaches of the Côte d’Azur. In 2017, it was the Izoard pass in Hautes-Alpes that was elected the most beautiful stage, at an altitude of 2,361 metres. Which one gets your vote?
Find out more on the official Tour de France site: https://www.letour.fr

By Rédaction France.fr
The magazine of the destination unravels an unexpected France that revisits tradition and cultivates creativity. A France far beyond what you can imagine…
Paris Region is the home of major sporting events!

Tour de France : Final stage of glory in Paris
Get in touch with nouvelle-aquitaine in south west of france.
Biarritz-Basque Country

Loire Valley, Champagne and beyond, The perfect blend
Alsace and Lorraine

Cycling, a new key to the Coastline

Along La Loire à Vélo
Loire Valley

Discovering the most beautiful beaches of the Pays de la Loire, by Natigana
#ExploreFrance
Atlantic Loire Valley

Fly, Walk, Pedal - Get Moving on the Côte d'Azur
Côte d'Azur

Official games

2023 Edition
- Stage winners
- All the videos
Tour Culture
- Commitments
- key figures
- Sporting Stakes
"Maillot Jaune" Collection
- The jerseys

"Tour de France Cycle City" label: soon 150 towns and 10 countries in the loop?
Tourtel twist to continue to add zest to the tour....

D-100: ITALY TURNS YELLOW

Discover the official Tour de France 2024 mobile...

2023 rankings

Stage 1 | 06/29 Florence > Rimini
Stage 2 | 06/30 cesenatico > bologne, stage 3 | 07/01 plaisance > turin, stage 4 | 07/02 pinerolo > valloire, stage 5 | 07/03 saint-jean-de-maurienne > saint-vulbas, stage 6 | 07/04 mâcon > dijon, stage 7 | 07/05 nuits-saint-georges > gevrey-chambertin, stage 8 | 07/06 semur-en-auxois > colombey-les-deux-églises, stage 9 | 07/07 troyes > troyes, rest | 07/08 orléans, stage 10 | 07/09 orléans > saint-amand-montrond, stage 11 | 07/10 évaux-les-bains > le lioran, stage 12 | 07/11 aurillac > villeneuve-sur-lot, stage 13 | 07/12 agen > pau, stage 14 | 07/13 pau > saint-lary-soulan pla d'adet, stage 15 | 07/14 loudenvielle > plateau de beille, rest | 07/15 gruissan, stage 16 | 07/16 gruissan > nimes, stage 17 | 07/17 saint-paul-trois-châteaux > superdévoluy, stage 18 | 07/18 gap > barcelonnette, stage 19 | 07/19 embrun > isola 2000, stage 20 | 07/20 nice > col de la couillole, stage 21 | 07/21 monaco > nice, tour culture, grand départ florence émilie-romagne 2024, grand départ lille-nord de france 2025, 2024 tour de france finale in nice, riding into the future, all the news, official tour operators, history of tour de france, accessories.
Receive exclusive news about the Tour
General Ranking
> Withdrawals

Accreditations
Privacy policy, your gdpr rights.
- Tour de France
- Giro d'Italia
- La Vuelta ciclista a España
- World Championships
- Milano-Sanremo
- Amstel Gold Race
- Tirreno-Adriatico
- Liège-Bastogne-Liège
- Il Lombardia
- La Flèche Wallonne
- Paris - Nice
- Paris-Roubaix
- Volta Ciclista a Catalunya
- Critérium du Dauphiné
- Tour des Flandres
- Gent-Wevelgem in Flanders Fields
- Clásica Ciclista San Sebastián
- UAE Team Emirates
- Arkéa - B&B Hotels
- Astana Qazaqstan Team
- Alpecin-Deceuninck
- Bahrain - Victorious
- BORA - hansgrohe
- Decathlon AG2R La Mondiale Team
- EF Education-EasyPost
- Groupama - FDJ
- INEOS Grenadiers
- Intermarché - Wanty
- Lidl - Trek
- Movistar Team
- Soudal - Quick Step
- Team dsm-firmenich PostNL
- Team Jayco AlUla
- Team Visma | Lease a Bike
- Grand tours
- Top competitors
- Final GC favorites
- Stage profiles
- Riders form
- Countdown to 3 billion pageviews
- Favorite500
- Profile Score
- Stage 21 Results
- Startlist quality
- All stage profiles
- Hardest stages
- Winners and leaders
- Prizemoney ranking
- Fastest stages
- Statistics - Statistics
- Startlist - Startlist
- More - More
- Teams - Teams
- Nations - Nations
- Route - Route
- Results - Results
- »
Hottest stages in Tour de France 2023
- Most constant rider
- Smallest sum of results
- Most bonifications
- Hottest stages
- Leader jerseys
- Best worse result
- Combative riders
- Fastest first and last hour
- Average speed per stage
- Timegap chart
- GC without TTs
- GC Without 1 stage
- GC without time bonusses
- Most GC time changes
- Points GC breakdown
- Least predictable
Grand Tours
- Vuelta a España
Major Tours
- Volta a Catalunya
- Tour de Romandie
- Tour de Suisse
- Itzulia Basque Country
- Milano-SanRemo
- Ronde van Vlaanderen
Championships
- European championships
Top classics
- Omloop Het Nieuwsblad
- Strade Bianche
- Gent-Wevelgem
- Dwars door Vlaanderen
- Eschborn-Frankfurt
- San Sebastian
- Bretagne Classic
- GP Montréal
Popular riders
- Tadej Pogačar
- Wout van Aert
- Remco Evenepoel
- Jonas Vingegaard
- Mathieu van der Poel
- Mads Pedersen
- Primoz Roglic
- Demi Vollering
- Lotte Kopecky
- Katarzyna Niewiadoma
- PCS ranking
- UCI World Ranking
- Points per age
- Latest injuries
- Youngest riders
- Grand tour statistics
- Monument classics
- Latest transfers
- Favorite 500
- Points scales
- Profile scores
- Reset password
- Cookie consent
About ProCyclingStats
- Cookie policy
- Contributions
- Pageload 0.0180s
- Training and Health
- How To…
- Live Streaming

You versus a Tour de France cyclist: Why power measurement is important?

Power is the rate at which energy is used (energy over time) and is measured in watts.
In cycling, energy is expressed in terms of work. It’s a constant snapshot of your work rate at any given moment. It’s the building block from which all power-based training flows.
A watt is a watt, whether on a bike or powering your home. So when Marcel Kittel unleashes 1,900 watts in a sprint, he could essentially power two houses at normal consumption level. Another comparison: 1 horsepower is 746 watts.
For decades, cyclists measured their performance by looking at miles per hour or heart rate. In the 1990s, elite cyclists switched to measuring their power output in watts. Since the late 1980s, companies including SRM, Powertap and Ergomo have made these devices, which measure the deflection of the crank arm using minuscule gauges or in some cases employ a specialized wheel hub.
A handlebar computer displays and stores the data. Whereas an average cyclist can produce 100 watts, a pro cyclist can average 400 watts over the final hour of a Tour de France stage.
Training intensity is the toughest variable to measure. Speed is a poor measure, as it relates more to terrain and wind. Heart rates provide a rough gauge, but they vary in response to temperature, humidity, altitude, hydration, fatigue, caffeine intake and exercise duration.
Energy delivered to the pedals and measured in watts measures the intensity of your work. Measuring power allows you to monitor your training, characterize your practice course, assess your aerodynamic sleekness and drag, and assist in pacing.
Wattage figures measure the work of applying energy to the pedals but not the total physiological energy expended to perform the task. Cyclists are about 21 to 24 percent efficient in converting chemical energy to mechanical energy during cycling, so a cyclist riding at 250 watts is expending metabolic energy at a rate of nearly 1,000 watts, or 1 horsepower.
The advantage of power monitoring is that “watts don’t lie,” writes Selene Yeager in “Every Woman’s Guide to Cycling.” Wattage figures stay exact, unlike heart rate. If you ride your standard circuit and average 160 watts where before you only managed 125, you have gotten stronger, she indicates.
To measure your wattage, you warm up and ride for 20 minutes at the highest power you can maintain. You reduce that number by 5 percent to arrive at your lactate threshold power, which is the wattage you can maintain for about an hour. With your coach, you then set up training zones of varying duration and watts.
RELATED ARTICLES MORE FROM AUTHOR

Cyclists live longer, a new study suggests

What you need to know about calories as a cyclist

Lower back pain on the bike – what should you do?

Mathieu van der Poel’s insane Strade Bianche power data revealed

Vitamin and mineral supplements could do more harm than good, says new study

3 training rides to do every week if you want to be faster
Leave a reply cancel reply.
Save my name, email, and website in this browser for the next time I comment.
EDITOR PICKS

2024 Giro d’Italia LIVE STREAM

2024 Vuelta Espana Femenina LIVE STREAM

2024 Famenne Ardenne Classic LIVE STREAM
Popular posts.

Giro d’Italia, Milan-San Remo under threat of cancellation due to coronavirus

2020 UAE Tour LIVE STREAM

Ewan storms to victory on stage 2 of UAE Tour
Popular category.
- Results 1805
- Grand Tours 1567
- Tour de France 707
- POPULAR THIS WEEK 616
- Live Streaming 575
- Giro d'Italia 548
- Interviews 382

IMAGES
VIDEO
COMMENTS
Average speed per stage. The average speed over all stages is 41.408 km/hour. The average speed for the whole race is computed by dividing the total distance by the sum of stage times of the final GC winner. In the last column the average speed up to that stage is shown. This is the average speed for the leader in the race at that stage. Stage.
The race was won by Belgian Firmin Lambot with an average speed of 24.1km/h. In the last 10 years the pace hasn't differed too much, staying around the 39 - 40km/h mark, but it does look to be ...
For many of those early years, average speeds hovered around 25 kilometers per hour, with individual stages often taking several hours to complete. The winner of the very first 1903 Tour de France achieved only 25.7 km/h average speed, while the slowest race was just 24.1 km/h in 1919. In the early years of the Tour, the sport was very much one ...
Jul 24, 2023. Denmark's Jonas Vingegaard claimed his second Tour de France victory on Sunday, completing the grueling 3-week, 3,401 kilometer competition with an average speed of 41.12 km/h (25.55 ...
The quickest time trial was earned by Rohan Dennis during the first stage of the 2015 Tour de France in Utrecht, who triumphed with an average speed of 55.5 km/h (34.5 mph). The 2013 Orica GreenEDGE team holds the record for the fastest stage win in a team time trial. They impressively covered a 25 km time trial at 57.70 km/h.
The Tour de France peloton in Paris (Photo by Chris Graythen/Getty Images)The general trend at the Tour de France, since its start in 1903, is that the speed of the riders is going upOrigina...
Average Rider: 19 to 20 mph | Tour Pro: 29 to 31 mph. Average Speed on Flat Terrain. Average Rider: 17 to 18 mph | Tour Pro: 25 to 28 mph. Maximum Sprint Power. Average Rider: 600 to 800 watts ...
A Tour de France soigneur might mix between 40 and 120 bottles for the team on each stage, which means an individual rider may throw back up to a dozen bottles or more. Average Rider: 1 to 2 Tour ...
Among the fastest five editions of the Tour de France, the 2005 edition holds the record, with an astonishing average speed of 41.7 km/h, or approximately 25.9 mph, achieved by Lance Armstrong. However, it's worth noting that Armstrong was later stripped of his titles due to doping. 2003, 2015, 2017, and 2019 Tours are also among the fastest ...
Fastest stages in the history of the Tour de France ranked by stage wins, time trials, team time trials and prologues. Join Pro to watch the 2021 Tour de France live and on-demand in Canada. HISTORY OF THE TOUR DE FRANCE HOMEPAGE. Fastest Stage (Non-TT) Winner: Speed: Stage: Year: Mario Cipollini: 50,355 km/h: Laval - Blois (194,5 km)
The average speed for professional cyclists while traversing on flat terrain is 25-28 mph. The average amateur cyclist travels about 17-18 mph while on flat ground. For many pro athletes racing in the Tour de France, being able to maintain a fast speed on flat terrain allows them to simply stay competitive with the other athletes.
Over the last several years, the winner of the tour has posted an overall average speed of right around 25mph (40kmph)-but that encompasses an entire tour. Uphill, downhill, time trial, flatland, it's all averaged at 25mph.
Table 3: Tour de France kilometers by stage profile. year flat - flat hill - flat hill - hill mt - notup mt - up 2013 1153.5 802.5 0.0 697.0 735.0 2014 1470.5 764.5 54.0 407.5 967.0 2015
In 2023, the winner of the Tour de France, Jonas Vingegaard, maintained an average speed of around 41.43 kilometers per hour. The Danish cyclist also won the famous event in 2022, with an average ...
Double Tour de France stage winner, the recently retired Irish pro rider Dan Martin was a climbing specialist. His racing weight was 62kg, which is light for his 5ft 9in height, but some shorter ...
The 2022 edition of the Tour was the fastest in the race's history. The average speed of winner Jonas Vingegaard for the 21-stage race set a new record at 42.03km/h (26.12mph) Combining every ...
The darling of the Tour. In terms of the number of victories per nation, France comes out on top, with 36 races won by a French cyclist. In second place is Belgium with 18 wins, and in third is Spain with 12. The darling of the Tour remains Eddy Merckx, holding the record of 111 days in the yellow jersey. This Belgian won 5 times the Great Loop ...
Tour de France 2024 - Official site of the famed race from the Tour de France. Includes route, riders, teams, and coverage of past Tours. Club 2024 route 2024 Teams 2023 Edition Rankings Stage winners All the videos. Grands départs Tour Culture news ...
Tour de France (2.UWT) Hottest stages in Tour de France 2021. Overview of the average temperature during each stage. The temperature is logged every 10 minutes during the race, of these datapoints the average is taken. # Stage; Menu. Winners and leaders; Most constant rider; Smallest sum of results; Won how;
21.4. 20. Stage 2 | Vitoria-Gasteiz - San Sébastián. 21.2. 21. Stage 6 | Tarbes - Cauterets-Cambasque. 21.1. The stage with the highest average temperature in Tour de France 2023 is Stage 7 | Mont-de-Marsan - Bordeaux with an average temperature of 32.1 degree celsius.
A handlebar computer displays and stores the data. Whereas an average cyclist can produce 100 watts, a pro cyclist can average 400 watts over the final hour of a Tour de France stage. Training intensity is the toughest variable to measure. Speed is a poor measure, as it relates more to terrain and wind. Heart rates provide a rough gauge, but ...