- radicalstorage.com
- Français ( French )
- Deutsch ( German )
- Italiano ( Italian )


Ecotourism and Sustainable Tourism Statistics 2024
- Post author By Giacomo Piva
- Post date April 17, 2024
Ecotourism is a type of travel that is gaining in popularity with travelers being more conscious of their carbon footprint. In this analysis, we look into some of the latest ecotourism statistics, and see how sustainable tourism is changing the travel industry.
Key ecotourism statistics
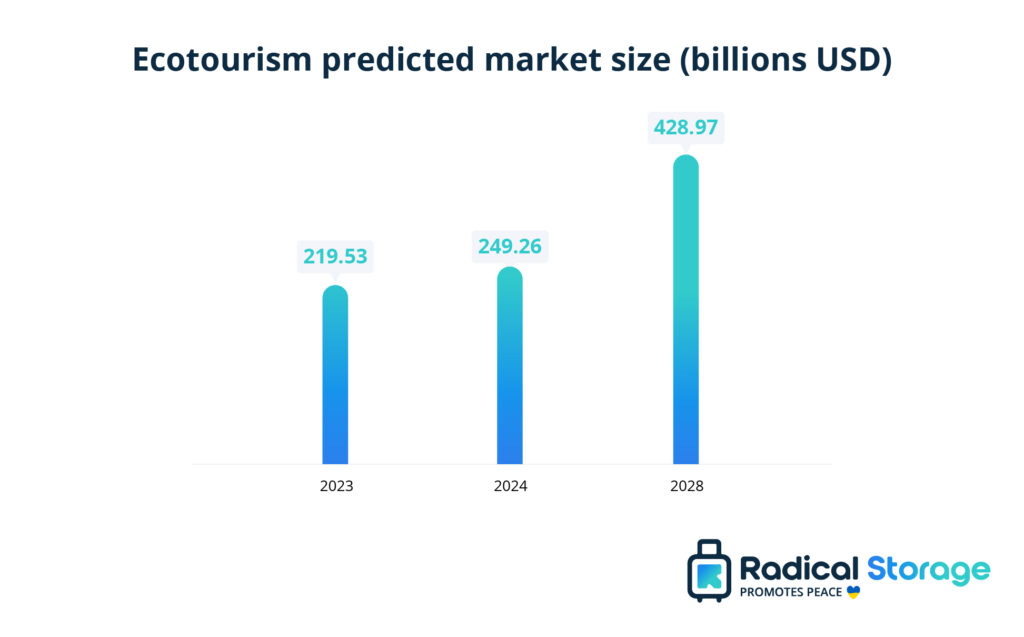
- The global ecotourism market size is expected to have increased by 13.5% to $249.16 billion in 2024 , from $219.53 billion in 2023, and is predicted to reach $428.97 billion in 2028 .
- Choosing sustainable accommodation costs an average of $151 less per night , and was an average of 39% cheaper than non-sustainable options.
- A sizeable 80% of travelers said that traveling more sustainably is important to them.
- Over half (53%) of global travelers say they are looking for accommodation that combines comfort with innovative sustainability features in 2024 .
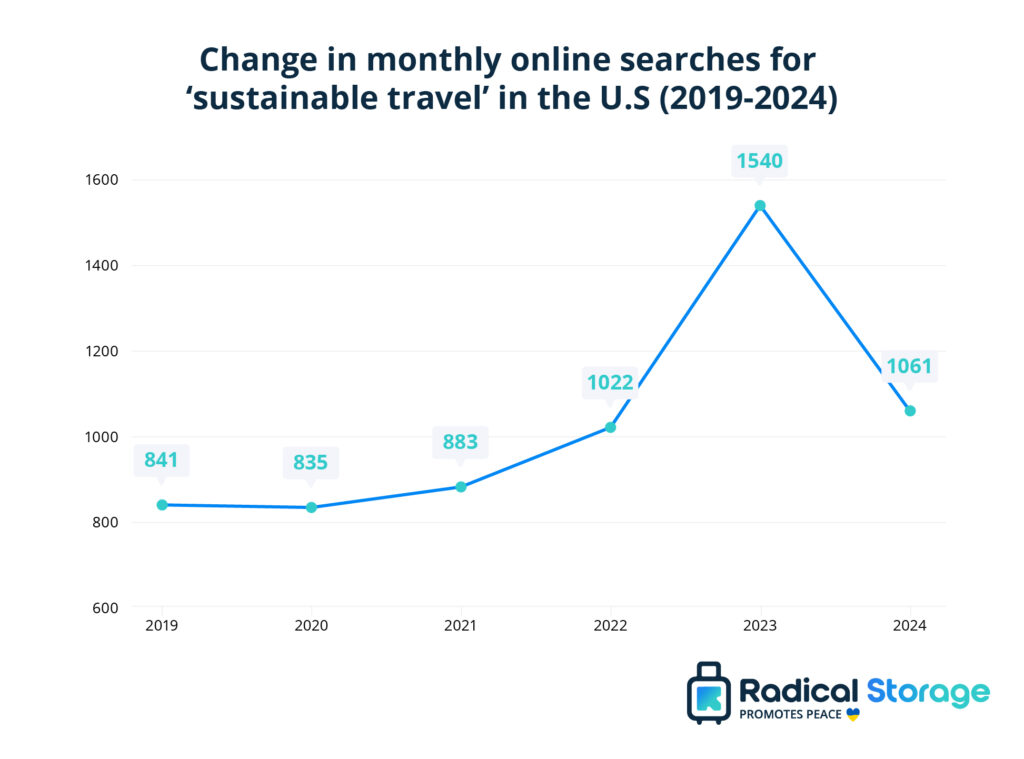
- Online searches for ‘sustainable travel’ increased by 26% between March 2019 and March 2024.
- Three in five (62%) travelers said that they planned to stay in some form of sustainable accommodation at least once in the next year.
- The majority of global travelers (66%) said they wanted to have authentic travel experiences that represent the local culture and communities .
- One-third (33%) of travelers said they would go on trips closer to home in order to reduce their carbon emissions .
What is ecotourism?
Ecotourism is a type of tourism that involves traveling responsibly to natural areas, conservation of the environment, and maintaining the well-being of local people.
Also known as sustainable tourism, this type of travel is on the rise as travelers look to explore trips that reduce their impact on the environment and support local communities. The phrases ‘ecotourism’ and ‘sustainable tourism’ were first used in books in the 1980s and have grown in popularity since then.
Popular ecotourism activities
Some common ecotourism activities that travelers may take part in on this type of trip include:
- Small group eco tours
- Hiking or trekking through nature
- An eco-friendly cruise
- Tree planting trips
Ecotourism market size
By the end of 2024, the ecotourism market size globally is predicted to grow to $249.16 billion, an increase of 13.5% from $219.53 billion in 2023. By 2028, the global ecotourism market size is expected to increase to $428.97 billion, with a compound annual growth rate (CAGR) of 14.5%. [ 1 ]
How many people travel sustainably?
A third (33%) of travelers surveyed said that they had stayed in sustainable accommodation in the past year. Based on the over 65.3 million American citizens who traveled abroad in 2023 (Oct 22 – Oct 23), this means approximately 21.55 million people chose sustainable accommodation in 2023.
Public interest in sustainable tourism
We collected data on online Google searches for sustainable tourism-related phrases to determine the change in public interest in this topic over time.
Online searches for the phrase ‘sustainable travel’ have been on the rise in the U.S., with 841 monthly searches in March 2019 growing to 1,061 in March 2024, an increase of 26%. However, searches for ‘sustainable travel’ peaked in April 2023 at 1,856.
A quarter of travelers have said that they have seen sustainable accommodation options while looking at online travel sites in the past, and 29% said they would actively look for information on sustainability before making a booking.
Of those asked, 80% said that traveling more sustainably is important to them; this figure has increased from 71% in 2022. A further 43% would consider themselves knowledgeable about sustainability, with the news and social media providing the most information on the topic. [6]
Why do people choose sustainable travel?
There are a number of reasons why someone would specifically look for sustainable accommodation or eco-friendly travel providers. Almost half (46%) of travelers surveyed said that they had used sustainable accommodation during the past 12 months. Some of the reasons travelers highlighted for staying in these places include:
- To help reduce their impact on the environment (31%)
- They believe that sustainable properties are better for the local community (24%)
- They wanted to have a travel experience that was more relevant to the local area (21%)
Of those who said they hadn’t stayed in sustainable accommodation during the past year, 31% said they didn’t know they were an option, and 29% said they didn’t know how to find them. These figures suggest that more can be done to make these locations more accessible to those who might be interested in pursuing ecotourism. [2]
Attitudes towards sustainable travel
Some global travelers have a perception of ecotourism and sustainable destinations which makes them less inclined to book this kind of trip. Some of the reasons travelers said they wouldn’t choose sustainable accommodations were that other types of travel appealed to them more (32%) and that sustainable travel doesn’t provide the luxury they want (27%).
Barriers to sustainable tourism
Travelers cited a number of barriers that they felt made it more difficult to choose eco-friendly travel options. Over half (51%) of people think that there are not enough sustainable travel options available, while 44% don’t know where to find sustainable options.
Three-quarters (75%) of travelers say they are looking for authentic experiences that represent the local culture, but 40% don’t know how or where to find tours and activities that give back to the local community. [6]
Why people wouldn’t choose sustainable travel options
Almost a third (32%) of people said they wouldn’t choose sustainable travel because other travel options appeal to them more, while 29% believed there weren’t any sustainable options in their chosen destination.
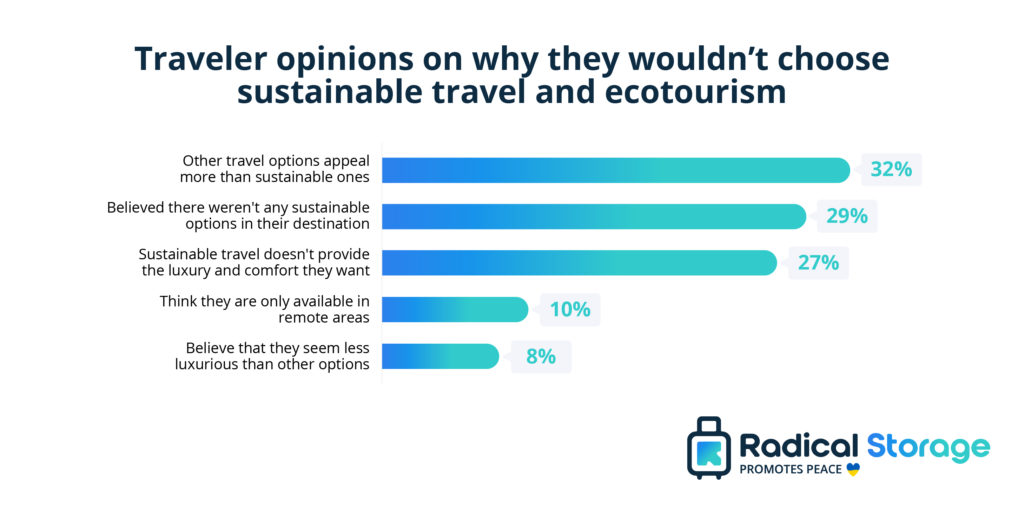
Other reasons people said they hadn’t considered booking a sustainable trip were that they thought there weren’t any available in their chosen destination, or they thought they were only in remote areas. This again shows that ecotourism companies can do more to expand their reach and bust some of the common myths about these types of accommodation.
The costs of ecotourism
When looking for more eco-friendly travel options, it can seem that this type of travel is more costly than more traditional options. This may be because sustainable tourism spots are often managed by smaller local businesses rather than large global travel companies.
Almost half (49%) of people surveyed believe that more sustainable travel options are too expensive; this figure has increased by 11% since 2022. In addition to this, 47% of people would like more tips on how to travel sustainably on a budget. [6]
But there are many ways that eco-friendly travel can be cheaper compared to other options. For example, those looking to travel within the US could make considerable savings by using trains instead of taking a flight, especially when according to the IATA, air travel produces 2.5% of the world’s greenhouse gas emissions.
Cost savings from taking a train over a flight
The data below shows the average cost saving someone could make by taking the train between popular destinations in the US instead of a flight. Taking the train to Portland from Seattle would cost an average of $400 less than taking a flight.
While it may seem like taking the train is less time efficient, with a Seattle to Portland train taking around three and a half hours, compared to a 55-minute flight, when factoring in airport wait times and security queues, this can easily add a couple of hours onto the total plane journey.
Ecotourism and accommodation cost
We wanted to know what the average cost difference is for tourists who want to opt for more sustainable hotels and accommodation compared to ‘regular’ non-eco touristic options. We reviewed the ten most popular city break destinations and compared ecotourist accommodation to regular options to see what the difference may be.
On average, opting for sustainable accommodation costs $151 less per night, and is an average of 39% cheaper than non-sustainable options. This amount will likely be quite different when solely reviewing cheap hostels, or dorms, but it may be cheaper than people think to get a more sustainable hotel option.
Our analysis reviewed the price of apartments, hotels, and aparthotels that were ‘Top reviewed’ on Booking.com, with and without the ‘Travel sustainably’ filter they offer. Data reflects the cost of hotels for a November 2023 booking in the top ten visited cities as stated by Euromonitor [5] Paris , Dubai , Amsterdam , Madrid , Rome , Berlin , New York , London , Munich , and Barcelona .
Ecotourism and local communities
Engaging with the local community is a key part of ecotourism as it supports smaller businesses and directs spending to local people rather than large travel companies who may engage in less sustainable practices.
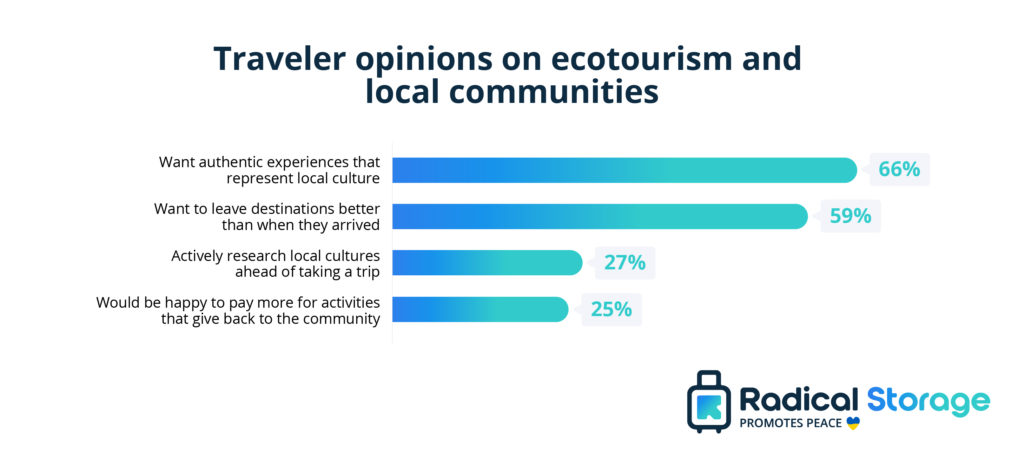
Data shows that global travelers are interested in having cultural experiences and giving back to the local communities in places that they visit. Two-thirds (66%) of global travelers said they want an authentic experience representing the local culture, and 27% said they actively research a destination’s local culture before visiting.
Another survey on travel predictions for 2022 found that 58% of travelers think it’s important that their trip benefits the local community, and 29% said that they would do more research into the effect their visit will have on local communities. [4]
Sustainable transport
When it comes to traveling, transport is one of the most important aspects to consider, especially if you’re making an effort to travel in a sustainable way. It is important to choose the train for long-distance travel: set down the car and depart from stations in London , Paris , Milan , Rome , Venice , Prague , Budapest , Edinburgh , Barcelona , Madrid , Amsterdam , Dublin or Valencia , so you can enjoy a more environmentally sustainable trip.
Below are some statistics surrounding sustainable transport and how people are planning to change modes of transport to reduce their carbon footprint.
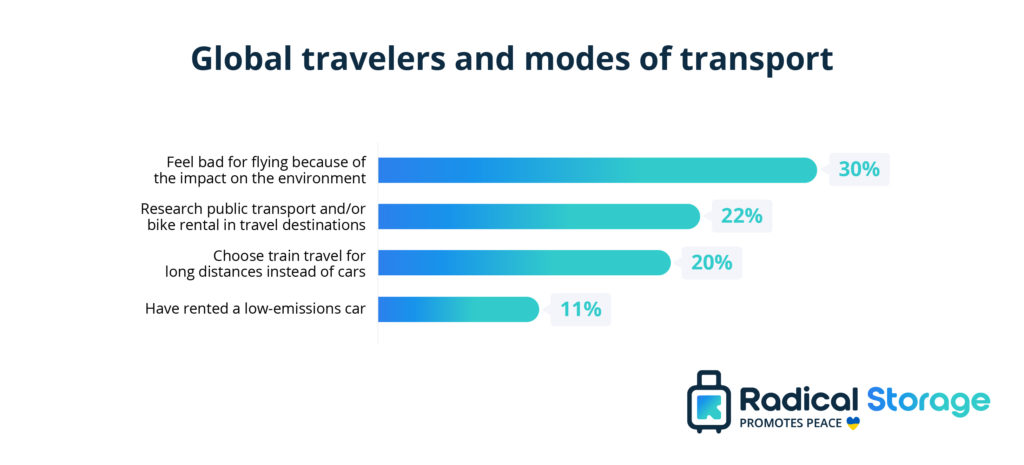
Choosing modes of transport
Statistics show that 30% of global travelers feel bad or ashamed about flying when they travel because of the impact on the environment. Almost a quarter (22%) say they research public transport links or bike rental options when they travel, while 20% choose trains over cars for long journeys, and only 11% have rented a low-emissions car when traveling.
Planning transport for future trips
Of those asked, three-quarters (75%) of global travelers said they planned to use more eco-friendly transport like bikes or public transport on their next trip, instead of taxis and rental cars.
As well as this, 28% said they would take a longer journey to their destination by using trains instead of cars or planes, in order to reduce their carbon emissions.
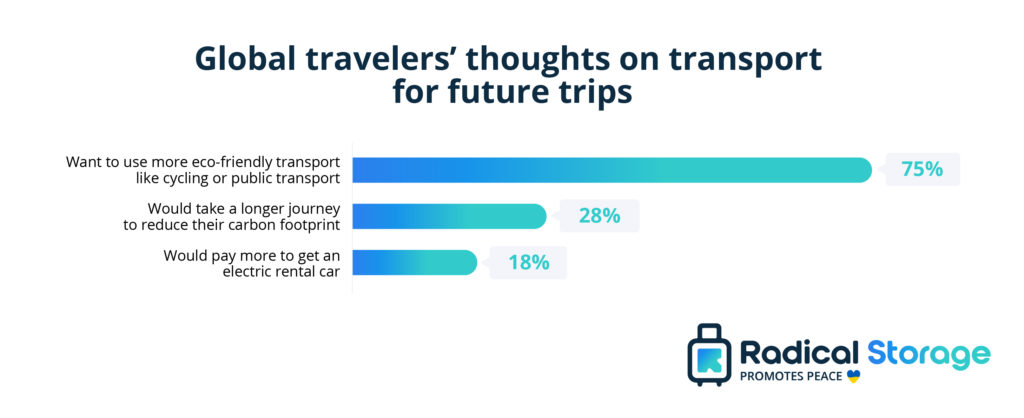
When it came to car rentals, 18% of respondents said they would pay more to rent an electric car instead of a gas car on their travels. There was no data on how much extra individuals would be willing to pay for this more eco-friendly tourism option though.
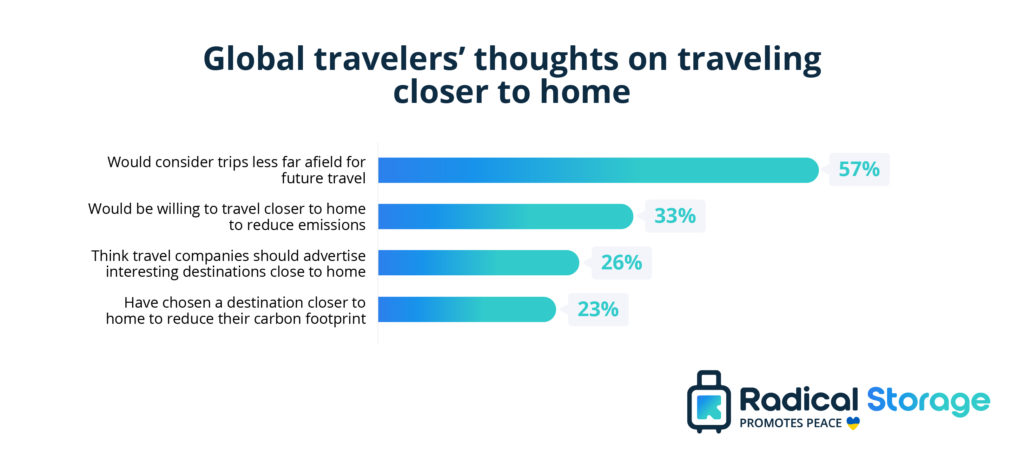
Ecotourism and staycations
Taking trips that are closer to home and require less travel via planes is one way of traveling more sustainably and with the environment in mind.
More than half (57%) of people said they would consider going on trips that weren’t as far afield in the future, and one-third (33%) would be willing to do so to reduce their carbon emissions. Almost a quarter (23%) said they have already chosen to travel to a destination closer to home in order to limit their effect on the environment.
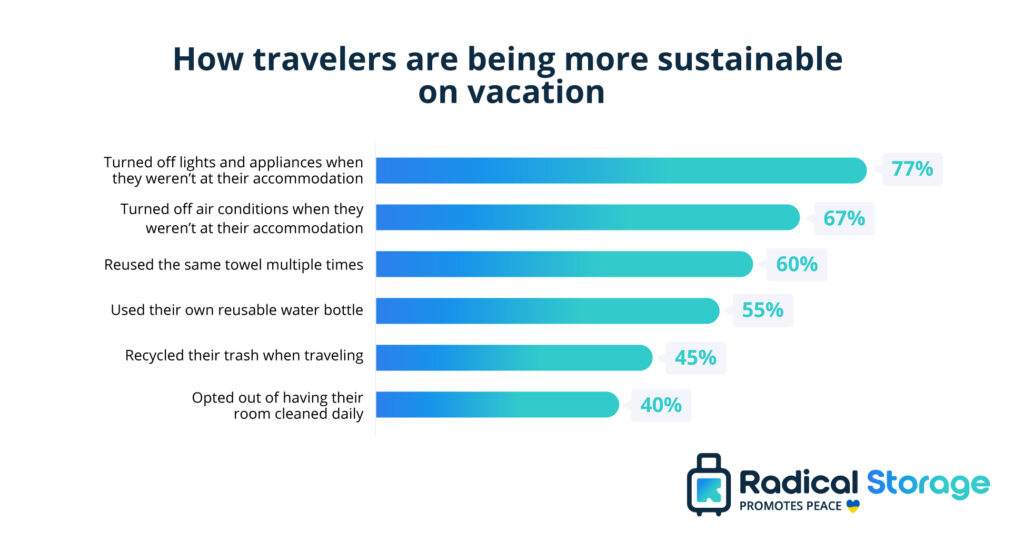
How travelers are being more sustainable on vacation
Travelers are taking a number of steps to make themselves more eco-friendly when taking a trip. Three-quarters (77%) regularly turn off lights and appliances at their accommodation when they weren’t there, and 67% turn off air conditioning. [6]
What accommodation providers can do to be more eco-friendly
Many travelers believe that hotels and other accommodation providers could do more to improve their sustainability.
- Over one-third (35%) of people said they think heating and air conditioning and hotels should be controlled by in-room keycards or sensors in order to save energy.
- Accommodation providers should give visitors more information about local culture, heritage, ecosystems and etiquette when visiting a location (32%).
- More than a quarter (27%) would choose to opt out of having their room cleaned daily so that water usage could be reduced.
- Some would prefer to only use reusable cutlery and plates for meals and room service rather than disposable items (27%).
While things like reducing water usage or cutting down on single-use items are relatively quick things to implement, other measures require more time and investment to achieve. In the short term, hotels can focus on simpler changes, but a longer-term sustainability plan would be needed for more complex changes.
2024 predictions for ecotourism
A study by Booking.com found that travelers are continuing to seek out sustainable ways to travel in 2024. More than half (53%) say they are looking for accommodation that combines comfort with innovative sustainability.
Additionally, 60% of travelers say they would like to use sustainable travel apps that unlock rewards for sustainable decisions. 44% say they’d like to visit less touristy spots and 47% say they’re planning experiences to connect with local people in less traveled areas. [7]
Benefits of sustainable travel
Ecotourism has a number of benefits for the environment and local communities as well as travelers. Below are some of the key benefits of sustainable travel.
- Less impact on the environment – Staying in locally run accommodation and eating local food helps reduce your ecological impact as you’re not relying on imported goods. By eating local produce and visiting independent restaurants, you can enjoy fresher food that has less of a carbon footprint.
- Supports local communities – Using sustainable accommodation and local companies, you support the community by directly paying into their economy. Many locations where tourism is operated by large companies can miss out on this financial benefit. Using providers who work with local people can help give this benefit directly back to the community.
- Helps conserve wildlife ethically – Some tourist attractions involving animals can be popular for visitors, but are not necessarily good for the animals themselves. A lot of attractions like elephant riding and tiger meet-and-greets are not run ethically, so sustainable tourism involves educating yourself about these practices. Instead, look for organisations focused on conservation and consider volunteering if you’d like to experience some amazing wildlife.
[1] The Business Research Company, ‘Ecotourism Global Market Report 2024’ ( https://www.thebusinessresearchcompany.com/report/ecotourism-global-market-report )
[2] Booking.com, ‘2022 Sustainable Travel Report’ ( https://globalnews.booking.com/download/1161485/booking.comsustainabletravelreport2022final.pdf )
[3] Travel Incorporated, ‘Sustainable Travel Doesn’t Have To Cost More’ ( https://www.travelinc.com/sustainable-travel-doesnt-have-to-cost-more/ )
[4] Booking.com, ‘2022 Travel Predictions’ ( https://www.booking.com/c/trends/travelpredictions2022.en-gb.html )
[5] Euromonitor International, ‘Top 100 City Destinations Index 2021’ ( https://go.euromonitor.com/rs/805-KOK-719/images/wpTop100CitiesIndex2021-v0.4.pdf )
[6] Booking.com, ‘Sustainable Travel Report 2023’ ( https://globalnews.booking.com/download/31767dc7-3d6a-4108-9900-ab5d11e0a808/booking.com-sustainable-travel-report2023.pdf )
[7] Booking.com, ‘Travel Predictions 2024’ ( https://www.booking.com/c/trends/travelpredictions2024.en-gb.html )

By Giacomo Piva
Giacomo Piva, CMO and Co-founder at Radical Storage Giacomo Piva has worked in the travel industry since 2008 across multiple niches including tourist transportation, luxury travel, and ecotourism. He now focuses on growing the global luggage network, Radical Storage , which is currently available in over 500 cities, in the likes of London, Paris, New York, and Rio de Janeiro. Giacomo has a bachelor's degree in Communication Science and an in-depth experience across travel marketing, especially in improving a brand’s digital presence within the industry.
World Bank Report: Investing in Protected Areas Reaps Big Rewards
WASHINGTON, June 14, 2021 – A new World Bank report released today shows that for every dollar governments invest in protected areas and support for nature-based tourism, the economic rate of return is at least six-times the original investment.
The report, “ Banking on Protected Areas: Promoting sustainable nature-based tourism to benefit local communities ” found that the original investment triggered a chain of benefits for local businesses and households – even for those not directly connected to the tourism sector. Given these economic benefits, the report argues that the promotion of sustainable tourism in protected areas should be included in COVID-19 economic recovery plans, an investment that creates local jobs, improves incomes and protects biodiversity.
“Prior to the pandemic, there were more than 8 billion visits a year to marine and terrestrial protected areas, providing a vital source of income for communities who rely on tourism. As countries emerge from the pandemic and rebuild their tourism sectors, investing in protected areas is a win for conservation and for development,” said Karin Kemper, World Bank Global Director for Environment, Natural Resources and Blue Economy.
When tourists visit protected areas, they pay park entry fees, which provide direct revenues to governments, and they also spend money on hotels, meals, transportation, souvenirs, and other tourism services that stimulate the local economy. When the sum of these direct and indirect economic benefits is calculated, it provides an estimate of the rate of return on public investment in protected areas and nature-based tourism.
The report looked at four countries – Brazil, Fiji, Nepal and Zambia – and found that . The rates of return were impressive:
- Six times the amount invested for Brazil’s Abrolhos Marine Park.
- Eight times the amount invested for Nepal’s Chitwan National Park.
- Sixteen times the amount invested for Zambia’s Lower Zambezi Park.
- Twenty-eight times the amount invested in Zambia’s South Luangwa National Park.
The report also looked at how the promotion of nature-based tourism in protected areas impacts economic development and create jobs. The findings show that for every additional dollar spent by a tourist, local incomes increase by more than a dollar. This means that the revenues from nature-based tourism mostly stayed and accrued additional benefits in local economies. Specifically, for every dollar spent in:
- Brazil’s Abrolhos Marine Park, local incomes increase by US$ 1.74.
- Fiji’s Mamanuca Islands, local incomes increase by US$ 1.83.
- Nepal’s Chitwan National Park, local incomes increase by US$ 1.78.
- Zambia’s Lower Zambezi Park, local incomes increase by US$ 1.82.
Nature-based tourism creates jobs, with people hired as hotel employees and tour operators, for example. It also boosts employment in other sectors as demand rises for tourism-related goods and services. The report finds that before the pandemic, protected areas annually provided:
- 7,463 new jobs in the Lower Zambezi National Park in Zambia;
- 28,210 new jobs were generated in South Luangwa National Park in Zambia;
- 6,412 new jobs were generated in the Mamanuca Islands of Fiji; and
- 4,309 new jobs were generated in Chitwan National Park in Nepal.
The report includes a range of policy actions to promote more sustainable tourism in protected areas. These actions can be grouped into three interconnected categories: (1) protecting natural assets; (2) growing and diversifying the tourism business; and (3) sharing benefits with local communities. Within each category there are multiple policy recommendations, including increasing public investment in protected areas, enhancing the capacity of protected area managers, developing concession policies to promote tourism in protected areas, and formalizing benefit sharing arrangements with local communities.
“Banking on Protected Areas: Promoting sustainable nature-based tourism to benefit local communities” is available for download here . It was made possible with financial support from Global Wildlife Program , PROBLUE , PROFOR , and WAVES .
World Bank Group COVID-19 Response
Since the start of the COVID-19 pandemic, the World Bank Group has committed over $125 billion to fight the health, economic, and social impacts of the pandemic, the fastest and largest crisis response in its history. The financing is helping more than 100 countries strengthen pandemic preparedness, protect the poor and jobs, and jump start a climate-friendly recovery. The Bank is also providing $12 billion to help low- and middle-income countries purchase and distribute COVID-19 vaccines, tests, and treatments.
Website: www.worldbank.org/
Facebook: http://www.facebook.com/worldbank
Twitter: http:// www.twitter.com/worldbank
YouTube: http:// www.youtube.com/worldbank
For broadcast requests:
- REPORT: Banking on Protected Areas: Promoting Sustainable Protected Area Tourism to Benefit Local Economies
- PUBLICATION PAGE: Banking on Protected Areas: Promoting Sustainable Protected Area Tourism to Benefit Local Economies
Loading metrics
Open Access
Peer-reviewed
Research Article
A Global Perspective on Trends in Nature-Based Tourism
* E-mail: [email protected]
Affiliation Department of Zoology, University of Cambridge, Cambridge, United Kingdom
Affiliation Conservation Science Program, World Wildlife Fund–US, Washington, DC, United States of America
Current address: United Nations Environment Programme World Conservation Monitoring Centre, Cambridge, United Kingdom
Affiliation Fauna and Flora International, Cambridge, United Kingdom
- Andrew Balmford,
- James Beresford,
- Jonathan Green,
- Robin Naidoo,
- Matt Walpole,
- Andrea Manica
- Published: June 30, 2009
- https://doi.org/10.1371/journal.pbio.1000144
- Reader Comments
Reports of rapid growth in nature-based tourism and recreation add significant weight to the economic case for biodiversity conservation but seem to contradict widely voiced concerns that people are becoming increasingly isolated from nature. This apparent paradox has been highlighted by a recent study showing that on a per capita basis, visits to natural areas in the United States and Japan have declined over the last two decades. These results have been cited as evidence of “a fundamental and pervasive shift away from nature-based recreation”—but how widespread is this phenomenon? We address this question by looking at temporal trends in visitor numbers at 280 protected areas (PAs) from 20 countries. This more geographically representative dataset shows that while PA visitation (whether measured as total or per capita visit numbers) is indeed declining in the United States and Japan, it is generally increasing elsewhere. Total visit numbers are growing in 15 of the 20 countries for which we could get data, with the median national rate of change unrelated to the national rate of population growth but negatively associated with wealth. Reasons for this reversal of growth in the richest countries are difficult to pin down with existing data, but the pattern is mirrored by trends in international tourist arrivals as a whole and so may not necessarily be caused by disaffection with nature. Irrespective of the explanation, it is clear that despite important downturns in some countries, nature-related tourism is far from declining everywhere, and may still have considerable potential both to generate funds for conservation and to shape people's attitudes to the environment.
Author Summary
Nature-based tourism is frequently described as one of the fastest growing sectors of the world's largest industry, and a very important justification for conservation. However, a recent, high profile report has interpreted declining visit rates to US and Japanese national parks as evidence of a pervasive shift away from nature tourism. Here we use the largest database so far compiled on trends in visits to Protected Areas around the world to resolve this apparent paradox. We find that, while visit rates—measured in two different ways—are indeed declining in some wealthy countries, in roughly three-quarters of the nations where data are available, visits to Protected Areas are increasing. Internationally, rates of growth in the number of visits to such areas show a clear negative association with per capita income, which interestingly is matched by trends in foreign arrivals as a whole. Our results therefore suggest that, despite worrying local downturns, nature-related tourism is far from declining everywhere, and may still have considerable potential to generate funds for conservation and engage people with the environment.
Citation: Balmford A, Beresford J, Green J, Naidoo R, Walpole M, Manica A (2009) A Global Perspective on Trends in Nature-Based Tourism. PLoS Biol 7(6): e1000144. https://doi.org/10.1371/journal.pbio.1000144
Academic Editor: Walt V. Reid, The David and Lucile Packard Foundation, United States of America
Received: February 9, 2009; Accepted: May 20, 2009; Published: June 30, 2009
Copyright: © 2009 Balmford et al. This is an open-access article distributed under the terms of the Creative Commons Attribution License, which permits unrestricted use, distribution, and reproduction in any medium, provided the original author and source are credited.
Funding: This work was supported by a grant from the Natural Capital Project, through The Nature Conservancy. The funders had no role in study design, data collection and analysis, decision to publish, or preparation of the manuscript.
Competing interests: The authors have declared that no competing interests exist.
Abbreviations: GDP, gross domestic product; PA, protected area; PPP, purchasing power parity
Introduction
Across southern Africa, nature-based tourism reportedly now generates roughly the same revenue as farming, forestry, and fisheries combined [1] . Worldwide, tourism as a whole has been estimated to account for roughly 10% of gross domestic product (GDP) [2] , with wildlife viewing and outdoor recreation (much of it centred on protected areas [PAs]) reportedly making up one of its fastest growing sectors [3] – [5] . Though statistics like these are rarely supported by detailed data, they underpin widespread recognition that nature-based tourism is an important ecosystem service [6] , capable of generating substantial resources for both conservation and local economic development [3] , [7] , [8] . This is particularly significant given that PAs are under increasing pressure to provide economic justification for their existence [9] – [12] .
This positive perspective stands in sharp contrast to growing concerns about an emerging disconnect between people and their natural environments. Increasing urbanisation and the rise of sedentary, indoor pastimes (such as television, the Internet, and video games) have been linked to a reduction in informal, outdoor recreation (Pyle's “Extinction of Experience” [13] ), with potentially serious consequences for childhood development, mental and physical wellbeing, and environmental knowledge and concern [14] – [21] . Many see this as a major challenge for biodiversity conservation [13] , [14] , [21] , [22] : if people no longer experience and know their natural environments, how can they be expected to care about them?
These worries have been further fuelled by a recent and widely publicised paper examining trends in 16 measures of outdoor recreation (14 from the United States, plus one each from Japan and Spain [23] ). This analysis showed that, expressed per head of population, visits to natural areas in the United States and Japan (as well as participation in duck-hunting and fishing in the United States, but not hiking, camping, or other hunting) have declined since the late 1980s (though for contrasting US figures, see [24] ). From these per capita trends the authors conclude there has been “…a fundamental and pervasive shift away from nature-based recreation” [23; see also 21,25]. However, the paper produced no evidence of declines outside the United States and Japan (and per capita national park attendance in Spain, the only other country sampled, has not declined), raising the possibility that the reported shift may not be universal.
To date, lack of data has meant no study has looked at trends in nature-based tourism across more than a handful of countries. Here, we use newly compiled information on visitor numbers to 280 PAs in 20 countries (Australia, Canada, Chile, China, Ecuador, Ghana, India, Indonesia, Japan, Korea, Madagascar, Peru, Philippines, Rwanda, South Africa, Sri Lanka, Tanzania, Uganda, UK, United States) between 1992 and 2006 to explore the generality of the United States and Japan results and to understand the apparent mismatch with the claim that globally, nature-based tourism is on the rise. Importantly, because we are interested in trends in nature tourism as a whole as well as individual interest in nature, we analyse changes in both total visit numbers and visit numbers corrected for national population size. The latter are a better reflection of per capita interest in a country's PAs [23] , but the former are a more sensible proxy for trends in the overall benefit derived from nature tourism as an ecosystem service.
Our analysis of standardised rates of change in PA visit numbers provides limited support for the previously reported declines in nature-based activities in the United States. Using total visit numbers, only 14 out of 51 US PAs for which we could get data showed significant decreases in visit number (at p <0.05), while 11 exhibited significant increases. Adjusting for changes in national population size, the number of US PAs experiencing significant declines rose to 27 and the number with increasing attendance fell to just 6. Clearly, the decline in per capita visitation to US PAs we could sample is real, but arises largely because absolute attendance has been almost static despite a growing national population. In Japan, the only PA for which we had data showed a nonsignificant decline in visits, whether expressed in terms of total or per capita visit numbers.
More interestingly, these weak declines in two countries are far from globally typical: instead, visitor trends show marked geographical variation. When we pooled standardised rates of change within continents, rather than being negative we found that trends in total visit numbers were not significantly different from zero in North America or Australasia, and were on average positive in Africa, Europe, Asia, and Latin America ( Figure 1A ; F 5,274 = 10.2, p <0.001; in post hoc tests only Australasia and North America had rates of changes not significantly different from zero at p <0.05). There was similar broad-scale variation when we compared trends in per capita visit numbers across continents ( Figure 1B : F 5,274 = 10.4, p <0.001, with significant positive trends again everywhere apart from Australasia and North America).
- PPT PowerPoint slide
- PNG larger image
- TIFF original image
(A) Changes in total visit number; (B) changes in per capita visit number.
https://doi.org/10.1371/journal.pbio.1000144.g001
These patterns of spatial heterogeneity were confirmed when data were analysed by country ( Table S1 ). Total visit numbers to PAs on average grew in 15 out of the 20 countries sampled and fell in four (with Uganda showing no change). Even allowing for population growth, per capita visit numbers rose in 14 countries (with Uganda and Australia added to the list of countries showing falling visitation). The only country we sampled outside the Organisation for Economic and Co-Operation Development (OECD) with consistently falling PA visitation was Indonesia.
National rates of change are closely associated with wealth. In contrast to the United States and Japan, poorer countries typically had increasing numbers of PA visits, with median standardised rates of growth in total visit numbers showing a clear negative relationship with per capita GDP ( Figure 2A ; regression weighted by number of PAs sampled per country: adjusted r 2 = 0.52, n = 20 countries, F 1,18 = 21.8, p <0.001). This result was not due to correlated variation in population growth, because the negative link with rising wealth held when visit numbers were adjusted for changes in population size ( Figure 2B ; weighted regression of median standardised rates of change in per capita visit numbers against per capita GDP: adjusted r 2 = 0.43, n = 20, F 1,18 = 15.5, P <0.001). As a further check for any confounding effects of population growth, we compared changes in total visit numbers with national population growth rates, but found no association between the two ( Figure S1 ; weighted regression: adjusted r 2 = 0.07, n = 20, F 1,18 = 2.6, NS). The tendency for PA visitation to be increasing in poorer countries appears to be independent of population growth.
https://doi.org/10.1371/journal.pbio.1000144.g002
Our dataset on PA visits has far broader geographical coverage than any others we are aware of, yet yielded no evidence to support the idea of a consistent global decline in nature-based recreation. Instead it appears that falling visitation is mostly restricted to a few well-off countries. When we adjusted visit numbers for population growth to examine individual participation in nature recreation we were able to replicate previously reported declines in per capita visit number in the United States and Japan [23] , but also found that in most other countries population-adjusted visit numbers have been increasing.
These patterns were more marked when we looked at trends in PA visitation as a whole, using total numbers of PA visits. We found these are growing on four out of six continents and in 15 of the 20 countries for which we could get data. These changes in average visit rates are quite well predicted by wealth, but are unrelated to national population growth—confirming the finding from the per capita analysis that it is not the case that visitation is increasing simply where populations are growing rapidly. Instead, it appears that PA visitation is generally growing, but at a progressively lower rate (eventually falling below zero) with rising affluence.
We do not have a ready explanation for this negative link between visit growth and wealth, and believe this will be hard to unravel from correlational analyses alone. It could be related to the emergence of “videophilia” [20] , or to other aspects of growing urbanisation or increasingly sedentary lifestyles [14] – [19] , [21] . These ideas are plausible, but direct evidence for them is sparse. Given that very many potential drivers co-vary with one another and with time, causality may be difficult to establish until more detailed data become available, or an experimental approach is adopted.
One nonexclusive alternative explanation for the patterns of changing PA visitation that we see could be that many formal protected areas in richer countries are becoming increasingly crowded and thus less attractive to nature enthusiasts (J. du Toit, personal correspondence). Overcrowding and the perception of overcrowding have been noted as a concern of visitors to many larger US National Parks for over a decade [26] , [27] . If would-be visitors are instead switching to less publicised sites where visitors are not counted, overall visit rates to natural areas in these countries could be stable or even growing, yet still recorded as declining.
One other explanation for the pattern we see could be that there is a shift in preference away from domestic destinations as nature-focused tourists become wealthier and alternative wildlife attractions in less costly developing countries become more accessible [28] , [29] . Strikingly, the patterns we uncovered for PA visitor trends are echoed by those for international tourism more generally: standardised national rates of change in all foreign arrivals (from [30] ) co-vary positively with median changes in total and per capita PA visit numbers (for total visit numbers, Figure 3A ; regression weighted as in Fig. 2A , r 2 = 0.34, n = 19 countries excluding Rwanda, for which no arrival information was available: F 1,17 = 10.2, p <0.01; for per capita visit numbers, Figure 3B ; weighted regression: r 2 = 0.25, n = 19, F 1,17 = 7.0, p <0.05). Changes in foreign arrivals also show a negative relationship with per capita GDP ( Figure S2 ; r 2 = 0.29, n = 19, F 1,17 = 8.2, p = 0.01), falling to zero growth in the United States. These results suggest that trends in nature-based recreation might be less driven by attitudes to nature per se and more to do with how rising wealth and the emergence of new destinations influence the dynamics of recreation as a whole [31] , [32] . To resolve this, more data would be needed than we were able to obtain on the nationalities and motivations of visitors to individual PAs.
https://doi.org/10.1371/journal.pbio.1000144.g003
Regardless of the underlying drivers, our analyses indicate that it is premature to conclude that PA visit data indicate a general and pervasive shift away from nature tourism. This is apparently occurring in a few developed countries, where it is worrying, and where it certainly demands more attention. But in contrast, in most developing countries visits to protected areas are growing at rates that mirror general increases in tourism and travel—in many cases by more than 4%/y ( Figure 2A ). This is especially significant for conservation, given that, unlike other nonconsumptive uses of ecosystems, nature-based tourism produces tangible financial flows that can, if carefully developed, be of direct benefit to local decision-makers [7] – [9] , [33] , [34] .
Tourism can often provide a strong incentive for protection in biodiversity-rich areas [8] , and formal designation of such sites can raise their profile and influence tourism visitation [35] . However, increasing visitor numbers alone is no guarantee that tourism revenues will be reinvested in conservation [36] . Equally, recording visitor numbers does not equate with the much less common practices of monitoring or managing tourism impacts [37] . International nature tourism raises other important worries—about CO 2 emissions, about its vulnerability to changing fashions, about disturbance to wildlife and nearby people, and about how far its revenues filter down to local communities [24] , [34] , [38] – [41] . Nature-based tourism is only likely to be sustainable under certain conditions of effective planning, management, and local participation [7] , [42] – [44] . However, to the extent that these concerns can be addressed, our results argue that far from having a diminishing role, nature-based recreation has the potential in many parts of the world to make a growing contribution to both conservation and sustainable development.
Materials and Methods
Somewhat surprisingly, there is no global database or consistent set of national statistics summarising trends in nature-based tourism. Instead, like previous authors [23] we infer changes in the sector as a whole from visits to PAs. We compiled information on annual visitor numbers to terrestrial PAs (including any listed in [45] ). PA visits are among the most frequent forms of nature-based recreation recorded in the United States [23] , and we suggest they are likely to account for an even greater proportion of nature recreation in other countries, where alternatives are less developed. We collected data from as many sources as possible: the grey and published literature, personal contacts, and especially the World Wide Web. The methods used to record visitors were rarely reported in detail, but varied widely, including dedicated studies, gate receipts, and traffic counts [46] . There are also likely to be biases in some datasets, with corruption, for example, perhaps leading to systematic under- (and in some cases, maybe over-) reporting of visitor numbers [47] . These problems may confound estimation of absolute visitor numbers, but will have less impact on within-PA changes in visitor numbers over time, and so here we used all available information.
In total we were able to collate ≥6 y of data (between 1992 and 2006) for 280 PAs from 20 countries. We then expressed visitation trends at each PA in two ways—using total visit number, as a measure of the overall tourism benefit provided by the PA; and (as in [23] ) using visit number divided by national population size in that year (from [30] ), as a measure of per capita use of the PA. For PAs with large numbers of nondomestic visitors, tracking per capita use by dividing by national population size is imperfect (and data on visitor origins are too patchy for any more sophisticated adjustment by population size). However, data we obtained for 190 PAs (many lacking time series information and so excluded from our core analysis) indicate that, for all except one continent, a mean of >70% of visitors are nationals, so that errors caused through adjusting by national population size are relatively limited. The exception is Africa, where on average only ∼30% visitors are nationals. For this continent, adjustment by national population growth (which is also generally higher than elsewhere) is probably excessive and so negatively biases estimates of trends in per capita visit rates.
For each PA we next performed linear regressions of total visit number and per capita visit number on year, and derived standardised measures of rates of change (ranging from +1 to −1) as (slope/maximum total [or per capita] visit number predicted by the regression during the 15-y range). We explored geographical variation in trends in our two measures of visit numbers by calculating median standardised rates of change across continents, and across countries ( Table S1 ). We compared the latter with per capita GDP adjusted for purchasing power parity (PPP) (for 2005, from [30] ), using linear regression weighted by the number of PAs sampled in each country. As an additional check to see whether our results for total visit number were confounded by changes in national population size, we performed an equivalent weighted regression of national median change in total visit number versus annual population growth (for 1990–2006, from [30] ). Last, to see whether our findings were specific to nature-related tourism, we also obtained data on trends in all foreign arrivals between 1995 and 2005 (again from [30] ), and compared standardised national rates of change (calculated in the same way as for PA visits) with per capita GDP and with median standardised rates of change in total visit numbers.
Supporting Information
Median national rates of change in total numbers of PA visits in relation to annual population growth (1990–2006); the number of PAs sampled per country is reflected in point size.
https://doi.org/10.1371/journal.pbio.1000144.s001
(0.53 MB EPS)
Standardised annual change in foreign arrivals (1995–2005) in relation to per capita GDP (in 2005), adjusted for PPP; solid line represents the best model, dashed lines represent ±1 standard error (SE).
https://doi.org/10.1371/journal.pbio.1000144.s002
(0.58 MB EPS)
National values of annual rates of change in total and per capita visits to PAs, per capita GDP, number of PAs sampled, and annual rates of change in foreign arrivals.
https://doi.org/10.1371/journal.pbio.1000144.s003
(0.05 MB DOC)
Acknowledgments
We are very grateful to Abishek Behl, Graham Burton, Janet Cochrane, Ian Craigie, Phil Dearden, Dubiure Umaru Farouk, Richard Jenkins, Afan Jones, Chris Kirkby, N. Aldrin D. Mallari, Heather McNiff, Julia Ohl, Maria Otero, Lydia Napitupulu, Joep Stevens, Claudia Townsend, and others for providing visitation data; Emily Adams for retrieving socioeconomic information; and Ralf Buckley, Peter Kareiva, Agi Kiss, and Johan du Toit for commenting on previous versions of this paper.
Author Contributions
The author(s) have made the following declarations about their contributions: Conceived and designed the experiments: AB RN MW AM. Performed the experiments: AB JB JG RN MW AM. Analyzed the data: AB JB JG AM. Wrote the paper: AB RN AM. Obtained grant: AB.
- 1. Scholes RJ, Biggs R (2004) Ecosystem services in southern Africa: a regional perspective. Pretoria: Council for Scientific and Industrial Research.
- 2. World Travel and Tourism Council (2007) The global travel and tourism summit. London: World Travel and Tourism Council.
- View Article
- Google Scholar
- 4. Mastny L (2001) Treading lightly: new paths for international tourism. Washington: Worldwatch Institute.
- 5. Davenport L, Brockelman WY, Wright PC, Ruf K, Rubio del Valle FB (2002) Ecotourism tools for parks. In: Terborgh J, van Schaik C, Davenport L, Rao M, editors. Making parks work. Washington (D.C.): Island Press. pp. 279–306.
- 6. Millennium Ecosystem Assessment (2005) Ecosystems and human wellbeing: biodiversity synthesis. Washington (D.C.): World Resources Institute.
- 7. Boo E (1990) Ecotourism: the potentials and pitfalls. Washington (D.C.): World Wildlife Fund.
- 9. Ceballos-Lascurain H (1996) Tourism, ecotourism and protected areas. Gland (Switzerland): International Union for Conservation of Nature.
- 14. Pyle R (1993) Thunder tree: lessons from a secondhand landscape. New York: Houghton Mifflin.
- 15. Nabhan GP, Trimble S (1994) The geography of childhood: why children need wild places. Boston: Beacon Press.
- 17. Kahn PH, Kellert SR, editors. (2002) Children and nature. Cambridge (Massachusetts): MIT Press.
- 18. Barnes S (2007) How to be wild. London: Short Books.
- 19. Louv R (2005) Last child in the woods. Chapel Hill (North Carolina): Algonquin.
- 28. Ceballos-Lascurain H (1993) Ecotourism: a guide for planners and managers. Lindberg K, Hawkins DE, editors. North Bennington (Vermont): The Ecotourism Society. pp. 1–3.
- 29. Prosser R (1994) Societal change and the growth in alternative tourism. In: Cater E, Lowman G, editors. Ecotourism, a sustainable option? Chichester (U.K.): John Wiley. pp. 19–37.
- 30. World Bank (2008) World development indicators 2008. Washington (D.C.): World Bank Publications.
- 32. World Tourism Organization/Organisation Mondiale du Tourisme (2002) Tourism and poverty alleviation. Madrid: World Tourism Organization.
- 34. Walpole MJ, Thouless CR (2005) Increasing the value of wildlife through non-consumptive use? Deconstructing the myths of ecotourism and community-based tourism in the tropics. In: Woodroffe R, Thirgood S, Rabinowitz A, editors. People and wildlife: conflict or coexistence? Cambridge: Cambridge University Press. pp. 122–139.
- 39. Butynski TM, Kalima J (1998) Gorilla tourism: a critical look. In: Milner-Gulland EJ, Mace R, editors. Conservation of biological resources. Oxford: Blackwell Science. pp. 294–313.
- 45. World Conservation Union and United Nations Environment Programme-World Conservation Monitoring Centre (2007) World database on protected areas, version 2007. Cambridge: United Nations Environment Programme-World Conservation Monitoring Centre.
- 47. Cochrane J (2003) Ecotourism, conservation and sustainability: a case study of Bromo Tengger Semeru National Park, Indonesia. [Unpublished PhD thesis]. Hull (U.K.): University of Hull.
By: Bastian Herre , Veronika Samborska and Max Roser
Tourism has massively increased in recent decades. Aviation has opened up travel from domestic to international. Before the COVID-19 pandemic, the number of international visits had more than doubled since 2000.
Tourism can be important for both the travelers and the people in the countries they visit.
For visitors, traveling can increase their understanding of and appreciation for people in other countries and their cultures.
And in many countries, many people rely on tourism for their income. In some, it is one of the largest industries.
But tourism also has externalities: it contributes to global carbon emissions and can encroach on local environments and cultures.
On this page, you can find data and visualizations on the history and current state of tourism across the world.
Interactive Charts on Tourism
Cite this work.
Our articles and data visualizations rely on work from many different people and organizations. When citing this topic page, please also cite the underlying data sources. This topic page can be cited as:
BibTeX citation
Reuse this work freely
All visualizations, data, and code produced by Our World in Data are completely open access under the Creative Commons BY license . You have the permission to use, distribute, and reproduce these in any medium, provided the source and authors are credited.
The data produced by third parties and made available by Our World in Data is subject to the license terms from the original third-party authors. We will always indicate the original source of the data in our documentation, so you should always check the license of any such third-party data before use and redistribution.
All of our charts can be embedded in any site.
Our World in Data is free and accessible for everyone.
Help us do this work by making a donation.
What is nature tourism and why is it so popular?
Disclaimer: Some posts on Tourism Teacher may contain affiliate links. If you appreciate this content, you can show your support by making a purchase through these links or by buying me a coffee . Thank you for your support!
Nature tourism is a fantastic type of tourism and it is on the rise! But what is it and why is it so popular? Read on to learn more…
What is nature tourism?
Why is nature tourism important, what is the difference between nature tourism and ecotourism, types of nature tourism, bird watching, scuba diving, scenic driving, bush walking, visiting parks, fishing , cycling , nature tours, nature tourism- further reading.

Nature tourism is all about visiting natural areas and is closed aligned with the concept of rural tourism . Places that nature tourists might visit include might include beaches, forests or national parks. Activities focus on the natural environment rather than visiting man-mad features; think stargazing and hiking, for example. There are locations right across the globe which are perfect for nature tourism.
The CBI (Centre for the Promotion of Imports from Developing Countries) in the Netherlands define nature tourism as follows:
Nature tourism, also called nature-based tourism, is tourism based on the natural attractions of an area. It consists of responsible travel to experience natural areas and their landscape, flora and fauna, protecting the environment and improving the quality of life of locals.
Nature tourism is important as it allows people to see and appreciate the beauty of our natural environment. Through this kind of tourism, we are able to escape the pollution and pressures of city life – it is good for our physical and mental wellbeing to be out in nature, breathing in fresh air and seeing lush greenery or sparkly blue seas. Nature tourism also encourages visitors to take an interest in the natural environment, which may then translate to them making a more conscious effort where environmental issues are concerned. With climate change being an ever-present and ongoing issue, this is definitely a good thing.
Following on from this, nature tourism gives land owners, local communities and local governments more reason to preserve and take care of natural areas. If they know people will come to visit, it is in their best interest to look after these places and is a great incentive for developing their sustainable tourism provision. Visiting tourists can do wonders for local community pride this way.
As with all tourism, nature tourism brings in money . This economic boost trickles down through a whole community; people need places to stay, and food to eat, and they want to buy souvenirs. Hikers may need to buy replacement walking boots, and weary explorers will always need somewhere to rest their heads at night. Jobs are created and economies are boosted through natural tourism, in the surrounding areas of the specific locations too.
Is nature tourism different from ecotourism? Put simply, yes. They are very similar, but ecotourism is perhaps a more specialised branch of nature tourism if we were looking to clearly define the difference in some way. Nature tourism is about visiting an area – responsibly, yes – rather than actively aiming to learn about the environment and participating in its protection. A nature tourist might visit a beach and admire its beauty, while an ecotourist might join in with a beach clean-up. The lines are blurred, of course, as they so often are when we try to differentiate between types of tourism .

There are different types of nature tourism. This is where we will see similarities with another kind of tourism: adventure tourism. You can read all about adventure tourism here if you’re interested! However, the similarity is that both can be split into two ‘types’: hard and soft.
Soft nature tourism might involve bird watching, visiting a beach to sunbathe, gentle walks through country parks and so on. Hard nature tourism is a bit more tough going: mountain climbing, bush walking and scuba diving, for example. Below I’ll go into some of these specific examples, so you can see how diverse nature tourism is!
Nature tourism examples
There are many examples of nature tourism to be found. Keep reading to see what they are, and whether they fall into the hard or soft category.
Bird watching is an example of soft nature tourism. People of all ages and abilities can do this, with or without a guide. You just need some background knowledge of bird species (or a book explaining them) and perhaps some binoculars. the Gambia is a hotspot for bird watching!
This is more of an example of hard nature tourism. It’s much more adventurous, and requires specialist equipment and a guide or a lot of training/experience. Head under the water to see what kind of nature is on display down there: coral, fish, shells and so much more. It’s subjective, but Barracuda Point in Malaysia is apparently the most beautiful place in the world to scuba dive… and I am a big fan of diving in Dahab , Egypt too!
This is another ‘soft’ activity in that it is low-risk and doesn’t require physical exertion. The North Coast 500 in Scotland is an example of a famous scenic drive – this is a great way to experience nature. From rolling hills to winding rivers, there is so much to see out of the window from the comfort of your car. Another fantastic example is the Kings Highway in Jordan , where you will see endless desert, canyons and incredible rock formations.
Camping is, again, an example of soft nature tourism. While it’s a little more ‘involved’ than scenic driving, for example, it is still relatively low risk and most of us are able to participate. Mount Cook National Park in New Zealand is said to be one of the most beautiful places in the world to camp, with its green landscapes and snowy mountain scenery. Climbing Mount Kilimanjaro gives you some fantastic camping opportunities too- just make sure you buy the best wild camping tent !

While controversial, hunting tourism is an example of nature tourism as it takes place in natural spaces. It is definitely one for the hard category, as you need special equipment to do so and it can obviously be quite dangerous if you don’t know what you’re doing. It is also often a discussion point for ethical tourism .
For the most part, this is a very safe activity and therefore falls into the soft category again. Guided tours are available in all of the very best stargazing locations, such as El Teide National Park in Tenerife, and it has even spawned its own branch of tourism. This is known as dark sky tourism, and there are many examples of activities that fall within this. They include stargazing, of course, alongside seeing the Northern Lights, watching an eclipse, astronomy tours and staying in accommodations that offer a clear view of the night sky such as glass domes.

This can be dangerous in that it is all about going off the beaten track, and walking through bushes/on rough ground. Therefore we can categorise this as hard nature tourism; it is something you would do when hiking, and gives you a bit of an adrenaline kick!
One of the easiest and most common forms of nature tourism is simply visiting a park. Whether this is a UK national park or your local green space at home, visiting a park is a definite example of this type of tourism. You’ll see birds, insects, flowers, trees, grass and more. Have a leisurely stroll, cycle through or sit and eat a picnic surrounded by nature.
Fishing falls in the middle of the soft and hard categories. You do need specialist equipment, but with most types of fishing there is little to no risk to life involved. But you need to be in nature – by or even on a lake or river – to do it, so it definitely counts as a form of nature tourism. People have obviously been fishing for years as a source of food gathering, but it is also a recreational hobby enjoyed by many.
This is another middle of the road activity. Kayaking can be dangerous, although it usually isn’t – you’ll often have a guide with you, and of course specialist equipment (the kayak) is required. It’s a really fun activity that many people enjoy!
You can visit a beach and simply do… nothing! This is still an example of nature tourism, as beaches are natural environments. Bali has some of the most beautiful beaches in the world, and tourists flock there to relax and soak up the sunshine. Beaches are also usually near to bars and restaurants, and you might find people doing beach yoga or watching the sunrise/sunset. Thailand even has all-night moonlight beach parties. They are versatile and beautiful locations!

Again, another activity that could be considered hard or soft. It depends where you go, really. A gentle bike ride along a specific cycle lane through a park is nothing like mountain biking in harsh terrains. It’s all about the level of ability you have and what risks you’re willing to take. But cycling is definitely a great way to get out and about in nature. It is also a low-cost and eco-friendly activity, which makes it a winner from many angles.
These tend to be a longer duration than many activities mentioned above, which you may do regularly but for a few hours at a time. Nature tours are days or even weeks-long trips, out into the wilderness with nature and wildlife experts. You might travel by air or train, or go on a cruise, and your guide will be on hand to point out every aspect of nature there is to see. These nature tours will take visitors to some of the most beautiful destinations on earth, such as trekking in Chiang Mai , Croatia, seeing the glaciers in Iceland and Alaska, and gazing at the best waterfalls in Finger Lakes . They’ll set you back a fair bit, but the memories you’ll make seeing bears and waterfalls and glorious sunsets will more than make up for it!
If you enjoyed this article, I am sure that you will love these too!
- Homestay tourism: What is a homestay?
- Cultural tourism explained: What, why and where
- Volunteer tourism: The reasons why people volunteer
- What is adventure tourism and why is it so big?
- Rural tourism explained: What, where and why
Liked this article? Click to share!
UN Tourism | Bringing the world closer
Biodiversity.
- ECOTOURISM AND PROTECTED AREAS
share this content
- Share this article on facebook
- Share this article on twitter
- Share this article on linkedin
Ecotourism and Protected areas
According to the UN Tourism's definition, ecotourism refers to forms of tourism which have the following characteristics:
- All nature-based forms of tourism in which the main motivation of the tourists is the observation and appreciation of nature as well as the traditional cultures prevailing in natural areas.
- It contains educational and interpretation features.
- It is generally, but not exclusively organised by specialised tour operators for small groups. Service provider partners at the destinations tend to be small, locally owned businesses.
- It minimises negative impacts upon the natural and socio-cultural environment.
- Generating economic benefits for host communities, organisations and authorities managing natural areas with conservation purposes;
- Providing alternative employment and income opportunities for local communities;
- Increasing awareness towards the conservation of natural and cultural assets, both among locals and tourists.
Source: The British Ecotourism Market, UNWTO 2002
UN Tourism has been involved in the field of ecotourism since the early 1990s and developed a set of guidelines focusing on the strong link between protected area and tourism, with the aim of ensuring that tourism contributes to the purposes of protected areas and does not undermine them.
In the framework of the UN-declared International Year of Ecotourism (IYE) 2002, UN Tourism undertook a wide range of activities, including the organization of regional conferences and the World Ecotourism Summit , and published guidelines and methodologies for ecotourism development and market studies, as well as supported regional and national activities.
At the request of the United Nations General Assembly, the UN Tourism prepared a report on the activities undertaken by States and major international organizations in the framework of the International Year of Ecotourism . Also UN Tourism prepared a series of market reports to increase the knowledge of seven important countries considered “Ecotourism generating markets”.

- Market information
- Nature and Ecotourism
- Market Potential
- Share this on:
The European market potential for nature and ecotourism
Nature and ecotourism is one of the main tourism segments, which also includes adventure tourism. The products and services in this segment come in many forms, including wilderness and dark sky tourism. Attracting tourists to remote areas may disrupt their remoteness but may also offer many opportunities if you adopt practices that care for and respect nature. The Netherlands should be among your main target markets in this segment.
Contents of this page
- Product description
- What makes Europe an interesting market for nature and ecotourism?
- Which European countries offer most opportunities in nature and ecotourism
- What trends offer opportunities or pose threats in the nature and ecotourism market?
1. Product description
Nature tourism, also called nature-based tourism, is tourism based on the natural attractions of an area. It consists of responsible travel to experience natural areas and their landscape, flora and fauna, protecting the environment and improving the quality of life of locals.
Ecotourism, often referred to as sustainable tourism , can be considered as a specialism within nature tourism. Its focus is on learning about the environment, minimising negative impacts and contributing to environmental protection. Ecotourism is defined as ‘Responsible travel to natural areas that conserves the environment, sustains the well-being of the local people, and involves interpretation and education’ of all parties involved, according to the International Ecotourism Society and the Global Ecotourism Network . The main attractions in the ecotourism market are marine, national parks and other parks with a protected status, biodiversity, local cultures and traditional protectors of natural environments.
Nature and ecotourism attract people interested in a variety of natural and cultural resources, including being immersed in a rich, natural, cultural or historical experience.
Tourism New South Wales identifies four main categories in nature tourism, which are presented in figure 1.
Figure 1: The categories of nature tourism
Source: Tourism New South Whales
A wide array of products falls into the category of nature and ecotourism, including consumptive and adventurous as well as non-consumptive and contemplative activities. Examples include:
- nature tours, observation of flora and fauna, cultural and local heritage tourism , volcano tourism ;
- fishing tourism, cycling tourism , bird watching tourism , kayaking tourism, bush walking, hiking tourism, cold water tourism, hunting;
- visiting parks, scenic driving, photography tourism, camping;
- beach experiencing , relaxing, self-improvement travel.
One specific example is the trend of dark sky tourism to remote areas with a clear view of the night sky, away from artificial light pollution. This could include stargazing, watching an eclipse, watching the Northern or Southern Lights, visiting observatories, and attending guided tours, stargazing sessions, and astronomy tours. Dark sky tourism could be facilitated by a stay in a nature accommodation, such as a yurt, connecting with the local culture, specific stargazing hotels, or even dedicated cruises.
See these products for inspiration:
- Hurtigruten and Princess Cruises offer cruises including stargazing nights. Hurtigruten also provides lectures on astronomy.
- Elqui Domos hotel in Chile has telescopes for guests in their rooms.
- Baines’ Camp in Botswana, provides star baths and sky beds.
- Offer night walks for guest to observe the sky if you are in a remote area.
- Invest in low-profile opportunities like a sky bed, if you can assure privacy and safety, including from mosquitos and your climate allows.
Another example is wilderness tourism , where tourists seek undeveloped land with minimal human imprints. An example is Wilderness Tourism Tour Company in India. Tourists are drawn into these areas because of their remoteness. The downsides are the negative effects on nature and local communities .
There is a wide assortment of products that relate to the category of nature and ecotourism, but keep in mind that travellers often combine products during their holidays. They also complement it with other products and services particular to the specific destination, such as culture, food, relaxation, self-improvement, accommodation, transport, etc.
- Employ people from the local community. This contributes to the region, but also increases opportunities for community tourism.
- Offer a range of activities to your customers, especially activities involving the nature around your location.
- Promote your area’s different and unique natural attractions in your marketing, including its biodiversity.
- Provide trails and routes of different lengths and difficulty levels to meet the needs of nature and ecotourists of all skill levels and ages. Make sure these trails don’t endanger the local nature and its ecosystem.
- Consider producing festivals. When done well, they can contribute to local development goals. Festivals can raise awareness about local qualities and attract larger or novel target groups.
- Because nature tourism has many niche markets, offer a limited choice and fully dedicate your approach to that niche, so your product remains convincing as genuine in the eyes of travellers.
The remainder of this product factsheet focuses on the ecotourism market, sometimes also called sustainable tourism, responsible tourism, soft tourism and green tourism.
2. What makes Europe an interesting market for nature and ecotourism?
The demand for nature and ecotourism is high and will continue to grow. For some years now tourists have become more aware of leaving a positive impact on the destinations that they visit. According to the UK’s Travel Foundation, 75% of British travellers wanted a more responsible vacation in 2012. Forum for the Futures, also in 2012, estimated that 66% of travellers wanted an easier way to identify a green holiday. In a 2018 Booking.com survey, 87% of global travellers said they wanted to travel sustainably. Euronews even suggests an ecotravel boom in Europe.
It is not only the type of holiday that shows signs of change, but accommodation types as well. According to Booking.com , interest in an sustainable accommodation increased from 62% in 2016, to 65% in 2017 and 68% in 2018; meanwhile, the proportion of travellers who have not considered eco-friendly stays because they were unaware of their existence declined from 39% in 2016, to 38% in 2017, to 31% in 2018. These studies’ results are in line with the outcomes of a survey among the readers of Condé Nast Traveler, which showed that 58% said they choose a hotel based on whether the hotel gives back to local people and the planet.
Travel companies have recently noticed an increase in the number of trips that involve trekking and hiking. For example, the number of trekking and hiking trips booked at Jacada Travel doubled between 2015 and 2016, and again between 2016 and 2017.
Based on these developments, Virtuoso considers sustainable tourism part of a global travel transformation rather than a passing trend. SKIFT suggests that sustainability will be the mark of luxury in the years to come. Tourism New South Wales considers ecotourists the early adopters of personal values which many other market segments with potentially larger visitor numbers will follow.
There are several reasons for the rise of interest in ecotourism, or sustainable, green, soft or responsible tourism. According to Booking.com tourists report:
- being impressed by natural sights during their own travels (60%);
- noticing a visible impact of tourism at the destinations they have visited (54%);
- seeing the positive effect that sustainable tourism can have on locals (47%);
- seeing the unsustainable effects of tourism in their home country (42%);
- feeling guilty about the impact their vacation has had on the environment (32%).
Responsible Travel reports that travellers are increasingly seeking opportunities to reconnect with nature, other people, and seeking their own individual meaning, which may be caused by an increasingly digitally connected, work-centric, and material world.
Another driver is last-chance tourism , which is motivated by the desire to see threatened or diminishing natural attractions, including glaciers, coral reefs, endangered species and more.
- Act sustainably and be transparent about it. Above all, promote your reuse and recycling of materials, waste management initiatives, etc.
- Offer opportunities for travellers to contribute to the natural and social values of the destination and reduce their impact.
- Developing nature-based tourism requires tailor-made approaches to fit often highly sensitive local contexts.
- Consider serious leisure and project-based leisure for to visitors who are extremely interested in a particular leisure activity, even possibly hinting at a new career path. These travellers are very committed to their cause, more interested in staying longer to learn or to do more, and they are less hampered by barriers in terms of accessibility, travel time, and service level.
- Make the destination attractive by providing multiple reasons to visit: combine nature-based tourism with other types of tourism and leisure activities. Seek collaboration with other entrepreneurs within and outside the region to create routes and packages connecting points of interest.
3. Which European countries offer most opportunities in nature and ecotourism
Germany, France, the Netherlands, Belgium, Poland and the Czech Republic have the biggest share of outbound trips with nature as the primary motive. These six countries are considered the most relevant nature and ecotourism markets in Europe, with Germany standing out (see table 1).
Table 1: Top European nature and ecotourism markets
Sources: Statisca, Eurobarometer 432
The target market for nature and ecotourism is large. Probably the first studies conducted into the ecotourism market were the 2001 and 2002 UNWTO studies in the UK, Germany, Spain, France and Italy, which have not been updated. In a 2016 TNS study, respondents in the following countries mentioned ‘nature’ as the main reason for their holiday : Czech Republic (26%), Netherlands (25%), Bulgaria (23%), Romania (20%), Belgium (19%), and Poland (19%). Hover your mouse cursor or pointer over the map below to see the percentage of travellers who favour nature travel in each European country.
Keep in mind that these are statistics based on preferences. Because people in Western and Northern Europe generally have more money to spend, they will also spend more on nature and ecotourism as well. Keep in mind that these statistics show a preference for nature itself, not nature tourism, which also includes adventure tourism. Preferences for adventure tourism are included in our study on adventure tourism .
A proportion of 15% of German travellers see nature as the primary reason to visit a destination. Apparently, they are so impressed by the natural features of the destinations, that 25% mention it as a reason to return to the destination. Regardless of the duration of their holiday, most Germans like to purchase the components of their holidays themselves and separately (44% and 44% respectively). That might be the reason why the way they book their holidays is quite varied. Booking commercial services online (28%), booking private housing online (23%), booking via the counter of a travel agent (27%), and booking via a friend (26%), all have a similar share. Most Germans prefer to stay in a paid commercial accommodation such as a hotel, B&B, cruise or youth hostel, whether it is on a short (47%) or long (54%) holiday. During the orientation phase of a holiday, most Germans rely on recommendations by others (44%) or their own personal experience (39%).
Table 2: German key attitudes towards tourism
Of the European countries ranked in the top 6, France is where travellers least mention nature as a primary motive for visiting a destination, with a proportion of 14%. Nevertheless, natural features stand out as the primary reason to return (36%). Regardless of duration, package holidays (excluding all-inclusive packages) are the preferred holiday format (45%–46%). So, it might not come as a surprise that most holidays are purchased online in France, via providers such as tour operators or airline companies (33%) or concerning private housing (25%). The French prefer to spend their holidays with friends or relatives (long holidays 27%, short holidays 35%) or a paid accommodation, such as hotel, B&B, cruise or a youth hostel. Friends, colleagues and relatives provide the most important source of information when the French plan for their holidays (57%).
Table 3: French key attitudes towards tourism
Netherlands
A quarter of the Dutch travellers regard nature as the primary reason to visit a destination (25%). Twice as many refer to nature as the main reason to return: 53%. Most Dutch travellers prefer to purchase services and compose long (>13 days) holidays themselves (61%). Most holidays are booked online via commercial services, such as tour operators, airline companies, etc. (44%). The most preferred accommodation for the Dutch on long holidays is paid commercial accommodation, such as hotel, B&B, cruise, youth hostel, etc. (55%). The decision-making process is mainly informed by recommendations from friends, colleagues and relatives (47%).
Table 4: Dutch key attitudes towards tourism
One out of five Belgian travellers see nature as the primary reason to visit a destination (19%), while a slightly higher percentage mention it as the main reason to return (51%). If they go on a long holiday (>13 nights) they prefer a package deal (excl. all-inclusive) or to compose their package themselves staying in a commercially run accommodation (both a share of 38%). These are preferably booked via online commercial services, such as tour operators, airline companies, etc., excl. private housing from individuals: 38%. For these holidays, commercial accommodation such as hotel, B&B, cruise, youth hostel, etc. are the most popular type of accommodation (55%). When preparing their holidays, Belgians most often rely on recommendations by friends, colleagues and relatives (51%).
Table 5: Belgians key attitudes towards tourism
One out of five Polish tourists see nature as the primary reason to visit a destination (19%), while 58% see nature as their main reason to return. In the case of long holidays (>13 days), the Polish like to purchase and compose them themselves (45%), using online commercial services, private housing of individuals as the most frequent booking method (35%). Most Polish like to stay in a paid commercial accommodation, such as hotel, B&B, cruise, youth hostel, etc. (43%) these long holidays. Recommendations by friends, colleagues and relatives stand out among the information sources Polish travellers rely on when making their holiday decisions (61%).
Table 6: Polish key attitudes towards tourism
Czech Republic
A quarter of Czechs travellers regard nature as the primary reason to visit a destination (26%). More than twice as many mention nature as a reason to return: 59%. Most Czech travellers like package travel, but not all-inclusive (36% in case of long holidays, 37% with short holidays). There are three main methods the Czech use to book their holidays: through someone they know (26%), online commercial services – private housing individuals (24%), online commercial services, such as tour operators, airline companies, etc. (24%). During these holidays most Czech opt for a paid commercial accommodation, such as hotel, B&B, cruise, youth hostel, etc. (in case of long holidays a share of 42%, and in case of short holidays of 46%). During the preparation phase, recommendations by friends, colleagues and relatives (58%) are the most important information sources the Czechs rely on.
Table 7: Czech key attitudes towards tourism
- Target the Netherlands, one of the European countries with the highest average incomes, where tourists also have a high preference for nature. For more information, study the Netherlands’ market profile .
- Get certified if you own a hotel or accommodation or other tourism operator, as it will offer you many benefits . Depending on the kind of certification, it shows that you comply with the highest social and environmental standards. This is highly relevant in a market where environmental concerns among tourists is increasing and certification is increasingly used as a selection criterion by holidaymakers.
- Consider B Corp certification , like Bodhi Surf + Yoga has done. Learn how this company facilitates memorable learning experiences using surf, yoga, nature immersion, and community engagement, including an app for gest to use before, during and after the holiday. This website has a database of B Corp certified travel and leisure businesses in various countries.
- Promote your certification and the issuing body, especially if it is GSTC accredited. According to Booking.com , sufficient information on certification is a barrier to 32% of sustainable tourists. According to the Booking.com sustainable travel report 2019 , 72% of global travellers say they were not aware of the existence of eco-labels for vacation accommodations; 70% of them say they would be more likely to book an accommodation knowing it was eco-friendly; 62% would feel better about staying in an accommodation if they knew it had an eco-label; and 37% state that an international standard for identifying eco-friendly accommodation would help encourage them to travel more sustainably.
4. What trends offer opportunities or pose threats in the nature and ecotourism market?
Increasing demand for sustainable holidays.
Travellers are increasingly aware of and concerned with sustainability. When they choose a holiday destination, it is increasingly influenced by ethics, moral values, concerns about the environment and its ecosystems, including flora and animal protection and a desire to positively impact local communities. These travellers demand affordability and availability of environmentally friendly, sustainable and socially responsible tourism services and products. They want to reduce their holiday carbon footprint, but often want to improve the destination as well. That is why do good, feel good holidays and ecological tours are growing in popularity.
Various sources argue that ecotourists are generally willing to pay more for experiences, at least if they are authentic and meaningful, such as the Wildsea Network and others . Higher revenues allow to you to hire more qualified staff and to offer better travel experiences . However, costs are an obstacle for 42% of tourists to travelling more sustainably . Therefore, it might be easier to target tourists with more mainstream, nature-based interests and those seeking adventure activities, than ecotourists.
Among the reasons why European governments and travellers have been paying more attention to sustainability include climate change, plastic pollution, air and water pollution, land and water usage, dislocation of traditional societies, the negative impacts of overtourism on host communities, and international agreements, such as the Paris Agreement and the United Nations (UN) Sustainable Development Goals.
The UNWTO has a dedicated platform for tourism initiatives relating to the Sustainable Development Goals called Tourism for SDGs . The UNWTO book Tourism for Development – Volume II: Good Practices has numerous examples of good practices. Others include:
- Global Himalayan Expedition , India
- Las Terrazas Complex , Cuba
- El Carlos Ecotourism and Archaeological Centre , Colombia
Examples of businesses with strengths in specific areas of sustainability include:
In nature tourism:
- La Choza Chula , in Guatemala, runs turtle and mangrove tours, cooking classes, homestay programmes, cultural immersion programmes, volunteer programmes. They also offer weekly English classes for their guides, funded the construction of a library, set up a mobile library, and built a computer lab and a secondary school.
- Shewula Mountain Camp , in Swaziland, invites travellers to stay in their village and experience the rural lifestyle and culture of a Swazi community.
Environmentally friendly practices:
- Uniworld Cruises , Ireland: environmentally friendly river cruises.
- The Brando , in Tahiti, uses solar energy and sustainable coconut oil biofuel, running on 100% renewable energy.
- Baines Camp , in Botswana, was built using a frame of elephant manure and recycled cans.
- Jacada Travel , from London, invests in a portfolio of community projects aimed at helping fight climate change offsetting 100% of the carbon emissions from trips taken with them, including all flights.
- The Kulala Desert Lodge , in Namibia, uses electric bikes for guests to explore the Kulala concession.
Protection of cultural and natural heritage:
- Three Camel Lodge , in Mongolia, was built using ancient Mongolian Buddhist building techniques, without nails nor iron work.
Social responsibility and benefit sharing:
- Aqua Expeditions , in Peru, has doctors on river cruises deliver medical supplies and healthcare to remote Amazon villages.
- Children in the Wilderness and Wilderness Safaris : offer an environmental and life skills educational programme that inspires African children to care for their natural heritage.
- Study the UN Sustainable Development Goals , which could help you to identify short and long-term priorities. In the short term, you could start small. For example: reduce waste by implementing reusable dishes, provide clear rules for customers or involve them in contributing to sustainability in a beach clean-up or ‘ plogging ’. In the long term, the UN Sustainable Development Goals could help you to develop a strategy that integrates protecting the destination, promoting environmental leadership and community health into the travellers’ experience.
- Contribute to the local community quality of life and well-being, including economic and sociocultural well-being and fair incomes. See table 8 below for examples.
- Ecotourists generally know what they want and are quite independent. They will often plan and book their trip, travel needs and experiences themselves. So, as an accommodation or provider of local activities, make sure you have good online presence targeting this group and matching their needs.
- If you proceed with making your business more environmentally friendly or more sustainable you could try to get it certified . This will make it more visible to consumers who consider these labels during the planning phase of their holidays.
- Make your business or product more sustainable by, for example: - Using renewable energy sources - Increasing energy efficiency - Optimising use of resources - Promoting environmental protection - Investing in waste management and minimisation, like reducing plastic waste by banning plastic straws - Addressing carbon emissions, pollution and littering
Table 8: Examples of initiatives contributing to local communities’ quality of life
Health wellness and sports holidays
Health and healthy lifestyles are becoming increasingly important in tourists’ decision making. Ageing tourists, the typical lifestyles of Generations Y and Z, the growing middle class, and the technological and digital revolution, all contribute to the growing importance of the health trend. Wellness tourism in Europe is soaring. In a 2015 Eurobarometer survey of 33,000 people in 33 European countries, 13% of the respondents said that wellness, spa, and health treatments were their primary or secondary motivation to go on holiday.
Concerns about obesity, food sensitivity, and health in general, have changed people’s attitudes towards healthcare, nutrition, beauty, physical activity, and overall self-improvement. This development stimulates demand for personalised health, mental well-being, clean labels, botanicals, athleisure, and home-tech health and wearables to monitor personal health.
A large part of wellness tourism and the subsector with the biggest increases over the past few years consists of people who simply want to stay healthy. This market offers lots of opportunities in nature and ecotourism for SMEs, such as:
- activities in nature in combination with wellness, such as hiking for meditation, yoga and tai chi;
- thematic health hotels in nature;
- personalised health and wellness programmes;
- rejuvenation and psychological well-being;
- meditation and yoga;
- healthy menus and cooking classes;
- mobile health monitoring;
- holistic holidays;
- wellness trips and retreats built around a specific wellness activity, from bootcamps to meditation and silence retreats in a natural environment;
- spiritual travel with an adventure component.
- Read the Global Wellness Economy Monitor from the Global Wellness Institute , which provides relevant background information on this market segment.
Overtourism
The ongoing debate on overtourism is expected to have a positive effect on the demand for sustainable tourism , including nature and ecotourism that cause low impact on destinations and their natural and social environment. The increased public awareness is also motivating the travel industry to pay more attention to human rights and working conditions. The global growth of tourism overall is expected to further stimulate the debate on overtourism, its consequences, and the ways to manage it.
The overtourism problem, on the other hand, offers opportunities for businesses outside mass tourism, especially those promoting destinations that sell remoteness as a form of luxury.
Two companies that have tapped into this opportunity are:
- Hosteria Helsingfors (Argentina) – Built in the remote Los Glaciares National Park in Patagonia, this resort promotes its setting in the natural landscape, luxury services and sophisticated regional cuisine.
- Hoanib Skeleton Coast (Namibia) – Accessible only by chartered flight, deep in the Namibian desert, this resort promotes game drives for guests to appreciate the landscape and desert-adapted wildlife.
This study was carried out on behalf of CBI by Molgo and ETFI .
Please review our market information disclaimer .
Enter search terms to find market research
Do you have questions about this research?
Ask your question
Related research
- What is the demand for outbound tourism on the European market?
- What trends offer opportunities or pose threats on the European outbound tourism market?
- What are the requirements for tourism services in the European market?
- (opens in a new tab) Twitter
- (opens in a new tab) Facebook
- (opens in a new tab) LinkedIn
- Topics ›
- Millennial travel behavior in the U.S. ›
Top 10 Nature Destinations in the US
Sponsored post by booking.com.
Moutains, desert landscapes, and woodlands were among Booking.com's top 10 nature locations in the United States in 2023. The list was compiled from a selection of US destinations with the highest number of nature endorsements on the Booking.com platform, with Pigeon Forge in Tennessee in the top position. The mountain town not only offers easy access to hiking trails in the Smokey Mountains but is also home to Dollyville.
Description
This infographic shows the places in the US with the highest endorsements for nature on the booking.com platform.
Can I integrate infographics into my blog or website?
Yes, Statista allows the easy integration of many infographics on other websites. Simply copy the HTML code that is shown for the relevant statistic in order to integrate it. Our standard is 660 pixels, but you can customize how the statistic is displayed to suit your site by setting the width and the display size. Please note that the code must be integrated into the HTML code (not only the text) for WordPress pages and other CMS sites.

Infographic Newsletter
Statista offers daily infographics about trending topics, covering: Economy & Finance , Politics & Society , Tech & Media , Health & Environment , Consumer , Sports and many more.
Related Infographics
Independent hotels more sensitive to consumer trends than chains, which mode of transport is the most polluting, japan travel, japan’s tourism sector bounces back from covid slump, top issues governments should prioritize to support eu tourism, chinese tourists: the big spenders of the coming decade, size matters: chain hotels in europe have an economic advantage, sponsored post by booking.com, where hoteliers feel most threatened by climate change, sustainable tourism: collective responsibility of providers, travelers, and goverenments, a widening gap: smes struggling to keep up with large enterprises, european hoteliers’ biggest opportunities for 2024, 5% of americans are digital nomads, offline hotel bookings defy digitalization.
- Who may use the "Chart of the Day"? The Statista "Chart of the Day", made available under the Creative Commons License CC BY-ND 3.0, may be used and displayed without charge by all commercial and non-commercial websites. Use is, however, only permitted with proper attribution to Statista. When publishing one of these graphics, please include a backlink to the respective infographic URL. More Information
- Which topics are covered by the "Chart of the Day"? The Statista "Chart of the Day" currently focuses on two sectors: "Media and Technology", updated daily and featuring the latest statistics from the media, internet, telecommunications and consumer electronics industries; and "Economy and Society", which current data from the United States and around the world relating to economic and political issues as well as sports and entertainment.
- Does Statista also create infographics in a customized design? For individual content and infographics in your Corporate Design, please visit our agency website www.statista.design
Any more questions?
Get in touch with us quickly and easily. we are happy to help.
Feel free to contact us anytime using our contact form or visit our FAQ page .
Statista Content & Design
Need infographics, animated videos, presentations, data research or social media charts?
More Information
The Statista Infographic Newsletter
Receive a new up-to-date issue every day for free.
- Our infographics team prepares current information in a clear and understandable format
- Relevant facts covering media, economy, e-commerce, and FMCG topics
- Use our newsletter overview to manage the topics that you have subscribed to
Thank you for visiting nature.com. You are using a browser version with limited support for CSS. To obtain the best experience, we recommend you use a more up to date browser (or turn off compatibility mode in Internet Explorer). In the meantime, to ensure continued support, we are displaying the site without styles and JavaScript.
- View all journals
- My Account Login
- Explore content
- About the journal
- Publish with us
- Sign up for alerts
- Open access
- Published: 03 August 2021
Future global urban water scarcity and potential solutions
- Chunyang He ORCID: orcid.org/0000-0002-8440-5536 1 , 2 ,
- Zhifeng Liu ORCID: orcid.org/0000-0002-4087-0743 1 , 2 ,
- Jianguo Wu ORCID: orcid.org/0000-0002-1182-3024 1 , 2 , 3 ,
- Xinhao Pan 1 , 2 ,
- Zihang Fang 1 , 2 ,
- Jingwei Li 4 &
- Brett A. Bryan ORCID: orcid.org/0000-0003-4834-5641 5
Nature Communications volume 12 , Article number: 4667 ( 2021 ) Cite this article
93k Accesses
521 Citations
166 Altmetric
Metrics details
- Environmental sciences
- Water resources
Urbanization and climate change are together exacerbating water scarcity—where water demand exceeds availability—for the world’s cities. We quantify global urban water scarcity in 2016 and 2050 under four socioeconomic and climate change scenarios, and explored potential solutions. Here we show the global urban population facing water scarcity is projected to increase from 933 million (one third of global urban population) in 2016 to 1.693–2.373 billion people (one third to nearly half of global urban population) in 2050, with India projected to be most severely affected in terms of growth in water-scarce urban population (increase of 153–422 million people). The number of large cities exposed to water scarcity is projected to increase from 193 to 193–284, including 10–20 megacities. More than two thirds of water-scarce cities can relieve water scarcity by infrastructure investment, but the potentially significant environmental trade-offs associated with large-scale water scarcity solutions must be guarded against.
Abrupt reduction in shipping emission as an inadvertent geoengineering termination shock produces substantial radiative warming

Widespread societal and ecological impacts from projected Tibetan Plateau lake expansion

Streamflow seasonality in a snow-dwindling world
Introduction.
The world is rapidly urbanizing. From 1950 to 2020, the global population living in cities increased from 0.8 billion (29.6%) to 4.4 billion (56.2%) and is projected to reach 6.7 billion (68.4%) by 2050 1 . Water scarcity—where demand exceeds availability—is a key determinant of water security and directly affects the health and wellbeing of urban residents, urban environmental quality, and socioeconomic development 2 , 3 , 4 , 5 , 6 . At present, many of the world’s urban populations face water scarcity 3 . Population growth, urbanization, and socioeconomic development are expected to increase urban industrial and domestic water demand by 50–80% over the next three decades 4 , 7 . In parallel, climate change will affect the spatial distribution and timing of water availability 8 , 9 . As a result, urban water scarcity is likely to become much more serious in the future 10 , 11 , 12 , potentially compromising the achievement of the United Nations Sustainable Development Goals (SDGs) especially SDG11 Sustainable Cities and Communities and SDG6 Clean Water and Sanitation 13 , 14 .
Urban water scarcity has typically been addressed via engineering and infrastructure. Reservoirs are commonly used to store water during periods of excess availability and continuously supply water to cities to avoid water shortages during dry periods 15 . Desalination plants are increasingly used to solve water deficit problems for coastal cities 16 . For cities where local water resources cannot meet demand, inter-basin water transfer can also be an effective solution 17 (Supplementary Table 8 ). However, investment in water infrastructure is costly; requires substantial human, energy, and material resources; is limited by natural conditions such as geographic location and topography; and may have very significant environmental impacts 2 , 3 , 18 . Hence, a comprehensive understanding of water scarcity and the potential solutions for the world’s cities is urgently required to promote more sustainable and livable urban futures 7 , 18 , 19 .
Previous studies have evaluated urban water scarcity 2 , 3 , 7 , 19 (Supplementary Table 3 ). However, these studies have been limited in a number of ways including: assessing only a subset of the urban population (e.g., large cities only or regional in focus); considering only part of the water scarcity problem (i.e., availability but not withdrawal); or lacking a future perspective. For example, in assessing global urban water scarcity, Flörke et al. 7 considered 482 cities (accounting for just 26% of the global urban population) under a business-as-usual scenario, and while McDonald et al. 2 assessed a larger range of cities and scenarios, they considered water availability only, not withdrawals. As a result, significant uncertainty in estimates of current and future extent of urban water-scarcity remain, varying from 0.2 to 1 billion people affected in 2000 and from 0.5 to 4 billion in 2050 (Supplementary Table 4 ). A comprehensive assessment of global urban water scarcity is needed to identify cities at risk and provide better estimates of the number of people affected.
In addition, although many studies have discussed potential solutions to urban water scarcity, few have investigated the feasibility of these solutions for water-scarce cities at the global scale. Proposed solutions include groundwater exploitation, seawater desalination, increased water storage in reservoirs, inter-basin water transfer, improved water-use efficiency, and urban landscape management 2 , 3 , 14 , 19 . However, the potential effectiveness of these solutions for the world’s water-scarce cities depends on many factors including the severity of water scarcity, urban and regional geography and hydrogeology, socio-economic characteristics, and environmental carrying capacity 7 , 20 . Pairing the identification of water scarce cities with an evaluation of potential solutions is essential for guiding investment in future urban water security.
In this study, we comprehensively assessed global urban water scarcity in 2016 and 2050 and the feasibility of potential solutions for water-scarce cities. We first quantified the spatial patterns of the global urban population for 2016 at a grid-cell resolution of 1 km 2 by integrating spatial urban land-use and population data. We then identified water-scarce areas at the catchment scale by combining global water resource availability and demand data, and calculated the global urban population in water-scarce areas in 2016. We also quantified the global urban population in water-scarce areas for 2050 under four socioeconomic and climate change scenarios by combining modeled projections of global urban area, population, and water availability and demand. Finally, we evaluated the feasibility of seven major solutions for easing water scarcity for each affected city. We discuss the implications of the results for mitigating global urban water scarcity and improving the sustainability and livability of the world’s cities.
Current urban water scarcity
Globally, 933 million (32.5%) urban residents lived in water-scarce regions in 2016 (Table 1 , Fig. 1b ) with 359 million (12.5%) and 573 million (20.0%) experiencing perennial and seasonal water scarcity, respectively. India (222 million) and China (159 million) had the highest urban populations facing water scarcity (Table 1 , Fig. 1c ).

a spatial patterns of large cities in water-scarce areas (cities with population above 10 million in 2016 were labeled). b Water-scarce urban population at the global scale. c Water-scarce urban population at the national scale (10 countries with the largest values were listed). Please refer to Supplementary Data for urban water scarcity in each catchment.
Of the world’s 526 large cities (i.e., population >1 million), 193 (36.7%) were located in water-scarce regions (96 perennial, 97 seasonal) (Fig. 1a ). Of the 30 megacities (i.e., population >10 million), 9 (30.0%) were located in water-scarce regions (Table 2 ). Six of these, including Los Angeles, Moscow, Lahore, Delhi, Bangalore, and Beijing, were located in regions with perennial water scarcity and three (Mexico City, Istanbul, and Karachi) were seasonally water-scarce (Fig. 1a ).
Urban water scarcity in 2050
At the global scale, the urban population facing water scarcity was projected to increase rapidly, reaching 2.065 (1.693–2.373) billion people by 2050, a 121.3% (81.5–154.4%) increase from 2016 (Table 1 , Fig. 2a ). 840 (476–905) million people were projected to face perennial water scarcity and 1.225 (0.902–1.647) billion were projected to face seasonal water scarcity (Table 1 ). India’s urban population growth in water-scarce regions was projected to be much higher than other countries (Fig. 2b ), increasing from 222 million people to 550 (376–644) million people in 2050 and accounting for 26.7% (19.2%–31.2%) of the world’s urban population facing water scarcity (Table 1 ).

a Changes in water-scarce urban population at the global scale. Bars present the simulated results using the ensemble mean of runoff from GCMs, the total values (i.e., perennial and seasonal), and percentages are labeled. Crosses (gray/black) present the simulated results (total/perennial) using runoff from each GCM. b Changes in water-scarce urban population at the national scale (10 countries with the largest values were listed). Bars present the total values simulated using the ensemble mean of runoff from GCMs. Crosses present the total values simulated using runoff from each GCM. Please refer to Supplementary Data for urban water scarcity in each catchment.
Nearly half of the world’s large cities were projected to be located in water-scarce regions by 2050 (Fig. 3 , Supplementary Fig. 3 ). The number of large cities facing water scarcity under at least one scenario was projected to increase to 292 (55.5%) by 2050. The number of megacities facing water scarcity under at least one scenario was projected to increase to 19 (63.3%) including 10 new megacities (i.e., Cairo, Dhaka, Jakarta, Lima, Manila, Mumbai, New York, Sao Paulo, Shanghai, and Tianjin) (Table 2 ).

Only the water-scarce cities are listed. Cities with a population >10 million in 2016 are labeled.
Factors influencing urban water scarcity
Growth in urban population and water demand will be the main factor contributing to the increase in urban water scarcity (Fig. 4 ). From 2016 to 2050, population growth, urbanization, and socioeconomic development were projected to increase water demand and contribute to an additional 0.990 (0.829–1.135) billion people facing urban water scarcity, accounting for 87.5% (80.4–91.4%) of the total increase. Climate change was projected to alter water availability and increase the urban population subject to water scarcity by 52 (−72–229) million, accounting for 4.6% (−9.0–18.4%) of the total increase.

Bars present the simulated results using the ensemble mean of runoff from GCMs, crosses present the simulated results using runoff from each GCM.
Potential solutions to urban water scarcity
Water scarcity could be relieved for 276 (94.5%) large cities, including 17 (89.5%) megacities, via the measures assessed (Table 3 , Supplementary Table 5 ). Among these, 260 (89.0%) cities have the option of implementing two or more measures. For example, Los Angeles can adopt desalination, groundwater exploitation, inter-basin water transfer, and/or virtual water trade (Table 3 ). However, 16 large cities, including two megacities (i.e., Delhi and Lahore) in India and Pakistan, are restricted by geography and economic development levels, making it difficult to adopt any of the potential water scarcity solutions (Table 3 ).
Domestic virtual water trade was the most effective solution, which could alleviate water scarcity for 208 (71.2%) large cities (including 14 (73.7%) megacities). Inter-basin water transfer could be effective for 200 (68.5%) large cities (including 14 (73.7%) megacities). Groundwater exploitation could be effective for 192 (65.8%) large cities (including 11 (57.9%) megacities). International water transfer and virtual water trade showed potential for 190 (65.1%) large cities (including 10 (52.6%) megacities). Reservoir construction could relieve water scarcity for 151 (51.7%) large cities (including 10 (52.6%) megacities). Seawater desalination has the potential to relieve water scarcity for 146 (50.0%) large cities (including 12 (63.2%) megacities). In addition, water scarcity for 68 (23.3%) large cities, including five megacities (i.e., New York, Sao Paulo, Mumbai, Dhaka, and Jakarta), could be solved via the water-use efficiency improvements, slowed population growth rate, and climate change mitigation measures considered under SSP1&RCP2.6.
We have provided a comprehensive evaluation of current and future global urban water scarcity and the feasibility of potential solutions for water-scarce cities. We found that the global urban population facing water scarcity was projected to double from 933 million (33%) in 2016 to 1.693–2.373 billion (35–51%) in 2050, and the number of large cities facing water scarcity under at least one scenario was projected to increase from 193 (37%) to 292 (56%). Among these cities, 276 large cities (95%) can address water scarcity through improving water-use efficiency, limiting population growth, and mitigating climate change under SSP1&RCP2.6; or via seawater desalination, groundwater exploitation, reservoir construction, interbasin water transfer, or virtual water trade. However, no solutions were available to relieve water scarcity for 16 large cities (5%), including two megacities (i.e., Delhi and Lahore) in India and Pakistan.
Previous studies have estimated the global urban population facing water scarcity to be between 150 and 810 million people in 2000, between 320 and 650 million people in 2010, and increasing to 0.479–1.445 billion people by 2050 (Supplementary Table 4 ). Our estimates of 933 million people in 2016 facing urban water scarcity, increasing to 1.693–2.373 billion people by 2050, are substantially higher than previously reported (Supplementary Fig. 5a ). This difference is attributed to the fact that we evaluated the exposure of all urban dwellers rather than just those living in large cities (Supplementary Table 3 ). According to United Nations census data, 42% of the world’s urban population lives in small cities with a total population of <300,000 (Supplementary Fig. 4 ). Therefore, it is difficult to fully understand the global urban water scarcity only by evaluating the exposure of large cities. This study makes up for this deficiency and provides a comprehensive assessment of global urban water scarcity.
In addition, we used spatially corrected urban population data, newly released water demand/availability data, simulated runoff from GCMs in the most recent CMIP6 database, catchment-based estimation approach covering the upstream impacts on downstream water availability, and the new scenario framework combining socioeconomic development and climate change. Such data and methods can reduce the uncertainty in the spatial distribution of urban population and water demand/availability in the future, providing a more reliable assessment of global urban water scarcity.
Our projections suggest that global urban water scarcity will continue to intensify from 2016 to 2050 under all scenarios. By 2050, near half of the global urban population was projected to live in water-scarce regions (Figs. 2 , 3 ). This will directly threaten the realization of SDG11 Sustainable Cities and Communities and SDG6 Clean Water and Sanitation . Although 95% of water-scarce cities can address the water crisis via improvement of water-use efficiency, seawater desalination, groundwater exploitation, reservoir construction, interbasin water transfer, or virtual water trade (Supplementary Table 5 ), these measures will not only have transformative impacts on society and the economy, but will also profoundly affect the natural environment. For example, the construction of reservoirs and inter-basin water transfer may cause irreversible damage to river ecosystems and hydrogeology and change the regional climate 4 , 15 , 17 , 21 , 22 . Desalination can have serious impacts on coastal zones and marine ecosystems 16 , 23 . Virtual water trade will affect regional economies, increase transport sector greenhouse gas emissions, and may exacerbate social inequality and affect the local environments where goods are produced 19 , 24 .
Water scarcity solutions may not be available to all cities. The improvement of water-use efficiency as well as other measures require the large-scale construction of water infrastructure, rapid development of new technologies, and large economic investment, which are difficult to achieve in low- and middle-income countries by 2050 14 . In addition, there will be 16 large cities, such as Delhi and Lahore, that cannot effectively solve the water scarcity problem via these measures (Supplementary Table 5 ). These cities also face several socioeconomic and environmental issues such as poverty, rapid population growth, and overextraction and pollution of groundwater 25 , 26 , which will further affect the achievement of SDG1 No Poverty , SDG3 Good Health and Well-being , SDG10 Reduced Inequalities , SDG14 Life below Water and SDG15 Life on Land .
To address global urban water scarcity and realize the SDGs, four directions are suggested. We need to:
Promote water conservation and reduce water demand. Our assessment provides evidence that the proposed water conservation efforts under SSP1&RCP2.6 are effective, which results in the least water-scarce urban population (34–241 million fewer compared to other SSPs&RCPs) at the global scale and can mitigate water scarcity for 68 (23.3%) large cities. The application of emerging water-saving technologies and the construction of sponge cities, smart cities, low-carbon cities, and resilient cities as well as the development of new theories and methods such as landscape sustainability science, watershed science, and geodesign will also play an important role for the further water demand reduction 5 , 6 , 27 , 28 , 29 . To implement these measures, the cooperation and efforts of scientists, policy makers and the public, as well as sufficient financial and material support are required. In addition, international cooperation must be strengthened in order to promote the development and dissemination of new technologies, assist in the construction of water infrastructure, and raise public awareness of water-savings, particularly in the Global South 30 .
Control population growth and urbanization in water-scarce regions by implementing relevant policies and regional planning. Urban population growth increases both water stress and the exposure of people, making it a key driver exacerbating global urban water scarcity 2 . Hence, the limitation of urban population growth in water-scarce areas can help to address this issue. According to our estimation, the control of urbanization under SSP3&RCP7.0, which has the lowest urbanization rate among four scenarios, can reduce the urban population subject to water scarcity by 93–207 million people compared with the business-as-usual scenario (SSP2&RCP4.5) and the rapid urbanization scenario (SSP5&RCP8.5), including 80–178 million people in India alone by 2050 (Fig. 2 ). To realize this pathway, policies that encourage family planning as well as tax incentives and regional planning for promoting population migration from water-scarce areas to other areas are needed 18 . In particular, for cities such as Delhi and Lahore that are both restricted by geography and socioeconomic disadvantage and have few options for dealing with water scarcity, there is an urgent need to control urban population growth and urbanization rates.
Mitigate climate change through energy efficiency and emissions abatement measures to avoid water resource impacts caused by the change in precipitation and the increase in evapotranspiration due to increased temperature. Our contribution analysis shows that the impacts of climate change on urban water scarcity is quite uncertain (ranging from a reduction of 72 million water-scarce urban people to an increase of 229 million) under different scenarios and GCMs (Fig. 4 ). On average, climate change under the business-as-usual scenario (SSP2&RCP4.5) will increase the global water-scarce urban population by 31 million in 2050. If the emissions reduction measures under SSP1&RCP2.6 are adopted, the increase in global water-scarce urban population due to climate change will be cut by half (16 million) in 2050. Thus, mitigating climate change is also important to reducing urban water scarcity. Considering that climate change in water-scarce areas would be affected by both internal and external impacts, mitigating climate change requires a global effort 31 .
Undertake integrated local sustainability assessment of water scarcity solutions. Our assessment reveals that 208 (71.2%) large cities may address water scarcity through seawater desalination, groundwater exploitation, reservoir construction, interbasin water transfer, and/or virtual water trade (Supplementary Table 5 ). While our results provide a guide at the global scale, city-level decisions about which measures to adopt to alleviate water scarcity involve very significant investments and should be supported by detailed local assessments of their relative effectiveness weighed against the potentially significant financial, environmental, and socio-economic costs. Integrated analyses are needed to quantify the effects of potential solutions on reducing water scarcity, their financial and resource requirements, and their potential impacts on socio-economic development for water-scarce cities and the sustainability of regional environments. To guard against the potential negative impacts of these measures, comprehensive impact assessments are required before implementing them, stringent regulatory oversight and continuous environmental monitoring are needed during and after their implementation, and policies and regulations should be established to achieve the sustainable supply and equitable distribution of water resources 24 , 32 .
Uncertainty is prevalent in our results due to limitations in the methodology and data used. First, constrained by data availability, in the evaluation of urban water scarcity in 2016 we used water demand/availability data for 2014 derived from the simulation results of the PCRGLOBWB 2 model, and only considered the inter-basin water transfers listed in City Water Map and the renewable groundwater simulated from the PCRGLOBWB 2 model instead of all available groundwater 3 , 33 . In the assessment of urban water scarcity and feasibility of potential solutions in 2050, we used water demand data derived from Hanasaki et al. 34 , in which irrigated area expansion, crop intensity change, and improvement in irrigation water efficiency were considered, but the change in irrigation to adapt to climate change as well as the impacts of energy systems (e.g., bio-energy production, mining, and fossil fuel extraction) on water demand were not fully considered 35 . Second, in order to maintain consistency and comparability of the water stress index (WSI) with the PCRGLOBWB 2 outputs 33 , environmental flow requirements were not considered. Following Mekonnen and Hoekstra 36 and Veldkamp et al. 37 (2017), we used an extreme threshold for WSI of 1.0 (where the entire water available is withdrawn for human use). If a more conservative threshold (e.g., WSI = 0.4 which is the threshold defining high water stress) was used, estimated global water scarcity and the urban population exposed to water stress would be much higher 7 .
In summary, global urban water scarcity is projected to intensify greatly from 2016 to 2050. By 2050, nearly half of the global urban population (1.693–2.373 billion) were projected to live in water-scarce regions, with about one quarter concentrated in India, and 19 (63%) global megacities are expected to face water scarcity. Increases in urban population and water demand drove this increase, while changes in water availability due to climate change compounded the problem. About 95% of all water-scarce cities could find at least one potential solution, but substantial investment is needed and solutions may have significant environmental and socioeconomic consequences. The aggravation of global urban water scarcity and the consequences of potential solutions will challenge the achievement of several SDGs. Therefore, there is an urgent need to further improve water-use efficiency, control urbanization in water-scarce areas, mitigate water availability decline due to climate change, and undertake integrated sustainability analyses of potential solutions to address urban water scarcity and promote sustainable development.
Description of scenarios used in this study
To assess future urban water scarcity, we used the scenario framework from the Scenario Model Intercomparison Project (ScenarioMIP), part of the International Coupled Model Intercomparison Project Phase 6 (CMIP6) 38 . The scenarios have been developed to better link the Shared Socioeconomic Pathways (SSPs) and Representative Concentration Pathways (RCPs) to support comprehensive research in different fields to better understand global climatic and socioeconomic interactions 38 , 39 . We selected the four ScenarioMIP Tier 1 scenarios (i.e., SSP1&RCP2.6, SSP2&RCP4.5, SSP3&RCP7.0, and SSP5&RCP8.5) to evaluate future urban water scarcity. SSP1&RCP2.6 represents the sustainable development pathway of low radiative forcing level, low climate change mitigation challenges, and low social vulnerability. SSP2&RCP4.5 represents the business-as-usual pathway of moderate radiative forcing and social vulnerability. SSP3&RCP7.0 represents a higher level of radiative forcing and high social vulnerability. SSP5&RCP8.5 represents a rapid development pathway and very high radiative forcing 38 .
Estimation of urban water scarcity
To estimate urban water scarcity, we quantified the total urban population living in water-scarce areas 2 , 3 , 7 , 19 . Specifically, we first corrected the spatial distribution of the global urban population, then identified water-scarce areas around the world, and finally quantified the urban population in water-scarce areas at different scales (Supplementary Fig. 1 ).
Correcting the spatial distribution of global urban population
The existing global urban population data from the History Database of the Global Environment (HYDE) provided consistent information on historical and future population, but it has a coarse spatial resolution of 10 km (Supplementary Table 1 ) 40 , 41 . In addition, it was estimated using total population, urbanization levels, and urban population density, and does not align well with the actual distribution of urban land 42 . Hence, we allocated the HYDE global urban population data to high-resolution urban land data. We first obtained global urban land in 2016 from He et al. 42 . Since the scenarios used in existing urban land forecasts are now dated 43 , 44 , we simulated the spatial distribution of global urban land in 2050 under each SSP at a grid-cell resolution of 1km 2 using the zoned Land Use Scenario Dynamics-urban (LUSD-urban) model 45 , 46 , 47 (Supplementary Methods 1). The simulated urban expansion area in this study was significantly correlated with that in existing datasets (Supplementary Table 6 ). We then converted the global urban land raster layers for 2016 and 2050 into vector format to characterize the spatial extent of each city. The total population within each city was then summed and the remaining HYDE urban population cells located outside urban areas were allocated to the nearest city. Assuming that the population density within an urban area was homogeneous, we calculated the total population per square kilometer for all urban areas and converted this back to raster format at a spatial resolution of 1 km 2 . The new urban population data had much lower error than the original HYDE data (Supplementary Table 7 ).
Identification of global water-scarce areas
Annual and monthly WSI values were calculated at the catchment level in 2014 and 2050 as the ratio of water withdrawals (TWW) to availability (AWR) 33 . Due to limited data availability, we combined water-scarce areas in 2014 and the urban population in 2016 to estimate current urban water scarcity. WSI for catchment i for time t as:
For each catchment defined by Masutomi et al. 48 , the total water withdrawal (TWW t,i ) equalled the sum of water withdrawals (WW t , n , i ) for each sector n (irrigation, livestock, industrial, or domestic), while the water availability equalled the sum of available water resources for catchment i ( R t , i ), inflows/outflows of water resources due to interbasin water transfer ( \(\varDelta {{{{\mathrm{W{R}}}}}}_{t,i}\) ), and water resources from each upstream catchment j (WR t , i , j ):
The changes of water resources due to interbasin water transfer were calculated based on City Water Map produced by McDonald et al. 3 . The number of water resources from upstream catchment j was calculated based on its water availability (AWR t , i , j ) and water consumption for each sector n (WC t , n , i,j ) 49 :
For areas without upstream catchments, the number of available water resources was equal to the runoff. Following Mekonnen and Hoekstra 36 , and Hofste et al. 33 , we did not consider environmental flow requirements in calculating water availability.
Annual and monthly WSI for 2014 were calculated directly based on water withdrawal, water consumption, and runoff data from AQUEDUCT3.0 (Supplementary Table 1 ). The data from AQUEDUCT3.0 were selected because they are publicly available and the PCRaster Global Water Balance (PCRGLOBWB 2) model used in the AQUADUCT 3.0 can better represent groundwater flow and available water resources in comparison with other global hydrologic models (e.g., the Water Global Assessment and Prognosis (WaterGAP) model) 33 . The annual and monthly WSI for 2050 were calculated by combining the global water withdrawal data from 2000 to 2050 provided by the National Institute of Environmental Research of Japan (NIER) 34 and global runoff data from 2005 to 2050 from CMIP6 (Supplementary Table 1 ). Water withdrawal \({{{{{\mathrm{W{W}}}}}}}_{s,m,n,i}^{2050}\) in 2050 for each sector n (irrigation, industrial, or domestic), catchment i , and month m under scenario s was calculated based on water withdrawal in 2014 ( \({{{{{\mathrm{W{W}}}}}}}_{m,n,i}^{2014}\) ):
adjusted by the mean annual change in water withdrawal from 2000 to 2050 (WWR s , m , n , i ), calculated using the global water withdrawal for 2000 ( \({{{{{\mathrm{W{W}}}}}}}_{{{{{\mathrm{NIER}}}}},m,n,i}^{2000}\) ) and 2050 ( \({{{{{\mathrm{W{W}}}}}}}_{{{{{\mathrm{NIER}}}}},s,m,n,i}^{2050}\) ) provided by the NIER 34 :
Based on the assumption of a constant ratio of water consumption to water withdrawal in each catchment, water consumption in 2050 ( \({{{{{\mathrm{W{C}}}}}}}_{s,m,n,i}^{2050}\) ) was calculated as:
where \({{{{{\mathrm{W{C}}}}}}}_{m,n,i}^{2014}\) denotes water consumption in 2014. Due to a lack of data, we specified that water withdrawal for livestock remained constant between 2014 and 2050, and used water withdrawal simulation under SSP3&RCP6.0 provided by the National Institute of Environmental Research in Japan to approximate SSP3&RCP7.0.
To estimate water availability, we calculated available water resources ( \({R}_{s,m,i}^{2041-2050}\) ) for each catchment i and month m under scenario s for the period of 2041–2050 as:
based on the amount of available water resources with 10-year ordinary least square regression from 2005 to 2014 ( \({R}_{m,i}^{{{{{\mathrm{ols}}}}},\,2005-2014}\) ) from AQUEDUCT3.0 (Supplementary Table 1 ). \({\overline{R}}_{m,i}^{2005-2014}\) and \({\overline{R}}_{s,m,i}^{2041-2050}\) denote the multi-year average of runoff (i.e., surface and subsurface) from 2005 to 2014, and from 2041 to 2050, respectively, calculated using the average values of simulation results from 10 global climate models (GCMs) (Supplementary Table 2 ).
We then identified water-scarce catchments based on the WSI. Two thresholds of 0.4 and 1.0 have been used to identify water-scarce areas from WSI (Supplementary Table 4 ). While the 0.4 threshold indicates high water stress 49 , the threshold of 1.0 has a clearer physical meaning, i.e., that water demand is equal to the available water supply and environmental flow requirements are not met 36 , 37 . We adopted the value of 1.0 as a threshold representing extreme water stress to identify water-scarce areas. The catchments with annual WSI >1.0 were identified as perennial water-scarce catchments; the catchments with annual WSI equal to or <1.0 and WSI for at least one month >1.0 were identified as seasonal water-scarce catchments.
Estimation of global urban water scarcity
Based on the corrected global urban population data and the identified water-scarce areas, we evaluated urban water scarcity at the global and national scales via a spatial overlay analysis. The urban population exposed to water scarcity in a region (e.g., the whole world or a single country) is equal to the sum of the urban population in perennial water-scarce areas and that in seasonal water-scarce areas. Limited by data availability, we used water-scarce areas in 2014 and the urban population in 2016 to estimate current urban water scarcity. Projected water-scarce areas and urban population in 2050 under four scenarios were then used to estimate future urban water scarcity. In addition, we obtained the location information of large cities (with population >1 million in 2016) from the United Nations’ World Urbanization Prospects 1 (Supplementary Table 1 ) and identified those in perennial and seasonal water-scarce areas.
Uncertainty analysis
To evaluate the uncertainty across the 10 GCMs used in this study (Supplementary Table 2 ), we identified water-scarce areas and estimated urban water scarcity using the simulated runoff from each GCM under four scenarios. To perform the uncertainty analysis, the runoff in 2050 for each GCM was calculated using the following equation:
where \({R}_{s,g,m,i}^{2050}\) denotes the runoff of catchment i in month m in 2050 for GCM g under scenario s . \({R}_{g,m,i}^{2005-2014}\) and \({R}_{s,g,m,i}^{2041-2050}\) denote the multi-year average runoff from 2005 to 2014, and from 2041 to 2050, respectively, calculated using the simulation results from GCM g . Using the runoff for each GCM, the WSI in 2050 for each catchment was recalculated, water-scarce areas were identified, and the urban population exposed to water scarcity was estimated.
Contribution analysis
Based on the approach used by McDonald et al. 2 and Munia et al. 50 , we quantified the contribution of socioeconomic factors (i.e., water demand and urban population) and climatic factors (i.e., water availability) to the changes in global urban water scarcity from 2016 to 2050. To assess the contribution of socioeconomic factors ( \({{{{{\mathrm{Co{n}}}}}}}_{s,{{{{\mathrm{SE}}}}}}\) ), we calculated global urban water scarcity in 2050 while varying demand and population and holding catchment runoff constant ( \({{{{{\mathrm{UW{S}}}}}}}_{s,{{{{\mathrm{SE}}}}}}^{2050}\) ). Conversely, to assess the contribution of climate change ( \(Co{n}_{s,CC}\) ), we calculated scarcity while varying runoff and holding urban population and water demand constant ( \({{{{{\mathrm{UW{S}}}}}}}_{s,{{{{\mathrm{CC}}}}}}^{2050}\) ). Socioeconomic and climatic contributions were then calculated as:
Feasibility analysis of potential solutions to urban water scarcity
Potential solutions to urban water scarcity involve two aspects: increasing water availability and reducing water demand 2 . Approaches to increasing water availability include groundwater exploitation, seawater desalination, reservoir construction, and inter-basin water transfer; while approaches to reduce water demand include water-use efficiency measures (e.g., new cultivars for improving agricultural water productivity, sprinkler or drip irrigation for improving water-use efficiency, water-recycling facilities for improving domestic and industrial water-use intensity), limiting population growth, and virtual water trade 2 , 3 , 18 , 32 . To find the best ways to address urban water scarcity, we assessed the feasibility of these potential solutions for each large city (Supplementary Fig. 2 ).
First, we divided these solutions into seven groups according to scenario settings and the scale of implementation of each solution (Supplementary Fig. 2 ). Among the solutions assessed, water-use efficiency improvement, limiting population growth, and climate change mitigation were included in the simulation of water demand and water availability under the ScenarioMIP SSPs&RCPs simulations 34 . Here, we considered the measures within SSP1&RCP2.6 which included the lowest growth in population, irrigated area, crop intensity, and greenhouse gas emissions; and the largest improvements in irrigation, industrial, and municipal water-use efficiency 34 .
We then evaluated the feasibility of the seven groups of solutions according to the characteristics of water-scarce cities (Supplementary Fig. 2 ). Of the 526 large cities (with population >1 million in 2016 according to the United Nations’ World Urbanization Prospects), we identified those facing perennial or seasonal water scarcity under at least one scenario by 2050. We then selected the cities that no longer faced water scarcity under SSP1&RCP2.6 where the internal scenario assumptions around water-use efficiency, population growth, and climate change were sufficient to mitigate water scarcity. Following McDonald et al. 2 , 3 and Wada et al. 18 , we assumed that desalination can be a potential solution for coastal cities (distance from coastline <100 km) and groundwater exploitation can be feasible for cities where the groundwater table has not significantly declined. For cities in catchments facing seasonal water scarcity and with suitable topography, reservoir construction was identified as a potential solution. Inter-basin water transfer was identified as a potential solution for a city if nearby basins (i.e., in the same country, <1000 km away [the distance of the longest water transfer project in the world]) were not subject to water scarcity and had sufficient water resources to address the water scarcity for the city. Domestic virtual water trade was identified as a potential solution for a city if it was located in a country without national scale water scarcity. International water transfer or virtual water trade was identified as a feasible solution for cities in middle and high-income countries. Based on the above assumptions, we identified potential solutions to water scarcity in each city (see Supplementary Table 1 for the data used).
Data availability
All the data created in this study are openly available and the download information of supplementary data can be found in Github repositories with the identifier https://github.com/zfliu-bnu/Urban-water-scarcity . Other data are available from the corresponding author upon reasonable request.
United Nations (UN). 2018. 2018 Revision of World Urbanization Prospects. https://population.un.org/wup/ (2018).
McDonald, R. I. et al. Urban growth, climate change, and freshwater availability. Proc. Natl Acad. Sci. USA 108 , 6312–6317 (2011a).
Article ADS CAS PubMed PubMed Central Google Scholar
McDonald, R. I. et al. Water on an urban planet: Urbanization and the reach of urban water infrastructure. Glob. Environ. Change 27 , 96–105 (2014).
Article Google Scholar
Garrick, D. et al. Rural water for thirsty cities: a systematic review of water reallocation from rural to urban regions. Environ. Res. Lett. 14 , 043003 (2019).
Article ADS Google Scholar
Krueger, E., Rao, P. S. C. & Borchardt, D. Quantifying urban water supply security under global change. Glob. Environ. Change 56 , 66–74 (2019a).
Krueger, E. H. et al. Resilience dynamics of urban water supply security and potential of tipping points. Earth’s Future 7 , 1167–1191 (2019b).
Flörke, M., Schneider, C. & McDonald, R. I. Water competition between cities and agriculture driven by climate change and urban growth. Nat. Sustainability 1 , 51–58 (2018).
Revi, A. et al., eds. Climate Change 2014: Impacts, Adaptation, and Vulnerability. Part A: Global and Sectoral Aspects. Contribution of Working Group II to the Fifth Assessment Report of the Intergovernmental Panel on Climate Change. (Cambridge, Cambridge University Press, 2014).
Greve, P. et al. Global assessment of water challenges under uncertainty in water scarcity projections. Nat. Sustainability 1 , 486–494 (2018).
Vörösmarty, C. J., Green, P., Salisbury, J. & Lammers, R. B. Global water resources: Vulnerability from climate change and population growth. Science 289 , 284–288 (2000).
Article ADS PubMed Google Scholar
Schewe, J. et al. Multimodel assessment of water scarcity under climate change. Proc. Natl Acad. Sci. USA 111 , 3245–3250 (2014).
Article ADS CAS PubMed Google Scholar
IPCC (Intergovernmental Panel on Climate Change). Synthesis Report. Contribution of Working Groups I, II and III to the Fifth Assessment Report of the Intergovernmental Panel on Climate Change. (Cambridge University Press, Cambridge, 2014).
United Nations (UN). Transforming Our World: The 2030 Agenda for Sustainable Development. Seventieth Session of the United Nations General Assembly Resolution A/RES/70/1. (UN, New York, 2015).
Larsen, T. A., Hoffmann, S., Luthi, C., Truffer, B. & Maurer, M. Emerging solutions to the water challenges of an urbanizing world. Science 352 , 928–933 (2016).
Di Baldassarre, G. et al. Water shortages worsened by reservoir effects. Nat. Sustainability 1 , 617–622 (2018).
Lattemann, S. & Hopner, T. Environmental impact and impact assessment of seawater desalination. Desalination 220 , 1–15 (2008).
Article CAS Google Scholar
WWF. (2009). Interbasin water transfers and water scarcity in a changing world - a solution or a pipedream? WWF, Germany.
Wada, Y., Gleeson, T. & Esnault, L. Wedge approach to water stress. Nat. Geosci. 7 , 615–617 (2014).
Article ADS CAS Google Scholar
McDonald, R. I. et al. Global urban growth and the geography of water availability, quality, and delivery. Ambio 40 , 437–446 (2011b).
Article PubMed PubMed Central Google Scholar
Padowski, J. C. & Gorelick, S. M. Global analysis of urban surface water supply vulnerability. Environ. Res. Lett. 9 , 104004 (2014).
Vörösmarty, C. J. et al. Global threats to human water security and river biodiversity. Nature 467 , 555–561 (2010).
Article ADS PubMed CAS Google Scholar
Grill, G. et al. Mapping the world’s free-flowing rivers. Nature 569 , 215–221 (2019).
Roberts, D. A., Johnston, E. L. & Knott, N. A. Impacts of desalination plant discharges on the marine environment: a critical review of published studies. Water Res. 44 , 5117–5128 (2010).
Article CAS PubMed Google Scholar
Dalin, C., Konar, M., Hanasaki, N., Rinaldo, A. & Rodriguez-Iturbe, I. Evolution of the global virtual water trade network. Proc. Natl Acad. Sci. USA 109 , 5989–5994 (2012).
Rodell, M., Velicogna, I. & Famiglietti, J. S. Satellite-based estimates of groundwater depletion in India. Nature 460 , 999–U980 (2009).
Podgorski, J. & Berg, M. Global threat of arsenic in groundwater. Science 368 , 845–850 (2020).
Wu, J. Landscape sustainability science: ecosystem services and human well-being in changing landscapes. Landsc. Ecol. 28 , 999–1023 (2013).
Cheng, G. & Li, X. Integrated research methods in watershed science. Sci. China-Earth Sci. 58 , 1159–1168 (2015).
Lin, J. et al. Reframing water-related ecosystem services flows. Ecosyst. Serv. 50 , 101306 (2021).
Fu, B., Zhang, J., Wang, S. & Zhao, W. Classification–coordination–collaboration: a systems approach for advancing Sustainable Development Goals. Natl Sci. Rev. 7 , 838–840 (2020).
Seto, K. C. et al., eds. Climate Change 2014: Mitigation of Climate Change. Contribution of Working Group III to the Fifth Assessment Report of the Intergovernmental Panel on Climate Change. (Cambridge: Cambridge University Press, 2014).
Brown, T. C., Mahat, V. & Ramirez, J. A. Adaptation to future water shortages in the United States caused by population growth and climate change. Earth’s Future 7 , 219–234 (2019).
Hofste, R. W. et al. AQUEDUCT 3.0: Updated decision-relevant global water risk indicators. In. Washington, DC: World Resources Institute. https://doi.org/10.46830/writn.18.00146 (2019).
Hanasaki, N. et al. A global water scarcity assessment under Shared Socio-economic Pathways - Part 1: Water use. Hydrol. Earth Syst. Sci. 17 , 2375–2391 (2013).
Rosa, L. et al. Potential for sustainable irrigation expansion in a 3 °C warmer climate. Proc. Natl Acad. Sci. USA 117 , 29526–29534 (2020).
Mekonnen, M. M. & Hoekstra, A. Y. Four billion people facing severe water scarcity. Sci. Adv. 2 , e1500323 (2016).
Article ADS PubMed PubMed Central Google Scholar
Veldkamp, T. I. E. et al. Water scarcity hotspots travel downstream due to human interventions in the 20th and 21st century. Nat. Commun. 8 , 12 (2017).
O’Neill, B. C. et al. The Scenario Model Intercomparison Project (ScenarioMIP) for CMIP6. Geoscientific Model Dev. 9 , 3461–3482 (2016).
Stouffer, R. J. et al. CMIP5 scientific gaps and recommendations for CMIP6. Bull. Am. Meteorological Soc. 98 , 95–105 (2017).
Klein Goldewijk, K., Beusen, A. & Janssen, P. Long-term dynamic modeling of global population and built-up area in a spatially explicit way-HYDE 3.1. Holocene 20 , 565–573 (2010).
Klein Goldewijk, K., Beusen, A., Doelman, J. & Stehfest, E. New anthropogenic land use estimates for the Holocene-HYDE 3.2. Earth Syst. Sci. Data 9 , 927–953 (2017).
He, C. et al. Detecting global urban expansion over the last three decades using a fully convolutional network. Environ. Res. Lett. 14 , 034008 (2019).
Seto, K. C., Güneralp, B. & Hutyra, L. R. Global forecasts of urban expansion to 2030 and direct impacts on biodiversity and carbon pools. Proc. Natl Acad. Sci. USA 109 , 16083–16088 (2012).
Güneralp, B. & Seto, K. C. Futures of global urban expansion: uncertainties and implications for biodiversity conservation. Environ. Res. Lett. 8 , 14025 (2013).
He, C., Okada, N., Zhang, Q., Shi, P. & Li, J. Modelling dynamic urban expansion processes incorporating a potential model with cellular automata. Landsc. Urban Plan. 86 , 79–91 (2008).
He, C., Zhao, Y., Huang, Q., Zhang, Q. & Zhang, D. Alternative future analysis for assessing the potential impact of climate change on urban landscape dynamics. Sci. Total Environ. 532 , 48–60 (2015).
Liu, Z., Yang, Y., He, C. & Tu, M. Climate change will constrain the rapid urban expansion in drylands: a scenario analysis with the zoned Land Use Scenario Dynamics-urban model. Sci. Total Environ. 651 , 2772–2786 (2019).
Masutomi, Y., Inui, Y., Takahashi, K. & Matsuoka, Y. Development of Highly Accurate Global Polygonal Drainage Basin Data. Hydrological Process. 23 , 572–584 (2009).
Gassert, F., Luck, M., Landis, M., Reig, P. & Shiao, T. Aqueduct Global Maps 2.1: Constructing Decision-Relevant Global Water Risk Indicators. In. Washington, DC: World Resources Institute. https://www.wri.org/research/aqueduct-global-maps-21 (2014).
Munia, H. A. et al. Future transboundary water stress and its drivers under climate change: a global study. Earth’s Future 8 , e2019EF001321 (2020).
Download references
Acknowledgements
We thank Prof. N. Hanasaki (National Institute for Environmental Studies, Tsukuba, Japan) and Dr. Rutger W. Hofste (World Resources Institute, Washington, DC, USA) for providing global water demand/availability data. This work was supported by the Second Tibetan Plateau Scientific Expedition and Research Program (Grant No. 2019QZKK0405) and the National Natural Science Foundation of China (Grant No. 41871185 & 41971270). It was also supported by the project from the State Key Laboratory of Earth Surface Processes and Resource Ecology, China.
Author information
Authors and affiliations.
Center for Human-Environment System Sustainability (CHESS), State Key Laboratory of Earth Surface Processes and Resource Ecology (ESPRE), Beijing Normal University, Beijing, China
Chunyang He, Zhifeng Liu, Jianguo Wu, Xinhao Pan & Zihang Fang
School of Natural Resources, Faculty of Geographical Science, Beijing Normal University, Beijing, China
School of Life Sciences and School of Sustainability, Arizona State University, Tempe, AZ, USA
School of Environmental and Geographical Sciences (SEGS), Shanghai Normal University, Shanghai, China
Centre for Integrative Ecology, Deakin University, Melbourne, Australia
Brett A. Bryan
You can also search for this author in PubMed Google Scholar
Contributions
C.H., Z.L., J.W., and B.B. designed the study and planned the analysis. Z.L., X.P., Z.F., and J.L. did the data analysis. C.H., Z.L., and B.B. drafted the manuscript. All authors contributed to the interpretation of findings, provided revisions to the manuscript, and approved the final manuscript.
Corresponding author
Correspondence to Zhifeng Liu .
Ethics declarations
Competing interests.
The authors declare no competing interests.
Additional information
Peer review information Nature Communications thanks Helen Baron, Robert McDonald and Lorenzo Rosa for their contribution to the peer review of this work.
Publisher’s note Springer Nature remains neutral with regard to jurisdictional claims in published maps and institutional affiliations.
Supplementary information
Supplementary information, rights and permissions.
Open Access This article is licensed under a Creative Commons Attribution 4.0 International License, which permits use, sharing, adaptation, distribution and reproduction in any medium or format, as long as you give appropriate credit to the original author(s) and the source, provide a link to the Creative Commons license, and indicate if changes were made. The images or other third party material in this article are included in the article’s Creative Commons license, unless indicated otherwise in a credit line to the material. If material is not included in the article’s Creative Commons license and your intended use is not permitted by statutory regulation or exceeds the permitted use, you will need to obtain permission directly from the copyright holder. To view a copy of this license, visit http://creativecommons.org/licenses/by/4.0/ .
Reprints and permissions
About this article
Cite this article.
He, C., Liu, Z., Wu, J. et al. Future global urban water scarcity and potential solutions. Nat Commun 12 , 4667 (2021). https://doi.org/10.1038/s41467-021-25026-3
Download citation
Received : 30 October 2020
Accepted : 15 July 2021
Published : 03 August 2021
DOI : https://doi.org/10.1038/s41467-021-25026-3
Share this article
Anyone you share the following link with will be able to read this content:
Sorry, a shareable link is not currently available for this article.
Provided by the Springer Nature SharedIt content-sharing initiative
This article is cited by
Visual analysis method for unmanned pumping stations on dynamic platforms based on data fusion technology.
EURASIP Journal on Advances in Signal Processing (2024)
Global river economic belts can become more sustainable by considering economic and ecological processes
- Alistair George Liam Borthwick
Communications Earth & Environment (2024)
City level water withdrawal and scarcity accounts of China
- Zongyong Zhang
Scientific Data (2024)
Ultra-fast green hydrogen production from municipal wastewater by an integrated forward osmosis-alkaline water electrolysis system
- Gabriela Scheibel Cassol
Nature Communications (2024)
Harnessing the runoff reduction potential of urban bioswales as an adaptation response to climate change
- Matthew Johnson
- Faith Ka Shun Chan
Scientific Reports (2024)
By submitting a comment you agree to abide by our Terms and Community Guidelines . If you find something abusive or that does not comply with our terms or guidelines please flag it as inappropriate.
Quick links
- Explore articles by subject
- Guide to authors
- Editorial policies
Sign up for the Nature Briefing: Anthropocene newsletter — what matters in anthropocene research, free to your inbox weekly.


Putin Speaks Out on Ukraine Conflict Casualties
I n a rare disclosure on Wednesday, Russian President Vladimir Putin provided an update on the casualties and prisoners of war in the ongoing conflict with Ukraine. Speaking to international journalists in St. Petersburg, Putin claimed that Ukrainian losses substantially exceeded those of Russia, although he failed to provide evidence for his statements.
According to RIA Novosti, Putin informed leaders of global news agencies that Russia currently holds 1,348 of its soldiers and officers captive in Ukraine, compared to 6,465 Ukrainians detained by Russia. He further asserted that the ratio of "irretrievable losses" - fatalities not recoverable by either side - disproportionately favored Moscow, with a purported ratio of one to five.
"Our irretrievable losses are significantly smaller than those of the opposite party," Putin stated, as reported by the state-controlled Tass news agency . This claim contradicts the ongoing estimates from Ukrainian and U.S.
sources, which consistently indicate higher Russian casualties . As of Thursday, Ukraine's military reported the elimination of 515,000 Russian troops since the conflict escalated in February 2022. Ukrainian authorities also claim the destruction of over 7,800 tanks, 13,400 artillery units, and hundreds of aircraft and helicopters.
Despite these figures, detailed casualty statistics remain undisclosed by both Kyiv and Moscow.
Staggering Casualty Reports
In a rare acknowledgment, Ukrainian President Volodymyr Zelensky reported in February that 31,000 Ukrainian soldiers had been killed since the invasion's onset.
The New York Times, citing U.S. officials in August 2023, estimated the Ukrainian death toll at nearly 70,000. Western and U.S. estimates have largely aligned with Ukraine's reported data throughout the conflict. An American report from December suggested that Russian casualties - killed and wounded - totaled approximately 315,000, which accounts for nearly 90 percent of the forces involved in the initial invasion.
Further investigations by the BBC and Mediazona in April confirmed at least 50,000 Russian military deaths, a number substantially lower than the official count of 6,000 confirmed by Russia's Defense Ministry in September 2022.
This figure from the ministry is the only detailed casualty data released by Russian officials since the conflict began. The media investigation also highlighted a steep increase in Russian fatalities in the second year of the conflict, describing a relentless and costly offensive strategy by Moscow across multiple frontlines, often referred to as a " meat grinder ." This ongoing strategy reflects the intense and brutal nature of the warfare, suggesting significant human and material costs on both sides.
Like our content? Follow Celeb Tattler on MSN.
The Post Putin Speaks Out on Ukraine Conflict Casualties appeared first on Celeb Tattler
- Related: Alec Baldwin Allegedly Schemed to Influence Jury in Trial

COMMENTS
The global ecotourism market size was valued at USD 185.87 billion in 2021 and is expected to expand at a compound annual growth rate (CAGR) of 15.2% from 2022 to 2030. The growth is mainly driven by the rising popularity of immersive travel, outdoor recreational activities, and solo traveling coupled with rapid urbanization and the availability of cheap flights
Sustainable tourism worldwide - statistics & facts. Sustainable tourism, also known as ecotourism, or green tourism, is a form of tourism that attempts to take responsibility for its current and ...
Tourism Statistics. Get the latest and most up-to-date tourism statistics for all the countries and regions around the world. Data on inbound, domestic and outbound tourism is available, as well as on tourism industries, employment and complementary indicators. All statistical tables available are displayed and can be accessed individually ...
Premium. Ecotourism market size worldwide 2022-2028. Published by Statista Research Department , Jun 16, 2023. The global ecotourism industry worldwide was estimated at 172.4 billion U.S. dollars ...
Key ecotourism statistics. The global ecotourism market size is expected to have increased by 13.5% to $249.16 billion in 2024, from $219.53 billion in 2023, and is predicted to reach $428.97 billion in 2028. Choosing sustainable accommodation costs an average of $151 less per night, and was an average of 39% cheaper than non-sustainable options.
In 2016, travel and tourism contributed $7.6 trillion, or 10.2%, to total GDP, and the industry provided jobs to one in 10 people, according to the World Travel & Tourism Council. While nature-based tourism, which includes wildlife tourism, has been expanding rapidly in the last decade or so due to increased demand and opportunities, wildlife ...
ABSTRACT. Nature-based activities have become business constituents of increasing importance in the tourism industry. In this paper, trends in nature-based tourism with the largest commercial potentials are identified by means of surveys with 60 experts in five different countries/regions with a renowned nature-based tourism sector, collected in three rounds based on Delphi methodology.
This report is a testimony to what we can achieve together for nature's preservation, inspiring a global movement towards more sustainable and resilient tourism." Mr. Glenn Mandziuk, Sustainable Hotel Alliance CEO, said: "This report is a milestone for Travel and Tourism, representing our commitment as an industry to protect and conserve nature ...
The UNWTO Statistics Department is committed to developing tourism measurement for furthering knowledge of the sector, monitoring progress, evaluating impact, promoting results-focused management, and highlighting strategic issues for policy objectives.. The department works towards advancing the methodological frameworks for measuring tourism and expanding its analytical potential, designs ...
145 key tourism statistics. Data are collected from countries by UN Tourism through a series of yearly questionnaires that are in line with the International Recommendations for Tourism Statistics (IRTS 2008) standard led by UN Tourism and approved by the United Nations. The latest update took place in 24 November 2023. Access the data by ...
WASHINGTON, June 14, 2021 - A new World Bank report released today shows that for every dollar governments invest in protected areas and support for nature-based tourism, the economic rate of return is at least six-times the original investment.. The report, "Banking on Protected Areas: Promoting sustainable nature-based tourism to benefit local communities" found that the original ...
Introduction. Across southern Africa, nature-based tourism reportedly now generates roughly the same revenue as farming, forestry, and fisheries combined .Worldwide, tourism as a whole has been estimated to account for roughly 10% of gross domestic product (GDP) , with wildlife viewing and outdoor recreation (much of it centred on protected areas [PAs]) reportedly making up one of its fastest ...
According to the Yearbook of Tourism Statistics published by the World Tourism Organization, international tourism has increased from 522.2 billion US dollars in 1995 to nearly 1.86 trillion US ...
Tourism has massively increased in recent decades. Aviation has opened up travel from domestic to international. Before the COVID-19 pandemic, the number of international visits had more than doubled since 2000. Tourism can be important for both the travelers and the people in the countries they visit. For visitors, traveling can increase their ...
In 2022, the global online travel market amounted to as much as 474.8 billion U.S. dollars, a figure that was forecast to exceed one trillion U.S. dollars by 2030. Some of the leading travel ...
Nature tourism is all about visiting natural areas and is closed aligned with the concept of rural tourism. Places that nature tourists might visit include might include beaches, forests or national parks. Activities focus on the natural environment rather than visiting man-mad features; think stargazing and hiking, for example.
The resulting Fuzzy-AHP approach to NBTA was tested at the Changbai Mountain Bio-sphere Reserve, a popular nature-based tourism destination in China. The findings confirm that this Fuzzy-AHP approach is a more reliable and comprehensive method for evaluating the destination attractiveness than pre-existing approaches.
Ecotourism and Protected areas. According to the UN Tourism's definition, ecotourism refers to forms of tourism which have the following characteristics: All nature-based forms of tourism in which the main motivation of the tourists is the observation and appreciation of nature as well as the traditional cultures prevailing in natural areas.
We find that, between 2009 and 2013, tourism's global carbon footprint has increased from 3.9 to 4.5 GtCO 2 e, four times more than previously estimated, accounting for about 8% of global ...
Nature and ecotourism is one of the main tourism segments, which also includes adventure tourism. The products and services in this segment come in many forms, including wilderness and dark sky tourism. Attracting tourists to remote areas may disrupt their remoteness but may also offer many opportunities if you adopt practices that care for and respect nature.
They include, for instance, wildlife resources , cross-border natural resources management for the purpose of tourism , food-environment-hospitality relationships , environmental state of important touristic locations and geographical domains [26,27,28], and the state governance of nature-based tourism . Nonetheless, it is hoped that the ...
Nature tourism. In Russia, Nature Reserves have history and it has its own word of definition Zapovedniks (Russian: заповедник, plural заповедники, ) more than 100 Nature Reserves exist in Russia and more than 50 National Parks.National parks and sanctuaries of Russia include the Baikal Nature Reserve, the Altai Nature Reserve, the Lazovsky Nature Reserve, the Kedrovaya ...
by. Thomas Hinton , Jun 7, 2024. Moutains, desert landscapes, and woodlands were among Booking.com's top 10 nature locations in the United States in 2023. The list was compiled from a selection of ...
We found that the global urban population facing water scarcity was projected to double from 933 million (33%) in 2016 to 1.693-2.373 billion (35-51%) in 2050, and the number of large cities ...
Despite these figures, detailed casualty statistics remain undisclosed by both Kyiv and Moscow. ... This ongoing strategy reflects the intense and brutal nature of the warfare, suggesting ...